. 2024 Nov 22;26(1):bbae713.
doi: 10.1093/bib/bbae713.

QOT: Quantized Optimal Transport for sample-level distance matrix in single-cell omics

Affiliations

QOT: Quantized Optimal Transport for sample-level distance matrix in single-cell omics

Zexuan Wang et al. Brief Bioinform. .

Abstract

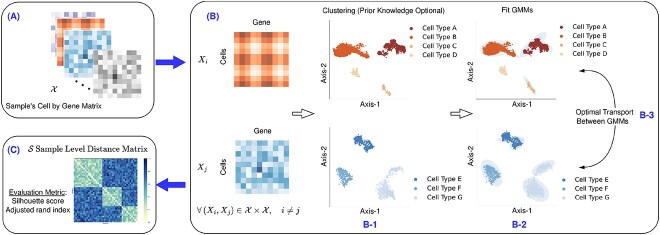
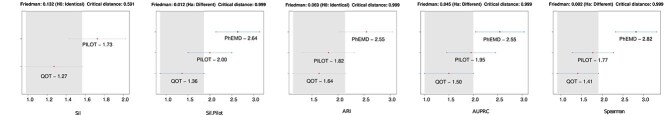
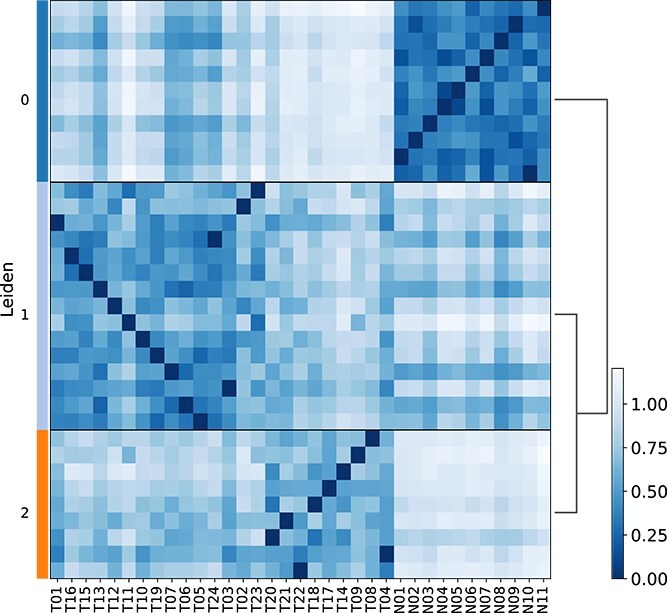
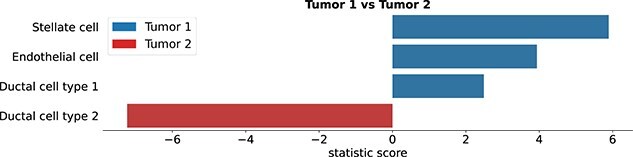
Single-cell technologies have enabled the high-dimensional characterization of cell populations at an unprecedented scale. The innate complexity and increasing volume of data pose significant computational and analytical challenges, especially in comparative studies delineating cellular architectures across various biological conditions (i.e. generation of sample-level distance matrices). Optimal Transport is a mathematical tool that captures the intrinsic structure of data geometrically and has been applied to many bioinformatics tasks. In this paper, we propose QOT (Quantized Optimal Transport), a new method enabling efficient computation of sample-level distance matrix from large-scale single-cell omics data through a quantization step. We apply our algorithm to real-world single-cell genomics and pathomics datasets, aiming to extrapolate cell-level insights to inform sample-level categorizations. Our empirical study shows that QOT outperforms existing two OT-based algorithms in accuracy and robustness when obtaining a distance matrix from high throughput single-cell measures at the sample level. Moreover, the sample level distance matrix could be used in the downstream analysis (i.e. uncover the trajectory of disease progression), highlighting its usage in biomedical informatics and data science.

Keywords: Gaussian Mixture Model; Wasserstein distance; optimal transport; quantization; single-cell genomics.


Figures

Figure 1
Figure 1
Schematic design of the proposed QOT algorithm. (A) Given the sample matrix, Space formula image, each matrix within it represents the single-cell gene expression for a sample. (B) The QOT algorithm processes this data as follows: (B-1) First, it clusters each sample matrix based on its cell type information. If no prior knowledge is available, the clustering is performed using HDBSCAN. (B-2) Subsequently, a GMM is used to model each cluster as a Gaussian distribution. (B-3) Finally, to derive the distance matrix between two samples, the OT-based Wasserstein distance is computed between their respective aussian Mixture Models, where two versions of the calculation methods are presented. (C) The result of this computation yields the sample level distance matrix and is available for further downstream analysis.
Figure 2
Figure 2
Friedman–Nemenyi test for PhEMD, PILOT, and QOT in real-world datasets. Methods are ranked from left to right under different evaluation metrics: Sil, Sil. Pilot, ARI, AUPRC, and Spearman Correlation. For each plot, the formula image-axis represents the rank of methods under different datasets for specific metrics. Lower rank values mean better-performing methods. The highlighted middle point for each method represents its mean rank across different datasets for specific metrics.
Figure 3
Figure 3
Annotated Hierarchical Distance Matrix for Subgroups within the PDAC Dataset. Each detected group is labeled to the right of the distance matrix. Detected group 0 consists of control samples, while groups 1 and 2 comprise all disease samples. Sample IDs are shown at the bottom, where N represents the control group, and T represents the disease group. The unsupervised subgroup detection separates the disease and control groups.
Figure 4
Figure 4
Cell types that show statistically significant changes between the two sub-groups, Tumor 1 and Tumor 2. Detected group 1 has been renamed Tumor 1, and detected group 2 has been renamed Tumor 2.
Figure 5
Figure 5
The genes that are differentially expressed in Ductal Cell Type 1 between Tumor 1 and Tumor 2 is listed below. The threshold for statistical significance was set at a p-value of 0.05.
Figure 6
Figure 6
The top 20 genes contribute most to the model’s clustering performance. The contributions were calculated using an adjusted Shapley value framework, employing a leave-one-out strategy to estimate each gene’s impact on the overall model. The genes are arranged in descending order of their contributions, with INS, MT2A, and FXYD2 showing the highest influence.
Figure 7
Figure 7
Sil and Sil. Pilot score variation with different Gaussian components per cell type. Memory outage and singular value issues occur when applying the PhEMD package to a real-world dataset, and therefore, PhEMD is absent in the Sil plot.

Update of

Similar articles

References

    1. Levine JH, Simonds EF, Bendall SC. et al. Data-driven phenotypic dissection of AML reveals progenitor-like cells that correlate with prognosis. Cell 2015;162:184–97. 10.1016/j.cell.2015.05.047. - DOI - PMC - PubMed
    1. Wang B, Zhu J, Pierson E. et al. Visualization and analysis of single-cell RNA-seq data by kernel-based similarity learning. Nat Methods 2017;14:414–6. 10.1038/nmeth.4207. - DOI - PubMed
    1. Bülow RD, Hölscher DL, Costa IG. et al. Extending the landscape of omics technologies by pathomics. NPJ Syst Biol Appl 2023;9:38. 10.1038/s41540-023-00301-9. - DOI - PMC - PubMed
    1. Hölscher DL, Bouteldja N, Joodaki M. et al. Next-generation morphometry for pathomics-data mining in histopathology. Nat Commun 2023;14:470. 10.1038/s41467-023-36173-0. - DOI - PMC - PubMed
    1. Peidli S, Green TD, Shen C. et al. scPerturb: harmonized single-cell perturbation data. Nat Methods 2024;21:531–40. 10.1038/s41592-023-02144-y. - DOI - PubMed