

Relationship Between Intraocular Pressure and the True Rate of Functional and Structural Progression in the United Kingdom Glaucoma Treatment Study
- PMID: 39808119
- PMCID: PMC11737456
- DOI: 10.1167/iovs.66.1.32
Relationship Between Intraocular Pressure and the True Rate of Functional and Structural Progression in the United Kingdom Glaucoma Treatment Study
Abstract
Purpose: To investigate the effect of average intraocular pressure (IOP) on the true rate of glaucoma progression (RoP) in the United Kingdom Glaucoma Treatment Study (UKGTS).
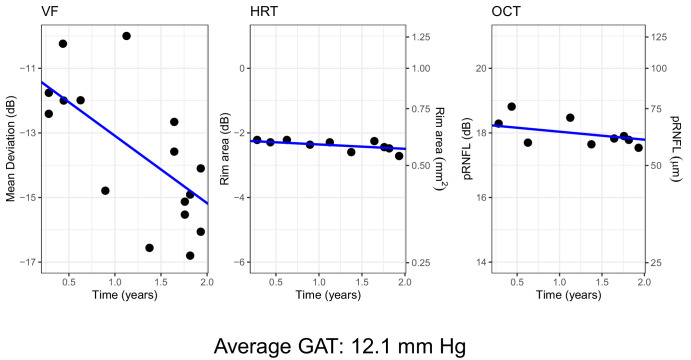
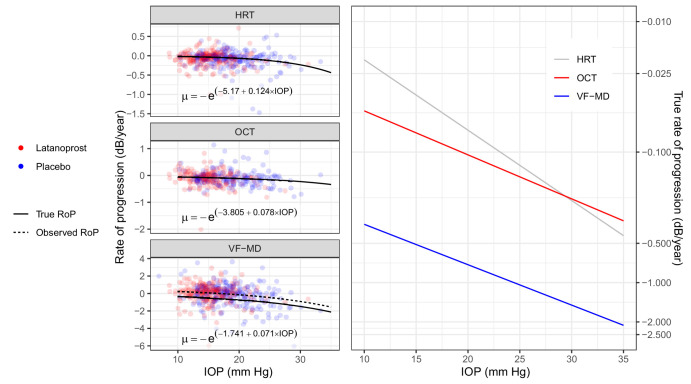
Methods: UKGTS participants were randomized to placebo or Latanoprost drops and monitored for up to two years with visual field tests (VF, 24-2 SITA standard), IOP measurements, and optic nerve imaging. We included eyes with at least three structural or functional assessments (VF with <15% false-positive errors). Structural tests measured rim area (RA) with Heidelberg retina tomography (HRT) and average peripapillary retinal nerve fiber layer (pRNFL) thickness with optical coherence tomography (OCT). One eye of 436 patients (222 on Latanoprost) was analyzed. A Bayesian hierarchical model estimated the true RoP of VF and structural metrics, and their correlations, using sign-reversed multivariable exponential distribution. RA and pRNFL measurements were converted to a dB scale, matching the VF metric (mean deviation [MD]). The effect of average IOP on the true RoPs was estimated.
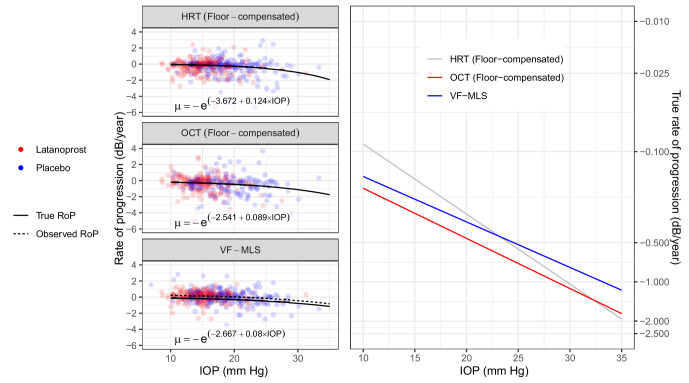
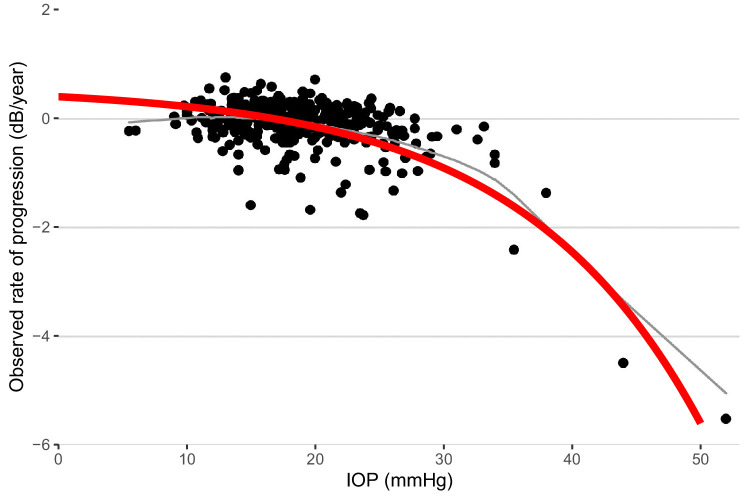
Results: True RoP at the mean average IOP (17 mm Hg) was faster (P < 0.001) for VF-MD (-0.59 [-0.73, -0.48] dB/year) than HRT-RA (-0.05 [-0.07, -0.03] dB/year) and OCT-pRNFL (-0.08 [-0.11, -0.06] dB/year). The proportional acceleration of RoP per mm Hg increase was, however, not significantly different (smallest P = 0.15). Accounting for the structural floor-effect largely eliminated the differences in RoPs (smallest P = 0.25).
Conclusions: VF appeared to deteriorate at a faster rate than structural measurements. However, this could be explained by the floor-effect from nonfunctional tissue. IOP induced a similar acceleration in RoP per mm Hg increase.
Conflict of interest statement
Disclosure:
Figures
Similar articles
-
Does the Visual Field Improve After Initiation of Intraocular Pressure Lowering in the United Kingdom Glaucoma Treatment Study?Am J Ophthalmol. 2025 Jan;269:346-354. doi: 10.1016/j.ajo.2024.08.023. Epub 2024 Aug 28. Am J Ophthalmol. 2025. PMID: 39209207 Clinical Trial.
-
Relationship between Intraocular Pressure Fluctuation and Visual Field Progression Rates in the United Kingdom Glaucoma Treatment Study.Ophthalmology. 2024 Aug;131(8):902-913. doi: 10.1016/j.ophtha.2024.02.008. Epub 2024 Feb 13. Ophthalmology. 2024. PMID: 38354911 Clinical Trial.
-
The United Kingdom Glaucoma Treatment Study: a multicenter, randomized, double-masked, placebo-controlled trial: baseline characteristics.Ophthalmology. 2013 Dec;120(12):2540-2545. doi: 10.1016/j.ophtha.2013.07.054. Epub 2013 Oct 11. Ophthalmology. 2013. PMID: 24126032 Clinical Trial.
-
Progression of primary open angle glaucoma in asymmetrically myopic eyes.Graefes Arch Clin Exp Ophthalmol. 2016 Jul;254(7):1331-7. doi: 10.1007/s00417-016-3332-z. Epub 2016 Apr 11. Graefes Arch Clin Exp Ophthalmol. 2016. PMID: 27063279
-
[Open-angle glaucoma: diagnosis, follow up and treatment. A systematic literature review from SBU].Lakartidningen. 2010 May 12-25;107(19-20):1311-3. Lakartidningen. 2010. PMID: 20556984 Swedish. No abstract available.
References
-
- Garway-Heath DF, Crabb DP, Bunce C, et al. .. Latanoprost for open-angle glaucoma (UKGTS): a randomised, multicentre, placebo-controlled trial. Lancet. 2015; 385: 1295–1304. - PubMed
-
- Heijl A, Leske MC, Bengtsson B, et al. .. Reduction of intraocular pressure and glaucoma progression: results from the Early Manifest Glaucoma Trial. Arch Ophthalmol. 2002; 120: 1268–1279. - PubMed
-
- Kim JH, Rabiolo A, Morales E, et al. .. Risk factors for fast visual field progression in glaucoma. Am J Ophthalmol. 2019; 207: 268–278. - PubMed
-
- De Moraes CG, Juthani VJ, Liebmann JM, et al. .. Risk factors for visual field progression in treated glaucoma. Arch Ophthalmol. 2011; 129: 562–568. - PubMed
-
- Aptel F, Lesoin A, Chiquet C, Aryal-Charles N, Noel C, Romanet JP.. Long-term reproducibility of diurnal intraocular pressure patterns in patients with glaucoma. Ophthalmology. 2014; 121: 1998–2003. - PubMed
Publication types
MeSH terms
Substances
LinkOut - more resources
Full Text Sources
Medical
Miscellaneous
