. 2025 Apr 1;74(4):528-543.
doi: 10.2337/db24-0419.

Cisplatin Exposure Dysregulates Insulin Secretion in Male and Female Mice

Affiliations

Cisplatin Exposure Dysregulates Insulin Secretion in Male and Female Mice

Lahari Basu et al. Diabetes. .

Abstract

Cancer survivors who receive cisplatin chemotherapy have an increased risk of type 2 diabetes, but the underlying mechanisms remain unclear. The aim of this study was to investigate whether cisplatin impacts β-cell health and function, thereby contributing to increased type 2 diabetes risk in cancer survivors. In vivo and in vitro cisplatin exposure dysregulated insulin secretion in male and female mice. In vitro cisplatin exposure reduced oxygen consumption, impaired β-cell exocytotic capacity, and altered expression of genes within the insulin secretion pathway in mouse islets. Understanding how chemotherapeutic drugs cause β-cell injury is critical for designing targeted interventions to reduce the risk of cancer survivors developing type 2 diabetes after treatment.


Conflict of interest statement

Duality of Interest. No potential conflicts of interest relevant to this article were reported.

Figures

Figure 1
Figure 1
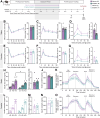
In vivo cisplatin exposure decreases plasma insulin in both male and female mice. A: Schematic summary timeline of the study. Male and female mice (n = 6 per sex per treatment group) were injected with vehicle control or 2 mg/kg cisplatin every other day over the course of 2 weeks and then tracked for 2 weeks following the exposure period. Mice were euthanized 2 weeks postexposure. BG: Insulin tolerance 1 week postexposure (B and E), glucose tolerance 2 weeks postexposure (C and F), and plasma insulin levels 2 weeks postexposure (D and G) were assessed in male (BD) and female (EG) mice. Data are presented in line graphs and as areas under the curve. HO: Islets isolated from male (HK) and female (LO) mice 2 weeks postexposure were used in ex vivo functional analyses. Static GSIS (H and L) was determined following sequential 1-h incubations in LG (2.8 mmol/L), HG (16.7 mmol/L), and KCl (30 mmol/L) buffer, the stimulation index (I and M) was calculated as the ratio of insulin secretion under HG to LG conditions, and insulin content (J and N) was measured following an overnight incubation in acid ethanol. Oxygen consumption rates (K and O) were measured in mouse islets using a Seahorse XFe24 Analyzer. Data are mean ± SEM. *P < 0.05 (n = 4–6 per treatment group). The following statistical analyses were used: BF, line graphs, repeated-measures two-way ANOVA with Šidák multiple comparison test, and bar graphs, two-tailed unpaired t test; G, line graphs, repeated-measures two-way mixed-effects ANOVA with Šidák multiple comparison test, and bar graphs, two-tailed unpaired t test, H, L, K, O, repeated-measures two-way ANOVA with Šidák multiple comparison test; and I, J, M, and N, two-tailed unpaired t test. F, female; M, male.
Figure 2
Figure 2
In vitro cisplatin exposure impairs oxygen consumption and insulin secretion in both male and female isolated islets. A: A schematic overview of the in vitro exposure protocol. Intact mouse islets were isolated from male and female mice and then exposed to vehicle or 10 μmol/L cisplatin for 48 h prior to functional analyses. BQ: Both assays were conducted in isolated islets from male (BI) and female (JQ) mice. Oxygen consumption (B and J) was measured in vitro using a Seahorse XFe24 Analyzer (n = 5 per treatment group). Insulin secretion (C and K) was measured dynamically (n = 3–4 per treatment group) approximately every 5 min while islets were perifused with buffers containing LG (2.8 mmol/L), HG (16.7 mmol/L), and KCl (30 mmol/L). Areas under the curve (DI and LQ) for islets perifused with LG buffer (DF and LN), HG buffer during the first phase of insulin secretion (G and O), HG buffer during the second phase of insulin secretion (H and P), and KCl buffer (I and Q). Data are mean ± SEM. *P < 0.05. The following statistical analyses were used: B, J, and K, repeated-measures two-way ANOVA with Tukey multiple comparison test; C, repeated-measures two-way mixed-effects ANOVA with Tukey multiple comparison test; DI, two-tailed paired t test; and LQ, two-tailed unpaired t test. F, female; M, male.
Figure 3
Figure 3
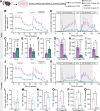
Cisplatin exposure does not cause significant cell death in mouse islets over the course of 48 h. A: Schematic summary of in vitro exposure protocol. Islets were isolated from male mice and exposed to 10 μmol/L cisplatin or vehicle in vitro. A subset of islets was collected after 6-, 24-, and 48-h incubation periods and used for cell viability assays and qPCR analyses. B: Representative brightfield images showing mouse islets immediately before (0 h), 6, 24, and 48 h after treatment. C: Percentage of cells stained with PI in a field of view 6, 24, and 48 h after chemical exposure. D: Representative images of cell viability assays performed at 6, 24, and 48 h after chemical exposure. Live cells take up calcein and fluoresce green; dead/dying cells take up PI and fluoresce red. All scale bars = 500 μm. Data are mean ± SEM (n = 6 per treatment group). The graph (C) was analyzed using a repeated-measures two-way ANOVA with Šidák multiple comparison test. M, male.
Figure 4
Figure 4
Cisplatin exposure causes dysregulated insulin secretion and exocytotic capacity in male mouse islets. A: Schematic summary of in vitro exposure protocol. Intact islets isolated from male mice were exposed to 10 μmol/L cisplatin or vehicle for 48 h or dispersed into single-cell solution and exposed to 10 μmol/L cisplatin or vehicle for 4 h in vitro before functional analyses. B: Insulin secretion was determined using static GSIS (n = 7–8 mice per group) following sequential 1-h incubations in LG (2.8 mmol/L) and HG (16.7 mmol/L) buffer. C: The stimulation index was calculated as the ratio of insulin secretion under HG conditions to LG conditions. D: Islet insulin content was measured following an overnight incubation in acid ethanol. EJ: Representative traces (E and H), average total responses (F and I), and cumulative capacitance (G and J) of β-cell exocytosis induced by a series of 500-ms membrane depolarizations from −70 mV to 0 mV (n = 5–6 mice; 19–21 cells per group) in LG (EG) and HG (HJ) conditions. Data are mean ± SEM. *P < 0.05. The following statistical tests were used: B, repeated-measures two-way mixed-effects ANOVA with Šidák multiple comparison test; C and D, two-tailed paired t test; F, unpaired t test; G and Q, repeated-measures two-way ANOVA with Tukey multiple comparison test; and I, Mann-Whitney U test. fF, femtofarad; M, male; pF, picofarad.
Figure 5
Figure 5
In vitro cisplatin exposure impairs mitochondrial function in mouse islets. Islets were isolated from male mice and exposed to 10 μmol/L cisplatin or vehicle for 48 h in vitro. A: Oxygen consumption rate was measured in mouse islets using a Seahorse XFe24 Analyzer. BH: Parameters of mitochondrial function including acute glucose response (B), basal respiration (C), maximal respiration (D), spare respiratory capacity (E), ATP production from mitochondrial respiration (F), proton leak (G), and nonmitochondrial respiration (H). Data are mean ± SEM. *P < 0.05 (n = 4 per treatment group). The following statistical tests were used: A, repeated-measures two-way mixed-effects ANOVA with Šidák multiple comparison test, and BH, two-tailed unpaired t test. M, male.
Figure 6
Figure 6
In vitro cisplatin exposure alters gene expression of key genes linked to β-cell health and function. Islets were isolated from male mice and exposed to 10 μmol/L cisplatin or vehicle in vitro. A subset of islets was collected after 6-, 24-, and 48-h incubation periods and used in qPCR analysis (see Fig. 3A for schematic summary). Relative mRNA expression of Bcl2 (A), Bcl2l1 (B), Bax (C), Cdkn1a (D), Ppargc1a (E), Nrf2 (F), Gpx1 (G), Hmox1 (H), Ins1 (I), Ins2 (J), Pcsk1 (K), and Pcsk2 (L) at three time points relative to 6-h vehicle control gene expression. Data are mean ± SEM (n = 5–7 per treatment group). *P < 0.05, **P < 0.01, ***P < 0.001. All graphs were analyzed using a repeated-measures two-way mixed-effects ANOVA with Tukey multiple comparison test. M, male.
Figure 7
Figure 7
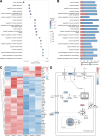
In vitro cisplatin exposure enriches pathways related to hormone secretion in male mouse islets. Islets isolated from male mice were exposed to vehicle or 10 μmol/L cisplatin for 48 h then used in TempO-Seq analysis (n = 3 per treatment group). A: Dot plot showing the 20 most significantly enriched pathways in cisplatin-exposed islets in the GO-BP database, identified through over-representation analysis of DEGs. Pathways are ranked based on adjusted P value. Colors indicate adjusted P value, and size indicates the total number of DEGs in the pathway. B: Graphical representation of upregulated and downregulated DEGs within the top 20 enriched pathways in cisplatin-exposed islets in the GO-BP database. C: Heat map showing fold changes of DEGs within the insulin secretion GO-BP pathway. The heat map was built with the pheatmap (version 1.0.12) R package using Euclidean clustering of differentially expressed probes and of samples, with expression levels scaled independently for each probe. D: Visual representation of the up- and downregulation of key DEGs within the insulin secretion pathway in the pancreatic β-cell. Adapted from annotated KEGG insulin secretion pathway built using the pathview (version 1.44.0) R package (refer to Supplementary Fig. 3).
Figure 8
Figure 8
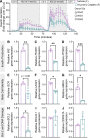
In vitro cisplatin exposure decreases GSIS and KCl-stimulated insulin secretion and downregulates key insulin secretion and β-cell identity genes in human donor islets. Female human donor islets (n = 3) were exposed to vehicle or 10 μmol/L cisplatin for 48 h prior to functional assessment. A: Insulin secretion was measured dynamically via perifusion in vehicle- and cisplatin-exposed human donor islets in response to LG (2.8 mmol/L), HG (16.7 mmol/L), and KCl (30 mmol/L) buffers. BJ: Relative mRNA expression of INS (B), PCSK1 (C), PCSK2 (D), GCK (E), UCN3 (F), MAFA (G), BCL2 (H), BCL2L1 (I), and CDKN1A (J) in vehicle- and cisplatin-exposed human donor islets. Data are mean ± SEM. *P < 0.05, **P < 0.01, ***P < 0.001. The following statistical tests were used: A, repeated measures two-way ANOVA with Tukey multiple comparison test, and BJ, two-tailed paired t test. F, female.

References

    1. Lega IC, Pole JD, Austin PC, Lau C, Nathan PC, Baxter NN.. Diabetes risk in childhood cancer survivors: a population-based study. Can J Diabetes 2018;42:533–539 - PubMed
    1. Hwangbo Y, Kang D, Kang M, et al. . Incidence of diabetes after cancer development: a Korean national cohort study. JAMA Oncol 2018;4:1099–1105 - PMC - PubMed
    1. Wang C-Y, Shih S-R, Huang K-C.. Increasing risk of diabetes mellitus in postmenopausal women with newly diagnosed primary breast cancer. J Diabetes Investig 2020;11:490–498 - PMC - PubMed
    1. Meacham LR, Sklar CA, Li S, et al. . Diabetes mellitus in long-term survivors of childhood cancer. Increased risk associated with radiation therapy: a report for the childhood cancer survivor study. Arch Intern Med 2009;169:1381–1388 - PMC - PubMed
    1. Singh S, Earle CC, Bae SJ, et al. . Incidence of diabetes in colorectal cancer survivors. J Natl Cancer Inst 2016;108:djv402. - PubMed

MeSH terms