. 2025 Jan 14;135(5):e183086.
doi: 10.1172/JCI183086.

An activin receptor-like kinase 1-governed monocytic lineage shapes an immunosuppressive landscape in breast cancer metastases

Affiliations

An activin receptor-like kinase 1-governed monocytic lineage shapes an immunosuppressive landscape in breast cancer metastases

Mehrnaz Safaee Talkhoncheh et al. J Clin Invest. .

Abstract

The biology centered around the TGF-β type I receptor activin receptor-like kinase (ALK) 1 (encoded by ACVRL1) has been almost exclusively based on its reported endothelial expression pattern since its first functional characterization more than 2 decades ago. Here, in efforts to better define the therapeutic context in which to use ALK1 inhibitors, we uncover a population of tumor-associated macrophages (TAMs) that, by virtue of their unanticipated Acvrl1 expression, are effector targets for adjuvant antiangiogenic immunotherapy in mouse models of metastatic breast cancer. The combinatorial benefit depended on ALK1-mediated modulation of the differentiation potential of bone marrow-derived granulocyte-macrophage progenitors, the release of CD14+ monocytes into circulation, and their eventual extravasation. Notably, ACVRL1+ TAMs coincided with an immunosuppressive phenotype and were overrepresented in human cancers progressing on therapy. Accordingly, breast cancer patients with a prominent ACVRL1hi TAM signature exhibited a significantly shorter survival. In conclusion, we shed light on an unexpected multimodal regulation of tumorigenic phenotypes by ALK1 and demonstrate its utility as a target for antiangiogenic immunotherapy.

Keywords: Breast cancer; Cancer immunotherapy; Endothelial cells; Immunology; Oncology.


Figures
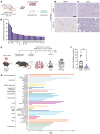
Figure 1
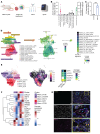
Figure 1. Inhibition of ALK1 alters the extent of immune infiltrate in experimental primary and metastatic breast cancer.
(A) Analysis of archival breast cancer tissue from the transgenic MMTV-PyMT mouse model treated with IgG2a or ALK1-Fc (13). (B and C) Representative fields of IHC for CD45 (B), and CD3 (C), ALK1-Fc versus IgG2a (n = 4 for IgG2a, n = 6 for ALK1-Fc). Scale bar: 100 μm. (D) Plot displaying the fold-change expression of target genes from the qRT-PCR, ALK1-Fc versus IgG2a. F.C., fold change. (E) Experimental design of the adjuvant trial based on the orthotopic transplantation of 5 × 10⁵ E0771 cells in syngeneic C57BL/6 hosts (n = 15 for IgG2a, n = 13 for ALK1-Fc). (F) Quantification of macrometastases at sacrifice, ALK1-Fc versus IgG2a. Data are represented as mean with SEM. **P < 0.01, Mann-Whitney U test. (G) Selection of significant gene ontology terms (adjusted P < 0.05) from the analysis performed on bulk RNA-Seq of E0771 lung metastases. Normalized enrichment score (NES) values, ALK1-Fc versus IgG2a. APC, antigen presenting cell.
Figure 2
Figure 2. Murine and human macrophages express Acvrl1/ACVRL1.
(A and B) Study design (A) for the quantification of Acvrl1 expression in FACS-sorted immune cell populations from the MMTV-PyMT model (3 pooled experiments) (B). Positive (CD31+ endothelial cells) and negative (EpCAM+ epithelial cells) controls highlighted in magenta and purple, respectively. Expression of ACVRL1 in freshly isolated human CD14+ monocytes from healthy donors (green). Data are represented as mean with SEM. (C) Expression of Id1 in unstimulated (control) versus BMP9-stimulated BM-derived macrophages (representative of 3 independent experiments). Data are represented as mean with SEM. ***P < 0.001, unpaired, 2-tailed Student’s t test. (D) Overlay of a TAM-specific ACVRL1 signature onto myeloid cells of a human breast cancer scRNA-Seq dataset (32). (E) Expression of ACVRL1 in TAMs from the scRNA-Seq atlas of immune phenotypes (29, 30). Density plot of the expression of ACVRL1 in TAMs. The average expression of the genes composing the TAM signature is presented in the heatmap for ACVRL1+ and ACVRL1 TAM populations. (F) Heatmap of the expression of ACVRL1, cluster markers, and prototypical TAM markers in the scRNA-Seq atlas of immune phenotypes (29). (G) Dual RNAscope ISH coupled with mIHC in human breast cancer. The protein markers CD31 (magenta) and CD45 (white) were used to describe the cellular distribution of the ACVRL1 probe (green). Scale bars: 20 μm; 10 μm (inlet). Two inlets were annotated to highlight endothelial (cyan inlet/arrows) or immune-restricted accumulation of ACVRL1 (yellow inlets/arrows).
Figure 3
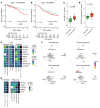
Figure 3. ACVRL1-expressing TAMs display an immunosuppressive phenotype associated with resistance to therapy and poor survival.
(A and B) Survival analysis in the TCGA BRCA (37) (A) and METABRIC (38) (B) datasets. Patients were stratified into 2 risk groups based on the median value of the mean expression of a TAM-specific ACVRL1 signature. The Kaplan-Meier curves show the DSS probabilities of the high (red) and low (green) signature expression groups in the 2 cohorts. P value: log-rank test. The tables summarize the relative Cox’s proportional hazard model analysis for each cohort. (C and D) Box plots depicting the expression of ACVRL1 (C) and the 5-gene signature of ACVRL1+ macrophages (D) in a bulk RNA-Seq dataset of 43 TNBC patients sequenced before treatment with anti–PD-1 (41). Pretreatment features were then correlated to response to therapy (responders, n = 16; nonresponders, n = 27). Statistical analysis was performed using Wilcoxon’s rank sum test, and the P values were corrected for multiple testing with the Benjamini-Hochberg method. (E and F) Expression of ACVRL1 in a CD45+-restricted scRNA-Seq compendium of 48 melanoma patients treated with immune checkpoint inhibitors (40). The average expression of the 5-gene signature, and the average scaled expression of the individual genes are presented in a heatmap (E) based on response, time point, and treatment arm. The average expression of ACVRL1 in the combined CTLA-4 and PD-1 inhibition group was imposed on the UMAP, and further split to create 4 different groups: preresponder, postresponder, prenonresponder, and postnonresponder (F). Contingent on the aggregated data points in F, the average scaled expression of the 5 genes comprised in the ACVRL1 signature is presented in a heatmap (G).
Figure 4
Figure 4. Inhibition of ALK1 potentiates IT.
(A and B) Experimental design of the adjuvant trial based on the orthotopic transplantation of 5 × 10⁴ 4T1 cells in syngeneic BALB/c hosts (n = 7 for IgG2a, n = 4 for ALK1-Fc, n = 6 each for IT and ALK1-Fc + IT) (A). IT consists of a dual inhibition of PD-1 and CTLA-4. MFP, mammary fat pad. Quantification of metastatic area in the lungs in the different treated cohorts (B). Data are represented as mean with SEM. *P < 0.05; **P < 0.01; ***P < 0.001, 1-way ANOVA with Bonferroni’s post hoc test for the comparisons between ALK1-Fc versus ALK1-Fc + IT and IT versus ALK1-Fc + IT. (C and D) H&E staining of whole lung sections from the different cohorts in the 4T1 adjuvant trial. Representative pictograms of complete lung metastatic infiltration (green; C) or partial metastatic outgrowth (magenta), quantified in D. Scale bar: 100 μm. P value: χ2 test. (E and F) IHC for CD3 in whole lung sections from the different cohorts (E), and quantification of the proportions of the CD3 distribution in the metastases (F). The staining pattern was arbitrarily categorized as low (cyan), medium (yellow), and high (magenta). Scale bar: 50 μm. P value: χ2 test.
Figure 5
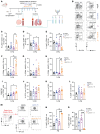
Figure 5. Antiangiogenic IT elicits tumor-specific and systemic effects on the immune cell composition.
(A) Experimental design of the 4T1-based adjuvant trial to study different population of myeloid and lymphoid cells via FACS. (B) Representative FACS plots for the myeloid compartment in the different cohorts (n = 5 each for IgG2a and ALK1-Fc, n = 6 each for IT and ALK1-Fc + IT). (C and D) From the CD11b+ gating, relative abundance of monocytes in lung tissue: Ly6ChiCD64 (C), and Ly6ChiCD64+ (D). Data are represented as mean with SEM. P value: unpaired, 2-tailed t test. (E) From the CD11b+ gating, relative abundance of Ly6C CD64+ macrophages in lung tissue. (FH) From the CD64 gating, relative frequency of dendritic cells in lung tissue: MHCIIhiCD11Chi (F), MHCIIhiCD11Clo (G), and MHCIIloCD11Chi (G). (IL) From the CD45+ population, relative frequency of NKP46+ NK cells (I), CD3+ T cells (J), CD4+ T helper cells (K), and CD8+ CTLs (L). (MO) From the CD45+CD11b+ cells, purity check of circulating monocytes in peripheral blood (M). Relative frequency of circulating monocytes: Ly6ChiCD64 (N) and Ly6ChiCD64+ (O). Data are represented as mean with SEM. *P < 0.05; **P < 0.01; ****P < 0.0001, 1-way ANOVA with Bonferroni’s post hoc test for the comparisons between ALK1-Fc versus ALK1-Fc + IT and IT versus ALK1-Fc + IT.
Figure 6
Figure 6. Vascular immune features reflect differential response to antiangiogenic IT.
(A) Customized multiplexed IHC (mIHC) staining of 4T1 metastases to the lungs. An antibody panel was developed to detect CD31+ endothelial cells (orange), EpCAM+ epithelial cells (both lung epithelium and breast cancer cells, cyan), TILs (CD4+ T helper, green; CD8a+ CTLs, red; B220+ B-cells, yellow), and TREM2+ recruited TAMs (magenta). Scale bars: 50 μm. (BD) A machine learning-based algorithm was trained to discriminate metastatic tissue (red) from lung and hollow space (green and blue, respectively; B), followed by cell segmentation (C). Phenotyping (D) is visualized as a dot with the same color coding as in B. Cells (based on DAPI detection) negative for any of the markers included in the antibody panel are displayed in blue. (EG) total cell counts per phenotype (E), and cell density per phenotype (cells/mm2; F) within the different tissue segments. The CD8+ T cells/TREM2+ TAMs ratio (G) was calculated from cell densities.
Figure 7
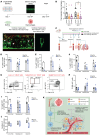
Figure 7. ALK1 affects the HPC niche in the BM.
(A) Experimental design based on the organ-on-a-chip assay with 3 channels. Representative images of a longitudinal and a cross section of the 3D tube are presented in the bottom panel. (B) Quantification of macrophage transendothelial migration at 24 and 48 hours with endothelial cells infected with lentiviral vectors expressing either scrambled or Acvrl1-targeting shRNA (n = 4 experiments). Data are represented as mean with SEM. *P < 0.05, unpaired, 2-tailed Student’s t test for the comparison between shCtrl and shA07 or shA09. (CE) Experimental design of the short-term trial based on the orthotopic transplantation of 5 × 10⁴ 4T1 cells in syngeneic BALB/c hosts (tumor-free: n = 5 each for IgG2a and ALK1-Fc; neoadjuvant: n = 4 each for IgG2a and ALK1-Fc; adjuvant: n = 4 for IgG2a, n = 5 for ALK1-Fc) (C). Frequency of circulating Ly6ChiCD64 (D) and CD64+ (E) monocytes in peripheral blood. Data are represented as mean with SEM. (F) Frequency of Ly6CCD64+ macrophages in lungs. Data are represented as mean with SEM. **P < 0.01, unpaired, 2-tailed Student’s t test. (GI) FACS plot and gating strategy of c-Kit+LinSca1 progenitor cells (47) extracted from the BM (G). Frequency of c-Kit+ (H) and GMP (I) cells from the BM extracts. Data are represented as mean with SEM. **P < 0.01, unpaired, 2-tailed Student’s t test. (J) Quantification of colony formation plating efficiency of c-Kit–enriched BM cells. Data are represented as mean with SEM. *P < 0.05, unpaired, 2-tailed Student’s t test. (K) Drawing summarizing the findings.

References

    1. Massagué J, Sheppard D. TGF-beta signaling in health and disease. Cell. 2023;186(19):4007–4037. doi: 10.1016/j.cell.2023.07.036. - DOI - PMC - PubMed
    1. Hanahan D, Weinberg RA. The hallmarks of cancer. Cell. 2000;100(1):57–70. doi: 10.1016/S0092-8674(00)81683-9. - DOI - PubMed
    1. Wei Y, et al. Fibroblast-specific inhibition of TGF-beta1 signaling attenuates lung and tumor fibrosis. J Clin Invest. 2017;127(10):3675–3688. doi: 10.1172/JCI94624. - DOI - PMC - PubMed
    1. Ghajar CM, et al. The perivascular niche regulates breast tumour dormancy. Nat Cell Biol. 2013;15(7):807–817. doi: 10.1038/ncb2767. - DOI - PMC - PubMed
    1. Bardeesy N, et al. Smad4 is dispensable for normal pancreas development yet critical in progression and tumor biology of pancreas cancer. Genes Dev. 2006;20(22):3130–3146. doi: 10.1101/gad.1478706. - DOI - PMC - PubMed

MeSH terms