. 2025 Jan 14;135(5):e171077.
doi: 10.1172/JCI171077.

PDGFRα inhibition reduces myofibroblast expansion in the fibrotic rim and enhances recovery after ischemic stroke

Affiliations

PDGFRα inhibition reduces myofibroblast expansion in the fibrotic rim and enhances recovery after ischemic stroke

Jil Protzmann et al. J Clin Invest. .

Abstract

Ischemic stroke is a major cause of disability in adults. Early treatment with thrombolytics and/or thrombectomy can significantly improve outcomes; however, following these acute interventions, treatment is limited to rehabilitation therapies. Thus, identification of therapeutic strategies that can help restore brain function in the post-acute phase remains a major challenge. Here we report that genetic or pharmacologic inhibition of the PDGF-CC/PDGFRα pathway, which has previously been implicated in stroke pathology, significantly reduced myofibroblast expansion in the border of the fibrotic scar and improved outcome in a sensory-motor integration test after experimental ischemic stroke. This was supported by gene expression analyses of cerebrovascular fragments showing upregulation of profibrotic/proinflammatory genes, including genes of the TGF pathway, after ischemic stroke or intracerebroventricular injection of active PDGF-CC. Further, longitudinal intravital 2-photon imaging revealed that inhibition of PDGFRα dampened the biphasic pattern of stroke-induced vascular leakage and enhanced vascular perfusion in the ischemic lesion. Importantly, we found PDGFRα inhibition to be effective in enhancing functional recovery when initiated 24 hours after ischemic stroke. Our data implicate the PDGF-CC/PDGFRα pathway as a crucial mediator modulating post-stroke pathology and suggest a post-acute treatment opportunity for patients with ischemic stroke targeting myofibroblast expansion to foster long-term CNS repair.

Keywords: Fibrosis; Growth factors; Neuroscience; Stroke; Vascular biology.


Conflict of interest statement

Conflict of interest: UE, DAL, EJS, and LF hold patents on modulating blood-neural barrier using PDGFRα antagonist (patents US8765671B2, PCT/SE2017/050183 and WO2017151043A1). UE is a shareholder in Paracrine Therapeutics AB (Bålsta, Sweden), which provided the m6B3 anti–PDGF-CC monoclonal antibody.

Figures

Figure 1
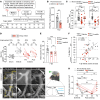
Figure 1. Imatinib attenuates MCAO-induced cerebrovascular breach and vasoconstriction.
(A) Two-photon images of FITC70 signal before ischemia (pre) and at different time points after ischemia. Asterisks: extraluminal FITC70 signal. (B) Quantification of 2-photon extraluminal FITC70 signal (n = 4). *P < 0.05, treatment effect; #P < 0.05 relative to control at that time point. Pre mean indicates mean value prior to ischemia. (C) Analysis and representative images of EB extravasation in the ipsilateral ischemic hemisphere in the acute phase after MCAO (n = 4–9). *P < 0.05, relative to sham; #P < 0.05, relative to vehicle controls. (D) Quantification of relative vessel diameter change 1–2 hpi compared with the diameter before onset. Recorded with longitudinal 2-photon microscopy in endothelial reporter mouse vessels (n = 399 untreated; 609 imatinib-treated) from 4 animals per treatment. (E and F) Ipsilateral overviews (E) and high-magnification images from the ischemic area (F) of immunofluorescence staining for PDGFRα and GFAP in brain sections collected at 3 hpi. Vessels were visualized with CD31. Arrows: perivascular expression of PDGFRα and GFAP; 2-headed arrows, scattered/lost perivascular expression of PDGFRα and GFAP; asterisk, non-perivascular GFAP signal. Ischemic area outlined with dashed lines. (G and H) Quantification of PDGFRα+ (G) and GFAP+ (H) vessels (n = 3). contra, contralateral; ipsi, ipsilateral. Representative images of maximum-intensity projections (A and F) and single-plane images (E) from vehicle- and imatinib-pretreated mice. Data points represent individual animals; bars, group mean ± SEM (C, G, and H); in B, data points represent group mean ± SEM. The dashed lines in B, D, G, and H show the pre-ischemia/contralateral group mean. Mixed-effects analysis with Tukey’s post-hoc test (B); 1-way ANOVA with Welch’s test (C); 2-tailed, unpaired t test with Welch’s correction (D, G, and H). *P < 0.05, #P < 0.05; **P < 0.01; ***P < 0.001; ##P < 0.01. Scale bars: 100 μm (A); 500 μm (E); 25 μm (F).
Figure 2
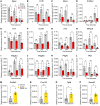
Figure 2. Imatinib dampens MCAO-induced expression, and PDGF-CC provokes expression, of profibrotic/proinflammatory genes in the cerebrovasculature.
Gene expression analysis on RNA isolated from cerebrovascular fragments collected from the ipsilateral hemisphere of vehicle- and imatinib-pretreated mice at different time points after MCAO (AL) or 4 hours after ICV injection with active PDGF-CC protein in naive mice (MP). (AL) qPCR analysis of differentially expressed genes in the ischemic cerebrovasculature of vehicle- and imatinib-pretreated mice (n = 3). (MP) qPCR analysis of expression of common fibrotic genes in cerebrovascular fragments isolated from WT mice 4 hours after ICV injection of either vehicle or active PDGF-CC protein (n = 6). Data points represent individual animals; dashed lines show the mean for the sham-operated group. Two-way ANOVA with uncorrected Fisher’s least significant difference test (AL); 2-tailed, unpaired t test with Welch’s correction (MP). ns, nonsignificant; *P < 0.05; **P < 0.01; ***P < 0.001.
Figure 3
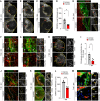
Figure 3. Imatinib attenuates the reactive gliosis response after MCAO.
(A and B) Ipsilateral overviews (A) and high-magnification images from the ischemic area (B) of staining for GFAP. Asterisk: nonperivascular GFAP signal; arrows: perivascular GFAP signal. (C) Quantification of GFAP expression based on antibody immunoreactivity intensity above a set threshold (n = 3–4). (D and E) Ipsilateral overviews (D) and high-magnification images from the ischemic border (E) of costaining for NG2 and PDGFRα. Double-positive cell bodies outlined in E. (F) Quantification of PDGFRα+NG2+-glia cell size in the peri-ischemic area (outlined in E) (n = 3–4). (G and H) Ipsilateral overviews (G) and high-magnification images from the ischemic border (H) of staining for CD11b. Vessels visualized with CD31. Arrows: condensed CD11b+ microglia/infiltrating macrophages. (I and J) Ipsilateral overviews (I) and high-magnification images from the ischemic border (J) of costaining for CD68 and TGF-β. (K) Quantification of TGF-β–expressing CD68+ microglia/infiltrating macrophages (arrows in J) in the ischemic area (n = 3–4). Representative images of immunofluorescence staining and quantification in brain sections from vehicle- and imatinib-pretreated mice collected at 3 hpi (AH) or 3 dpi (IK). Stitched epifluorescence images (A), single-plane confocal images (B, G, and I), and maximum-intensity projections of confocal Z-stacks (D, E, H, and J). Ischemic area outlined with dashed lines. Data points represent individual animals; bars, group mean ± SEM; and dashed line, contralateral group mean. Two-tailed, unpaired t test with Welch’s correction (C, F, and K). *P < 0.05; **P < 0.01. Scale bars: 500 μm (A, D, G, and I); 50 μm (B, H, and J); 25 μm (E).
Figure 4
Figure 4. Imatinib specifically targets expansion of a PDGFRα+ myofibroblast scar in the fibrotic rim after MCAO.
Representative images of immunofluorescence staining and quantification in brain sections from vehicle- and imatinib-pretreated mice collected at 7 dpi. (AC) Ipsilateral overviews from staining for GFAP (A), NG2 (B), and PDGFRα (C). Arrows in C: PDGFRα+ scar not targeted by imatinib. (D) Quantification of PDGFRα+ scar thickness in the fibrotic rim (demarcated in C) (n = 5–6). (E) High-magnification images from the fibrotic rim from costaining for PDGFRα and GFAP. Arrows: PDGFRα+GFAP+ cells. (F and G) Costaining for PDGFRα and NG2 acquired within the NG2+ glial scar. Arrows: PDGFRα+NG2+ cells; 2-headed arrows: non-perivascular PDGFRα+NG2 cells. (H) Ipsilateral overview and magnifications of the fibrotic rim and core from staining for fibronectin (FN). (I) Quantification of FN expression in the fibrotic rim (demarcated in H) (n = 5). (J) High-magnification images from the fibrotic rim of costaining for PDGFRα and fibronectin. (K) Ipsilateral overviews from staining for ASMA and PDGFRα. (L) Quantification of ASMA+ scar thickness in the fibrotic rim (demarcated in K) (n = 5–6). (M) High-magnification images from the fibrotic rim of costaining for ASMA and PDGFRα. Two-headed arrows: PDGFRα+ASMA+ nonvascular cells; arrows: ASMA+ vSMCs. Stitched epifluorescence images (AC and K), single-plane confocal images (E and H), and maximum-intensity projections of confocal Z-stacks (F, G, J, and M). Dashed lines demarcate glial scar (A and B) and myofibroblast scar (CK). Data points represent individual animals; bars, group mean ± SEM. Two-tailed, unpaired t test with Welch’s correction (D, I, and L). *P < 0.05; ***P < 0.001. Scale bars: 500 μm (AC, H, and K); 50 μm (E and F, core/rim in H); 25 μm (G and J); 10 μm (M).
Figure 5
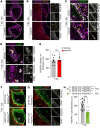
Figure 5. PDGFRα signaling drives expansion of the myofibroblast scar after MCAO.
Representative images of immunofluorescent stainings and quantifications in brain sections from vehicle and imatinib pretreated mice (AE) and GFAP-Cre;PDGFRα floxed mice (FH) collected at 7 dpi. (A) Ipsilateral overview from staining for PDGFRβ. (B) High-magnification images from the fibrotic rim of costaining for PDGFRβ and GFAP. Asterisks: PDGFRβ expression within the astroglial scar. (C) High-magnification images from the fibrotic rim of PDGFRα and PDGFRβ costaining. Two-headed arrows: PDGFRαhiPDGFRβhi cells; arrowheads; PDGFRαloPDGFRβhi cells. (D) High-magnification images from the fibrotic rim of costaining for PDGFRβ and ASMA. Arrows: ASMA+PDGFRβ+ vSMCs. (E) Quantification of PDGFRβ+ scar thickness in the fibrotic rim (demarcated in A) (n = 7–9). Ipsilateral overviews (F) and high-magnification images from the fibrotic rim (G) of staining for PDGFRα and GFAP in GFAP-Cre;PDGFRα floxed mice. (H) Quantification of PDGFRα+ scar thickness in the fibrotic rim (demarcated in F). n = 17 controls (ctrl), n = 8 PDGFRα knockouts (KO). Single-plane (A) and maximum-intensity projections (BD and G) of confocal images, and stitched epifluorescent tiles (F). Dashed lines demarcate the PDGFRβ+ dense scar (AD) and the myofibroblast scar (F and G) in the fibrotic rim. Data points represent individual animals and bars the group mean ± SEM. Two-tailed, unpaired t test with Welch’s correction (E and H). ***P < 0.001. Scale bars: 500 μm (A and F); 100 μm (B and D); 50 μm (C and G).
Figure 6
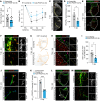
Figure 6. Anti–PDGF-CC antibody treatment reduces infarct volume and myofibroblast expansion in the fibrotic rim after MCAO.
(A) Infarct volume 3 dpi (n = 12). (B) Weight during the first 3 dpi (n = 12). (CM) Representative images of immunofluorescence staining and quantification in brain sections from control and anti–PDGF-CC antibody–pretreated mice collected at 6 hpi to 7 dpi. (C) Ipsilateral overviews of PDGFRα staining at 7dpi. (D) Quantification of PDGFRα+ scar thickness in the fibrotic rim (demarcated in C) (n = 5). (EH) Costaining of PDGFRα and ASMA (E and F) and PDGFRα, GFAP, and Ki-67 (G and H) at 7 dpi. Arrowheads: proliferating PDGFRα˗ cells. (I) Quantification of Ki-67+ nuclei in the fibrotic rim (n = 4–5). FOV, field of view. (J) High-magnification images from the ischemic area at 6 hpi of staining for phospho-PDGFRα (pY1018) and CD31. Arrows: phosphorylation of perivascular PDGFRα. (K) Quantification of perivascular phospho-PDGFRα expression in the ischemic area at 6 hpi (n = 4). (L and M) Costaining for phospho-PDGFRα (pY1018) and total PDGFRα at 7dpi. Stitched epifluorescent tiles (C) and single-plane (E, G, and L)/maximum-intensity projections (F, H, J, and M) of confocal images. Dashed lines demarcate the myofibroblast scar (C, E, G, and L) and the glial border (H). Data points represent individual animals; bars, group mean ± SEM (A, D, I, and K); in B data points represent group mean ± SEM. Dashed line in K shows contralateral group mean. Two-tailed, unpaired t test with Welch’s correction (A, D, I, and K); 2-way repeated-measures ANOVA with Tukey’s post-hoc test (B). *P < 0.05; ***P < 0.001. Scale bars: 500 μm (C, E, G, and L); 50 μm (F, H, and M); 20 μm (J).
Figure 7
Figure 7. Imatinib progressively improves functional recovery after MCAO.
(A) Schematic illustration of experimental design and the corridor task. The pellet explorations made from the left (ipsilateral to the lesion) or right (contralateral) side were counted. (B) Quantification of PDGFRα+ scar thickness in the fibrotic rim in imatinib-posttreated mice at 7 dpi (n = 5–6). (C) Exploration bias in mice pre- and posttreated with vehicle or imatinib, as well as in sham-operated mice (n = 10–19). (D) Change in exploration bias between 3 and 7 dpi. Arrows: individual mice (n =10–19). (E) Infarct volume at 7 dpi of vehicle-treated and imatinib-pretreated or posttreated mice (n = 10–19). (F) Correlation of infarct volume with exploration bias at 7 dpi (n = 9–10). (G) Representative maximum-intensity 2-photon images of FITC70 signal before (pre) and at different time points after (post) ischemia. (H) Quantification of vascular perfusion as assessed by intraluminal FITC70 signal using longitudinal 2-photon microscopy (n = 4). Data points represent individual animals; bars, group mean ± SEM (B, C, E, F, and H); in D arrows represent individual animals, and data points represent group mean ± SEM. Two-tailed, unpaired t test with Welch’s correction (B); 2-way repeated-measures ANOVA with Tukey’s post-hoc test (C, D, and H); 1-way ANOVA with Welch’s test (E); linear regression (F). *P < 0.05; **P < 0.01; ***P < 0.001. Scale bar: 100 μm (G).

Comment in

  • Imatinib on target in stroke recovery

References

    1. Saini V, et al. Global epidemiology of stroke and access to acute ischemic stroke interventions. Neurology. 2021;97(20 suppl 2):S6–S16. - PubMed
    1. Prabhakaran S, et al. Acute stroke intervention: a systematic review. JAMA. 2015;313(14):1451–1462. doi: 10.1001/jama.2015.3058. - DOI - PubMed
    1. Abdullahi W, et al. Blood-brain barrier dysfunction in ischemic stroke: targeting tight junctions and transporters for vascular protection. Am J Physiol Cell Physiol. 2018;315(3):C343–C356. doi: 10.1152/ajpcell.00095.2018. - DOI - PMC - PubMed
    1. Stanimirovic DB, Friedman A. Pathophysiology of the neurovascular unit: disease cause or consequence? J Cereb Blood Flow Metab. 2012;32(7):1207–1221. doi: 10.1038/jcbfm.2012.25. - DOI - PMC - PubMed
    1. Abrams MB, et al. Imatinib enhances functional outcome after spinal cord injury. PLoS One. 2012;7(6):e38760. doi: 10.1371/journal.pone.0038760. - DOI - PMC - PubMed

MeSH terms

Substances