. 2025 Jan 14;10(3):e176749.
doi: 10.1172/jci.insight.176749.

Highly multiplexed imaging reveals prognostic immune and stromal spatial biomarkers in breast cancer

Affiliations

Highly multiplexed imaging reveals prognostic immune and stromal spatial biomarkers in breast cancer

Jennifer R Eng et al. JCI Insight. .

Abstract

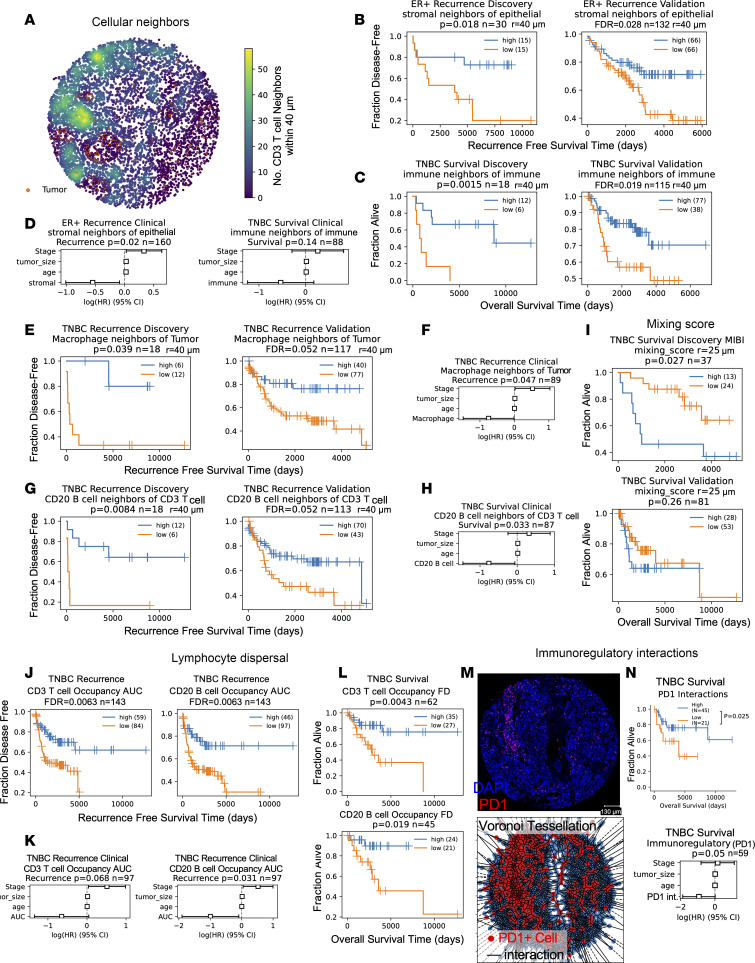
Spatial profiling of tissues promises to elucidate tumor-microenvironment interactions and generate prognostic and predictive biomarkers. We analyzed single-cell spatial data from 3 multiplex imaging technologies: cyclic immunofluorescence (CycIF) data we generated from 102 patients with breast cancer with clinical follow-up as well as publicly available mass cytometry and multiplex ion-beam imaging datasets. Similar single-cell phenotyping results across imaging platforms enabled combined analysis of epithelial phenotypes to delineate prognostic subtypes among patients who are estrogen-receptor+ (ER+). We utilized discovery and validation cohorts to identify biomarkers with prognostic value. Increased lymphocyte infiltration was independently associated with longer survival in triple-negative (TN) and high-proliferation ER+ breast tumors. An assessment of 10 spatial analysis methods revealed robust spatial biomarkers. In ER+ disease, quiescent stromal cells close to tumor were abundant in tumors with good prognoses, while tumor cell neighborhoods containing mixed fibroblast phenotypes were enriched in poor-prognosis tumors. In TN disease, macrophage/tumor and B/T lymphocyte neighbors were enriched, and lymphocytes were dispersed in good-prognosis tumors, while tumor cell neighborhoods containing vimentin+ fibroblasts were enriched in poor-prognosis tumors. In conclusion, we generated comparable single-cell spatial proteomic data from several clinical cohorts to enable prognostic spatial biomarker identification and validation.

Keywords: Breast cancer; Immunology; Macrophages; Oncology; T cells.


Conflict of interest statement

Conflict of interest: The authors have declared that no conflict of interest exists.

Figures

Figure 1
Figure 1. Concordant cell phenotypes in multiplex imaging data from different platforms.
(A) Three multiplex imaging datasets from breast cancer tissue microarrays were processed through single-cell segmentation and feature extraction using the mplexable pipeline. The single-cell datasets were separately clustered using the unsupervised Leiden algorithm resulting in cell types that were annotated with similar names across platforms. We generated a suite of spatial statistics for each tissue, and the resulting cellular and spatial features were used for discovery and validation of prognostic cell abundance and spatial biomarkers across datasets. CycIF, cyclic immunofluorescence; IMC, imaging mass cytometry; MIBI, multiplex ion beam imaging. Asterisk indicates a new dataset, and cross indicates public data. (B) Overlap of markers (left) and annotated cell types (right) in each multiplex imaging dataset. (C) Representative images from the 3 multiplex imaging platforms showing epithelial (orange), immune (red), and fibroblast (green) markers. Scale bar: 100 μm. Total of 413 patient tissues imaged. (D) Cell lineage types showing cell location and lineages: epithelial (orange), immune (red), fibroblast (green), endothelial (blue), and other stromal (purple). CycIF, top; IMC, middle; MIBI, bottom. (E) The correlation between platforms of the fraction of each cell lineage per total cells per subtype, per platform, using unsupervised clustering and annotation to determine lineage. No. Pts., number of patients. (F) Correlation between cell types on adjacent sections of a TMA stained with MIBI and CycIF. n = 9 tissues. (E and F) Pearson’s correlation r (2-sided) between platforms and P value shown in panel title.
Figure 2
Figure 2. Prognostic ER+ breast cancer subtypes in multiplatform multiplex imaging data.
(A) Hierarchical clustering of all ER+ and patients with TNBC (n = 350) based on the Z-scored fraction in each patient’s tissue of the 6 most common epithelial cell types. Heatmap annotation row colors show the Leiden clustering resulting in 7 epithelial (Epithel.) subtype clusters (left), clinical subtype (center), and platform (right). (B) Mean cell frequency of epithelial cell types per subtype cluster. (C) UMAP embedding of patients by fraction of epithelial cell types in all tumor cells, colored by Leiden epithelial subtype cluster (top) and platform (bottom). n = 350 patients. (D) Two-sided χ2 analysis of epithelial subtypes versus platform; P values are shown in panel title. (E) Kaplan-Meier curves (P value from log-rank test) comparing overall survival (OS) in the 7 epithelial subtypes present in ER+ tumors. (F) Cox proportional hazard (CPH) model estimating HRs for epithelial subtypes of ER+ tumors. The HR estimates marked by boxes and data are shown with 95% CI. (G) CD44 intensity in epithelial cells from poor prognosis epithelial subtype 6 compared with other patients who are ER+. FDR corrected for multiple cell markers given in panel title; P values were calculated from Mann-Whitney U test. (H) Fraction of endothelial cells in tissue stromal cells of patient tissues from each epithelial subtype cluster. Kruskal-Wallis P value is given in panel title. Post hoc Tukey’s HSD P values for pairwise comparisons were used between groups. (G and H) Box plots show the median and interquartile range (IQR), and whiskers show 1.5× the IQR.
Figure 3
Figure 3. T cell infiltrate has prognostic value and distinct states in TN and high-proliferation ER+ breast cancer.
(A) Kaplan-Meier analysis of abundance of CD3 T cells versus overall survival (OS) in TNBC discovery (left) and validation cohort (right). (B) Kaplan-Meier analysis of abundance of CD20 B cells versus OS in TNBC discovery (left) and validation cohort (right). (C) Multivariable CPH modeling adding patient age, tumor size, and stage to CD3 T cell high variable defined in A. (D) Multivariable CPH modeling adding patient age, tumor size and stage to CD20 B cell high variable defined in B. (E) Kaplan-Meier analysis of abundance of CD3 T cell versus OS in all patients who are ER+ (left) and patients who are ER+ with high (above the median) tumor proliferation (right). (F) CPH modeling of CD3 T cell abundance plus clinical variables in high- and low-proliferation ER+ tumors. (G) Kaplan-Meier analysis of all patients who are ER+ and patients with TNBC stratified into 4 groups by median tumor proliferation and median T cell abundance. (H) CPH modeling of CD3 T cell abundance plus clinical variables in high- and low-proliferation TNBC tumors. (I) Mean number of T cell neighbors (within 25 μm) of T cells in tissues from high- and low-proliferation ER+ or TNBC tumors in IMC cohort. (J) Ki67 intensity indicating proliferation levels of T cells in tissues from high- and low-proliferation ER+ or TNBC tumors in IMC cohort. (K) CD44 intensity in T cells, indicating memory/effector phenotypes in IMC tissues. (AH) All Kaplan-Meier P values obtained from the log-rank test, validation cohort corrected for testing multiple cell types with Benjamini-Hochberg method. CPH modeling P values for cell type variable given in panel titles; the HR estimates are marked by boxes, and data are shown as 95% CI. (IK) Significance was found with the Kruskal-Wallis test. Post hoc Tukey’s HSD was used for pairwise comparisons between groups. Box plots show the median and interquartile range (IQR), and whiskers indicate 1.5× the IQR.
Figure 4
Figure 4. Reproducible prognostic spatial metrics in breast cancer cohorts.
(A) Example tissue colored by number of CD3 T cell neighbors of each cell. Tumor in orange. (B and C) Recurrence-free survival (RFS) of patients who are ER+ stratified by stromal neighbors of epithelial (B) or overall survival (OS) of patients with TNBC stratified by immune neighbors of immune (C) in the discovery (left) and validation (right) cohorts. (D) Multivariable CPH modeling of (left) RFS of patients who are ER+ for stromal neighbors of epithelial or (right) OS of patients TNBC for immune neighbors of immune. (E and G) RFS of patients with TNBC stratified by macrophage neighbors of tumor (E) or B cell neighbors of T cells (G) in the discovery (left) and validation (right) cohorts. (F and H) Multivariable CPH modeling of RFS of patients with TNBC for macrophage neighbors of tumor (F) or CD20 B cell neighbors of CD3 T cells (H). (I) TNBC OS stratified by tumor-immune mixing score in MIBI (top) and validation cohorts (i.e., CycIF and IMC; bottom). (I) TNBC OS stratified by occupancy AUC of T (left) or B lymphocytes (right). (K) Multivariable CPH modeling of T (left) and B lymphocyte (right) occupancy AUC. (L) TNBC OS stratified by fractal dimension slope difference for T (top) or B lymphocytes (bottom). (M) Top: Representative tissue showing nuclei (blue) and PD-1 (red). Scale bar: 130 μm. Bottom: Voronoi tessellation of tissue; all cells (blue), PD-1+ cells (red), and interactions (black line). (N) OS of CycIF TNBC patients stratified by PD-1 interactions. Bottom: CPH modeling of PD-1 interaction metric. (AN) Kaplan-Meier P values from log-rank test; validation cohort FDR corrected with the Benjamini-Hochberg method. CPH modeling P values for spatial variable given in panel titles; HR estimates are marked by boxes, and data are shown as 95% CI. (AH) Neighbors are within a 40 μm radius. (JL) Includes lymphocytes within 20 μm of tumor.
Figure 5
Figure 5. Prognostic multicellular neighborhoods surrounding tumor cells modeled with spatial latent Dirichlet allocation.
(A) Top: CycIF staining of TNBC tissue showing tumor (panCK), T cell (CD4 and CD8), macrophage (CD68), fibroblast (vimentin), and endothelial (CD31) markers. Middle: Tumor cells colored by topic weights of select topics. Bottom: Tumor cells colored by their spatial latent Dirichlet allocation (LDA) neighborhood cluster. Tumor cells colored by the following neighborhoods: T cell (blue), macrophage (purple), mixed fibroblast (brown) and vimentin+ fibroblast (green). n = 308 patients analyzed with spatial LDA. (B and D) Heatmap of stromal cell enrichment in spatial LDA topics in a 100 μm radius of tumor cells in CycIF TNBC tissues (B) (n = 59) and ER+ tissues (D) (n = 30). Cyan arrowhead indicates cell type enrichment in topic-0 in TNBC tissues; magenta arrowhead indicates CD4 T cell enrichment in TNBC spatial LDA topics. (C and E) Heatmap of fraction of each topic in each neighborhood cluster resulting from K-means clustering (k =8) of spatial LDA topics from TNBC (C) and ER+ tissues (E). (F) Kaplan-Meier (K-M) estimate of overall survival (OS) for high and low vimentin+ fibroblast tumor neighborhoods in TNBC tissues in discovery (left) and validation cohorts (right). (G) CPH modeling of OS and recurrence-free survival (RFS) with clinical variables plus spatial LDA neighborhood from F. (H) K-M analysis of OS for high and low mixed fibroblast tumor neighborhoods in ER+ tissues in the discovery (left) and validation cohorts (right). (I) CPH modeling of OS and RFS for mixed fibroblast neighborhoods in ER+ tumors. (J and K) Pearson correlation of cell types within ER+ (J) and TNBC tissues (K) from all cohorts, colored by cohort (legend in L). Pearson correlation of neighborhood/cell type abundances, subtype in panel title, colored by cohort. (F and H) P values were calculated from the log-rank test. (G and I) CPH modeling P values for spatial variable are shown in panel titles; the HR estimates are marked by boxes, and data are shown as 95% CI. (JL) Cell types, cohort, 2-sided Pearson correlation (r), and P values given in panel titles.

References

    1. Rizzo A, Ricci AD. Biomarkers for breast cancer immunotherapy: PD-L1, TILs, and beyond. Expert Opin Investig Drugs. 2022;31(6):549–555. doi: 10.1080/13543784.2022.2008354. - DOI - PubMed
    1. Schmid P, et al. Pembrolizumab for early triple-negative breast cancer. N Engl J Med. 2020;382(9):810–821. doi: 10.1056/NEJMoa1910549. - DOI - PubMed
    1. Tsujikawa T, et al. Quantitative multiplex immunohistochemistry reveals myeloid-inflamed tumor-immune complexity associated with poor prognosis. Cell Rep. 2017;19(1):203–217. doi: 10.1016/j.celrep.2017.03.037. - DOI - PMC - PubMed
    1. Gut G, et al. Multiplexed protein maps link subcellular organization to cellular states. Science. 2018;361(6401):eaar7042. doi: 10.1126/science.aar7042. - DOI - PubMed
    1. Lin JR, et al. Highly multiplexed imaging of single cells using a high-throughput cyclic immunofluorescence method. Nat Commun. 2015;6:8390. doi: 10.1038/ncomms9390. - DOI - PMC - PubMed