. 2025 Jan 28;44(1):115179.
doi: 10.1016/j.celrep.2024.115179. Epub 2025 Jan 13.

mTORC1 regulates the pyrimidine salvage pathway by controlling UCK2 turnover via the CTLH-WDR26 E3 ligase

Affiliations

mTORC1 regulates the pyrimidine salvage pathway by controlling UCK2 turnover via the CTLH-WDR26 E3 ligase

Brittany Q Pham et al. Cell Rep. .

Abstract

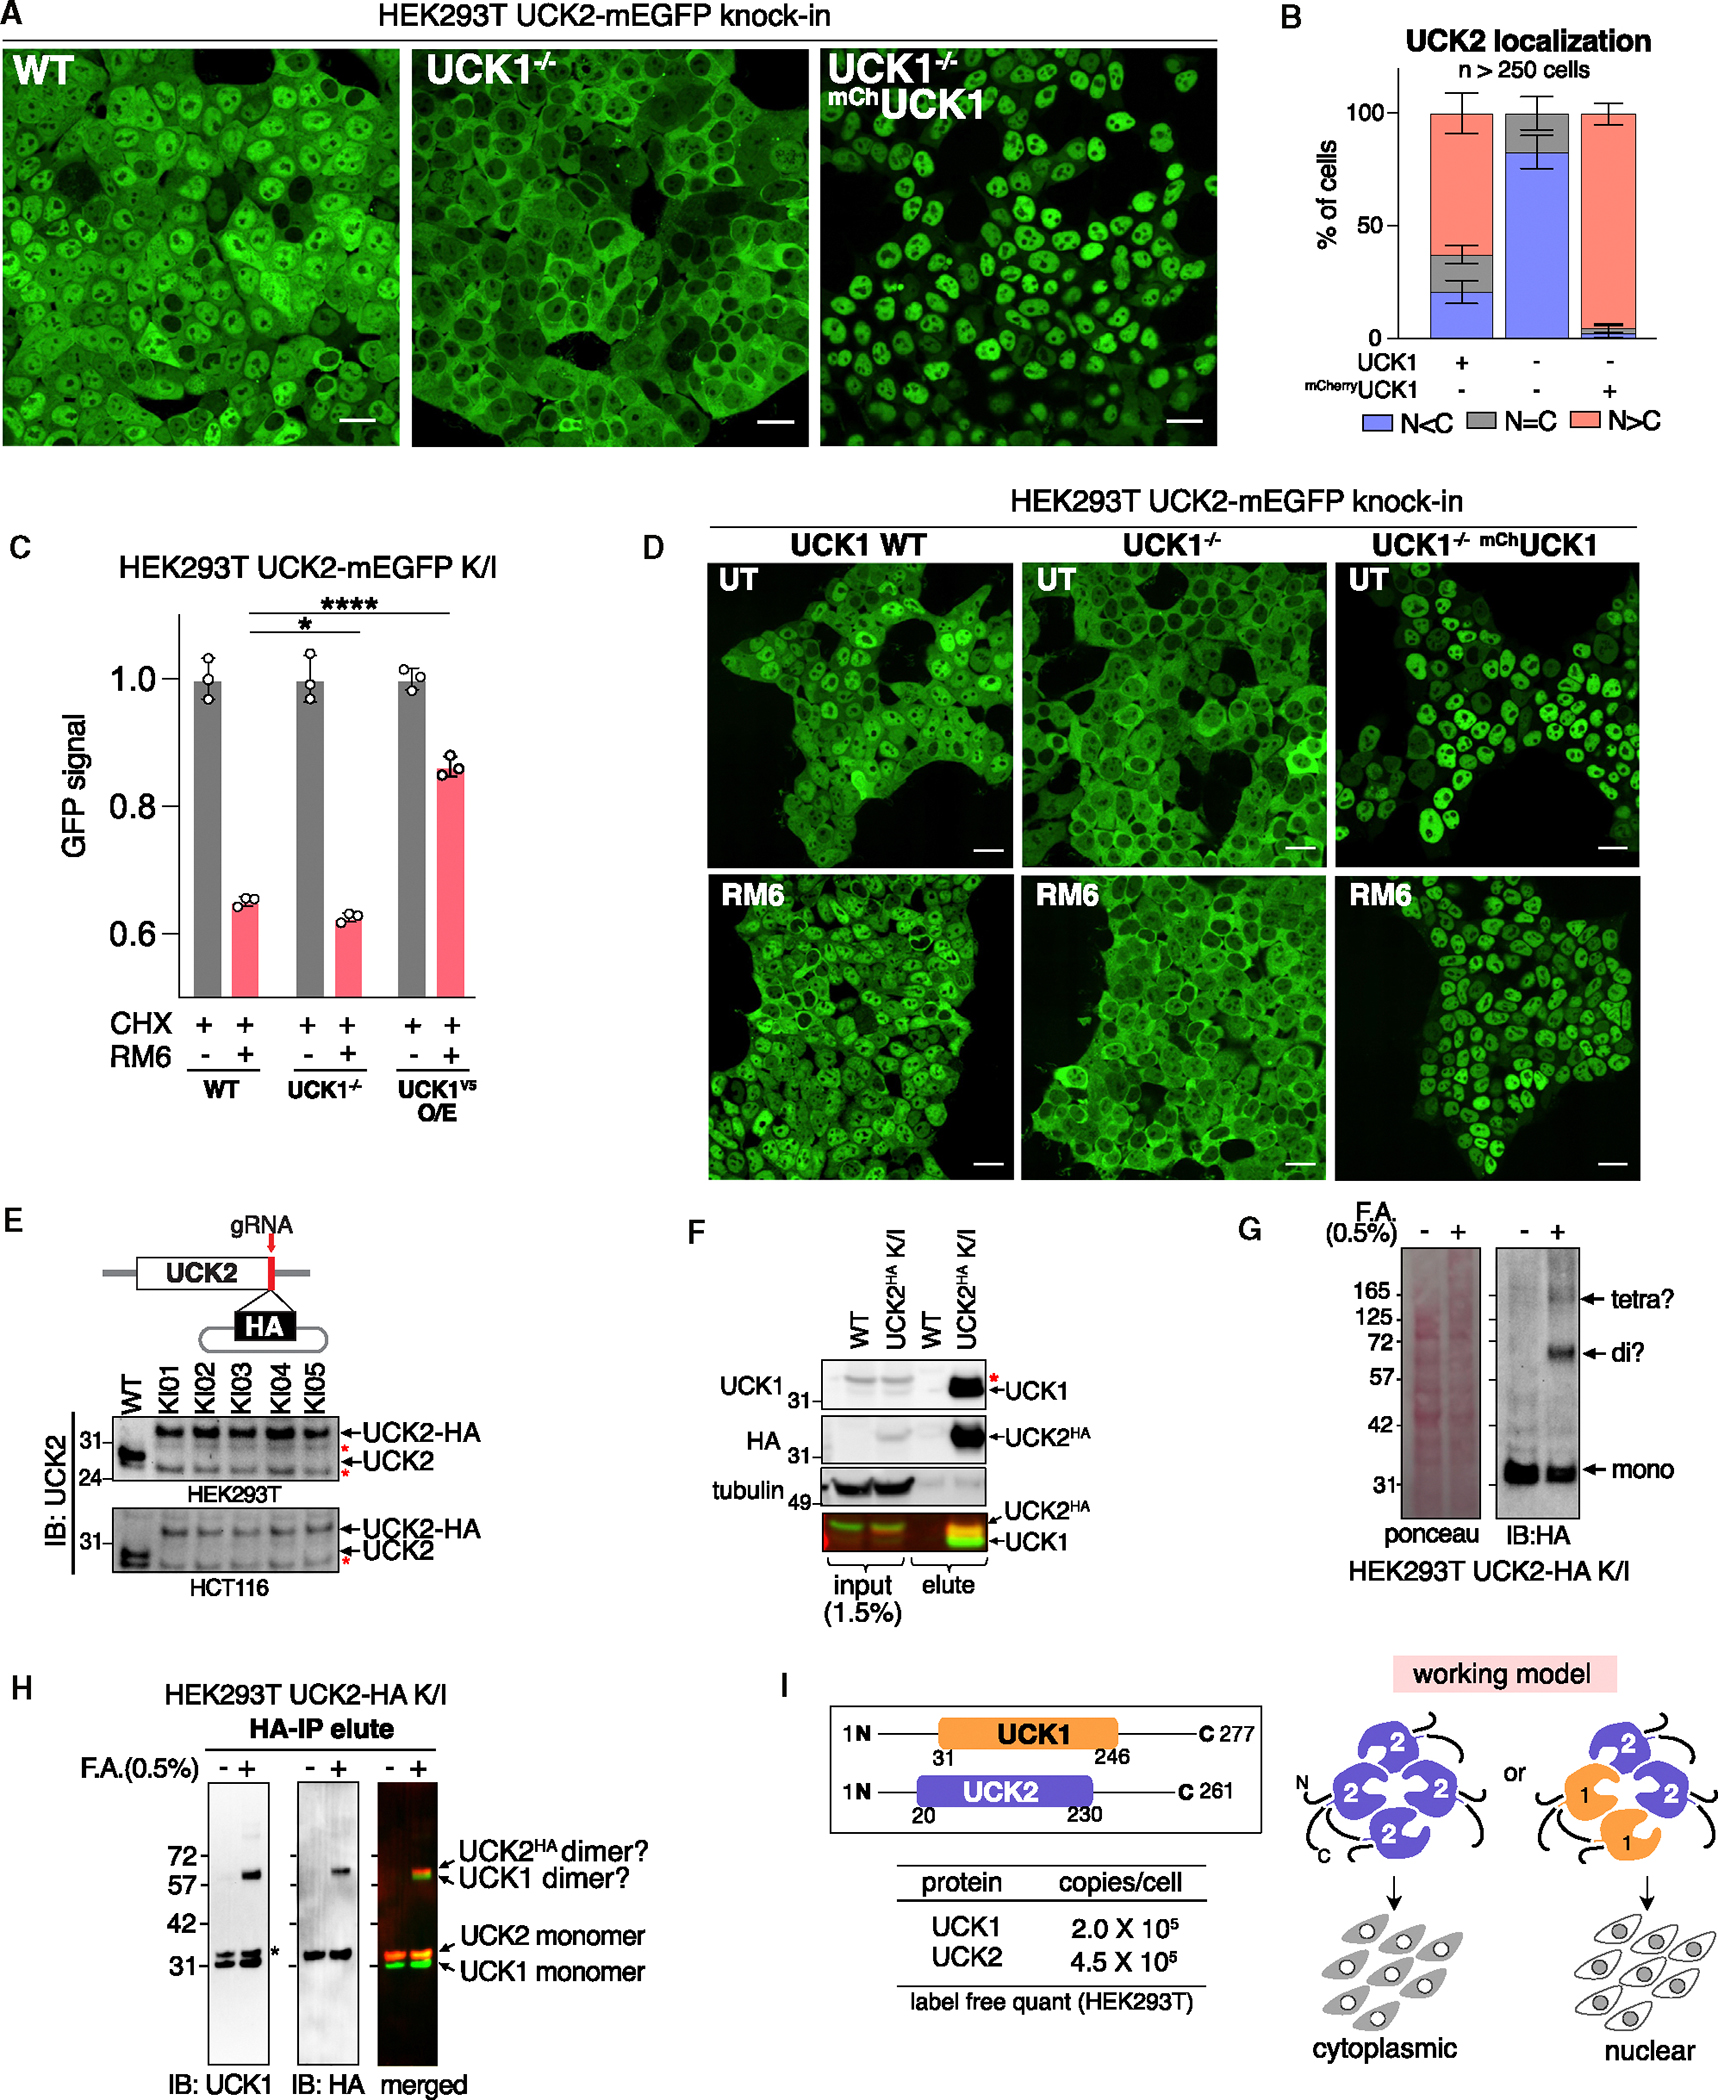
One critical aspect of cell proliferation is increased nucleotide synthesis, including pyrimidines. Pyrimidines are synthesized through de novo and salvage pathways. Prior studies established that the mammalian target of rapamycin complex 1 (mTORC1) promotes pyrimidine synthesis by activating the de novo pathway for cell proliferation. However, the involvement of mTORC1 in regulating the salvage pathway remains unclear. Here, we report that mTORC1 controls the half-life of uridine cytidine kinase 2 (UCK2), the rate-limiting enzyme in the salvage pathway. Specifically, UCK2 is degraded via the CTLH-WDR26 E3 complex during mTORC1 inhibition, which is prevented when mTORC1 is active. We also find that UCK1, an isoform of UCK2, affects the turnover of UCK2 by influencing its cellular localization. Importantly, altered UCK2 levels through the mTORC1-CTLH E3 pathway affect pyrimidine salvage and the efficacy of pyrimidine analog prodrugs. Therefore, mTORC1-CTLH E3-mediated degradation of UCK2 adds another layer of complexity to mTORC1's role in regulating pyrimidine metabolism.

Keywords: CP: Metabolism; CP: Molecular biology; CTLH; UCK2; WDR26; YPEL5; degradomics; mTOR; mTORC1; pyrimidine; pyrimidine salvage; ubiquitin.


Conflict of interest statement

Declaration of interests The authors declare no competing interests.

Figures

Figure 1.
Figure 1.. UCK2 degradation is regulated by the mTORC1-UPS axis
(A) Analysis of the previously reported AHA degradomics data is presented as a volcano plot of the log10-transformed p value versus the log2-transformed ratio of Torin1 treated/untreated (UT) conditions for WT HEK293T cells. UCK2 degradation is accelerated after mTORC1 inhibition for 12 h using Torin1 (250 nM). p values were calculated by two-sided Welch’s t test (adjusted to 1% false discovery rate for multiple comparisons). A total of 8,644 proteins were quantified. n =3 biological replicates. (B) Line histograms of UCK2 and UCK1 decay (data from WT, ATG7−/−, and FIP200−/− HEK293T cells all combined) with or without Torin1 treatment were extracted from the previously reported dataset. n = 6 for each data point, mean ± SD. (C) Immunoblot of HEK293T extracts treated with the indicated inhibitors: Torin1 (250 nM), MLN7243 (100 nM), and BTZ (500 nM). (D) HEK293T cell lysates treated with Torin1 or RM6 for the indicated time were subjected to immunoblot analysis using the specified antibodies. Torin1 (250 nM) inhibits both mTORC1 and mTORC2, whereas RM6 (3 nM) selectively inhibits mTORC1. (E) Amino acid (AA) deprivation leads to reduced UCK2 levels. (F) Quantification for (D) and (E). n ≥ 4 biological replicates. Data are represented by mean ± SD. ****p< 0.0001. (G) MFE296 and Jurkat cells show a similar reduction in UCK2 upon mTORC1 inhibition by RM6 (3 nM). (H) The decrease of UCK2 during mTORC1 inhibition is post-translationally regulated, as indicated by the AHA degradomics. Cells were treated with 1-μM CHX and 3-nM RM6 for 16 h. CHX: 1 μM, RM6: 3 nM. (I) Torin1 treatment (200 nM) does not affect relative UCK2 mRNA levels. (J) UCK2-mEGFP knockin cell line generation using CRISPR-Cas9. Genotyping data is shown for K/I validation. (K) Histogram of GFP intensity when UCK2-mEGFP knockin cells were treated with RM6 (1 nM) in the presence or absence of MLN7243 (100 nM) for 16 h before flow cytometry analysis. n = 2,347 cells. (L) Bar graph representing mean ± SD of the biological triplicate experiments performed as in (K) using HEK293T and HCT116 cells. ***p < 0.001. (M) Flow cytometry analysis of UCK2-mEGFP cells shows that 1-μM CHX and joint 1-μM CHX/3-nM RM6 treatment reduce UCK2 levels by 25% and 50%, relative to the untreated control. Mean ± SD from n = 3 biological replicates. **p < 0.01. (N) Proposed model of UCK2 degradation under mTOR on and off conditions.
Figure 2.
Figure 2.. CTLH E3 complex mediates UCK2 degradation during mTORC1 inhibition
(A) Bioplex v3.0 interactome map of UCK2 in HEK293T cells. (B) Components of the CTLH E3 complex (left) and a simplified schematic of the supramolecular CTLH/WDR26 complex (right) are shown. (C) Immunoprecipitation of UCK2-EGFP indicates constitutive interactions between UCK2 and components of the CTLH complex, such as MAEA and ARMC8, in the presence or absence of Torin (250 nM) and BTZ (500 nM). (D) Histogram of GFP intensity comparing WT and MAEA−/− cells endogenously expressing UCK2-mEGFP treated with CHX (1 μM) alone or with RM6 (3 nM) for 16 h. Mean ± SD, n = 3 biological replicates. *p < 0.05, ***p < 0.001. (E) A representative line histogram of UCK2-mEGFP cells analyzed as in (D). UCK2 is stabilized in MAEA−/− cells when treated with CHX and RM6. n > 7,500 cells. (F) Introducing WT MAEA into the MAEA−/− cells restores the UCK2 degradation, whereas introducing a non-ring prime mutant MAEAY394A does not rescue the degradation phenotype. Mean ± SD, n = 3 biological replicates. **p < 0.01. (G) Representation of (F) as histograms. (H) Immunoblot analysis of HEK293T lysates shows that 16-h RM6 (3 nM) treatment results in a reduction of UCK2 levels in WT cells, and less so in MAEA knockout cells. (I) Amino acid starvation of HEK293T cells for 16 h leads to reduced expression of UCK2 in WT cells, but MAEA knockout cells show a less pronounced reduction. (J) Quantification of (I) is presented in bar graphs. Mean ± SD, n = 4 biological replicate. *p < 0.05. (K) UCK2 protein levels were extracted from the previously reported data on the TMT proteomics comparison of WT and MAEA −/− HEK293T cells with or without Torin1 treatment for 10 h. Mean ± SD, n = 4 biological replicates. (L) AHA degradomics design to unbiasedly compare the proteome turnover of MAEA −/− cells stably expressing HA-MAEAWT or MAEAY394A mutant in the presence or absence of mTOR inhibition for 10 h. (M) The total TMT intensity of the 18-TMTpro channels is plotted after normalizing them to the UT, 0 h condition. (N) Principal component analysis of the AHA degradomics datasets demonstrates consistency across the replicates. (O) Volcano plot of the −log10-transformed p value versus the log2-transformed ratio of cells expressing Y394A/WT MAEA treated with Torin1 (10 h, 250 nM). p values were calculated by two-sided Welch’s t test (adjusted to 1% false discovery rate for multiple comparisons). A total of 9,373 proteins were quantified. n =3 biological replicates. (P) The relative AHA ratio for the 14 top proteins that exhibit MAEA-dependent stabilization during mTOR inhibition was plotted.
Figure 3.
Figure 3.. WDR26 adaptor is required for efficient turnover of UCK2
(A) WDR26, MKLN1, and GID4 are highlighted in the supramolecular CTLH complex. (B) Representative histograms of GFP intensity comparing WDR26−/−, MKLN1−/−, and GID4−/− HEK293T UCK2-mEGFP knockin (K/I) cells upon treatment with CHX (1 μM) or CHX and RM6 (3 nM). (C) The average values of triplicate experiments in (B) are shown (mean ± SD). ***p < 0.001, ****p< 0.0001. (D) WDR26 knockout stabilizes UCK2 levels through 16-h torin1 treatment. (E) Western blot evaluating UCK2 degradation in WT, MKLN1−/−, WDR26−/−, or MKLN1−/−/WDR26−/− cells upon Torin1 treatment for 0, 8, and 16 h. (F) Affinity purification of UCK2-V5 using indicated knockout cell lines suggests that both MAEA and WDR26 are required for UCK2’s interaction with the CTLH complex. *Non-specific band. (G) Flow cytometry analysis of WT and YPEL5−/− HEK293T UCK2-mEGFP K/I cells indicates partial suppression of UCK2 level reduction after YPEL5 depletion. Mean ± SD, n = 3 biological replicates. ****p < 0.0001. (H) Representative frequency histogram of the data in (G). (I) Immunoblot analysis of WT and YPEL5−/− HEK293T cell extracts. (J) Affinity purification of UCK2-V5 suggests that YPEL5 enhances the binding of UCK2 to the CTLH complex. (K) Proposed role of YPEL5 in regulating the CTLH/WDR26 substrates.
Figure 4.
Figure 4.. The CTLH/WDR26 E3 activity influences the cytoplasmic level of UCK2
(A) Imaging analysis of 293T and HCT116 UCK2-mEGFP homozygous K/I cells displays heterogeneous UCK2 subcellular localization across the clonal cells. 1 exemplifies N < C, 2 exemplifies N = C, and 3 exemplifies N > C. Scale bar, 10 μm. (B) Quantification of (A). N < C: cytoplasmic accumulation, N = C: equal distribution between the nucleus and cytoplasm, N > C: nuclear accumulation. n = 3 image sections, mean ± SD shown. Eighty-six cells for HEK293T and 148 cells for HCT116 were quantified. (C) Live cell imaging analysis of HCT116 UCK2-mEGFP K/I cells suggests that UCK2 localization changes as the cell cycle progresses. (D) Double thymidine blocking scheme to synchronize cells at the early S phase. (E) Cells synchronized with double thymidine block enter mitosis 8–10 h following release. (F) A representative image of the UCK2-mEGFP cells following the thymidine release indicates that UCK2 is concentrated in the nucleus at the early S phase. Scale bar, 10 μm. (G) HEK293T UCK2-mEGFP cells underwent double thymidine blocking as in (D), and the nuclear-cytosolic distribution of UCK2 was analyzed in individual cells from their post-mitotic point (0 h) and every hour for 12 h thereafter. n = 42 cells were quantified. N < C: cytoplasmic, N = C: equal distribution, N > C: nuclear. (H) The 16-h RM6 treatment changes the distribution of UCK2 in MAEA-dependent manner using HEK293T UCK2-mEGFP K/I cells. The population of cells showing N > C UCK2 distribution increases in WT, but not MAEA−/−, cells after RM6 treatment. Scale bar, 20 μm. (I) The images in (H) are represented using a LUT (look-up table) to show the pixel brightness. Identical exposure time and laser intensity were applied for microscopic analysis. Scale bar, 20 μm, pixel intensity: A.U. (J) The quantification of n > 180 cells in (H) is shown. Mean ± SD of n > 13 image sections.
Figure 5.
Figure 5.. UCK1 controls the sub-cellular localization of UCK2 and its degradation
(A) Microscopy analysis of the UCK2-mEGFP = K/I cells with WT UCK1, UCK1−/−, or UCK1−/− over-expressing mCherry-UCK1. Depletion of UCK1 results in cytoplasmic accumulation of UCK2, while over-expression of mCherry-UCK1 leads to nuclear accumulation of UCK2. mCh, mCherry. Scale bar, 20 μm. (B) Quantification of (A). n > 250 cells. Mean ± SD of n > 4 image sections is shown. (C) Flow cytometry analysis of the HEK293T UCK2-mEGFP K/I cells (WT, UCK1−/−, or UCK1V5 over-expression in WT background) shows that over-expressing UCK1 hinders efficient turnover of UCK2. n = 3 biological replicates. O/E, over-expression. *p< 0.05, ****p< 0.0001. (D) UCK2-mEGFP K/I cells with WT UCK1, UCK1−/−, or UCK1−/− over-expressing mCherry-UCK1 were treated or left untreated with RM6 for 16 h before live-cell imaging analysis. Scale bar, 20 μm. See also Figure S5C. (E) Generation of HEK293T and HCT116 cells expressing endogenous UCK2-HA via CRISPR-Cas9 approach. (F) Immunoprecipitation of HEK293T UCK2-HA K/I cells detects strong interactions between endogenous UCK1 and UCK2 proteins. asterisk: UCK2-HA detected by the polyclonal UCK1 antibody. (G) HEK293T UCK2-HA K/I cells were subjected to formaldehyde crosslinking (0.5%, 1 h) before immunoblotting. Anti-HA antibody-reactive ladders suggest that UCK2 forms oligomers in cells. F.A., formaldehyde. (H) Immunoprecipitation of HEK293T UCK2-HA cell lysates following formaldehyde crosslinking (0.5%, 30 min). The elute of the crosslinked sample shows strong enrichment of monomeric and potentially dimeric UCK1 complex, suggesting their binding to UCK2 monomer and dimers. *UCK2-HA detected by the polyclonal UCK1 antibody. (I) Proposed model of UCK2 and UCK1 hetero oligomerization and their role in UCK2 subcellular localization.
Figure 6.
Figure 6.. Controlling the UCK2 level is important for pyrimidine synthesis via the salvage pathway
(A) Schematic of heavy isotope tracing. L-glutamine- N serves as a label for de novo pathway products, whereas uridine-13C5 labels metabolites synthesized through the salvage pathway. (B) Immunoblot comparing UCK2 protein levels in the cell lines used in isotope tracing. (C) Quantification of UCK2 levels between WT and MAEA−/− cells as in (B). MAEA−/− cells express 30% higher UCK2 levels than WT. **p < 0.01. (D and E) Relative abundance of UDP and UTP containing 15N (de novo product), 13C5 (salvage product), and no heavy isotope (unlabeled). Mean ± SD of n =4 biological replicates. ***p < 0.001, ****p < 0.0001. (F) Cells with higher UCK2 levels may demonstrate more efficient metabolism of pyrimidine analog prodrugs into their cytotoxic forms. (G) Cell survival of WT, MAEA−/−, and UCK2 over-expressing HEK293T cells in response to 72 h of 5-azacytidine treatment. MAEA−/− cells were twice as sensitive as WT cells, whereas UCK2 over-expressing cells had a 160-fold decrease in their IC50. Mean ± SD of n = 6 biological replicates. *p < 0.05, **p < 0.01, ****p < 0.0001. (H) Cell survival at 72 h after treatment with 5-azacytidine (5-AzaCd) or 5-fluorouridine (5-FUd) with or without dTAGv1 (100 nM) in HCT116 UCK2-FKBP12F36V K/I cells. dTAGv1-mediated degradation of UCK2 results in 156-fold resistance to 5-FUd and 1.6-fold to 5-AzaCd. Mean ± SD, n = 12 biological replicates.
Figure 7.
Figure 7.. Summary of the mTORC1-CTLH E3-mediated turnover of UCK2

References

    1. Wang W, Cui J, Ma H, Lu W, and Huang J (2021). Targeting Pyrimidine Metabolism in the Era of Precision Cancer Medicine. Front. Oncol. 11, 684961. 10.3389/fonc.2021.684961. - DOI - PMC - PubMed
    1. Fu Y, Wei XD, Guo L, Wu K, Le J, Ma Y, Kong X, Tong Y, and Wu H (2022). The Metabolic and Non-Metabolic Roles of UCK2 in Tumor Progression. Front. Oncol. 12, 904887. 10.3389/fonc.2022.904887. - DOI - PMC - PubMed
    1. Shen G, He P, Mao Y, Li P, Luh F, Ding G, Liu X, and Yen Y (2017). Overexpression of Uridine-Cytidine Kinase 2 Correlates with Breast Cancer Progression and Poor Prognosis. J. Breast Cancer 20, 132–141. 10.4048/jbc.2017.20.2.132. - DOI - PMC - PubMed
    1. Wu Y, Jamal M, Xie T, Sun J, Song T, Yin Q, Li J, Pan S, Zeng X, Xie S, and Zhang Q (2019). Uridine-cytidine kinase 2 (UCK2): A potential diagnostic and prognostic biomarker for lung cancer. Cancer Sci. 110, 2734–2747. 10.1111/cas.14125. - DOI - PMC - PubMed
    1. Yu S, Li X, Guo X, Zhang H, Qin R, and Wang M (2019). UCK2 up-regulation might serve as an indicator of unfavorable prognosis of hepatocellular carcinoma. IUBMB Life 71, 105–112. 10.1002/iub.1941. - DOI - PubMed

Publication types

MeSH terms

LinkOut - more resources