. 2025 Jan 14;21(1):e1012602.
doi: 10.1371/journal.ppat.1012602. eCollection 2025 Jan.

Naturally occurring variation in a cytochrome P450 modifies thiabendazole responses independently of beta-tubulin

Affiliations

Naturally occurring variation in a cytochrome P450 modifies thiabendazole responses independently of beta-tubulin

J B Collins et al. PLoS Pathog. .

Abstract

Widespread anthelmintic resistance has complicated the management of parasitic nematodes. Resistance to the benzimidazole (BZ) drug class is nearly ubiquitous in many species and is associated with mutations in beta-tubulin genes. However, mutations in beta-tubulin alone do not fully explain all BZ resistance. We performed a genome-wide association study using a genetically diverse panel of Caenorhabditis elegans strains to identify loci that contribute to resistance to the BZ drug thiabendazole (TBZ). We identified a quantitative trait locus (QTL) on chromosome V independent of all beta-tubulin genes and overlapping with two promising candidate genes, the cytochrome P450 gene cyp-35D1 and the nuclear hormone receptor nhr-176. Both genes were previously demonstrated to play a role in TBZ metabolism. NHR-176 binds TBZ and induces the expression of CYP-35D1, which metabolizes TBZ. We generated single gene deletions of cyp-35D1 and nhr-176 and found that both genes play a role in TBZ response. A predicted high-impact lysine-to-glutamate substitution at position 267 (K267E) in CYP-35D1 was identified in a sensitive strain, and reciprocal allele replacement strains in different genetic backgrounds were used to show that the lysine allele conferred increased TBZ resistance. Using competitive fitness assays, we found that neither allele was deleterious, but the lysine allele was selected in the presence of TBZ. Additionally, we found that the lysine allele significantly increased the rate of TBZ metabolism compared to the glutamate allele. Moreover, yeast expression assays showed that the lysine version of CYP-35D1 had twice the enzymatic activity of the glutamate allele. To connect our results to parasitic nematodes, we analyzed four Haemonchus contortus cytochrome P450 orthologs but did not find variation at the 267 position in fenbendazole-resistant populations. Overall, we confirmed that variation in this cytochrome P450 gene is the first locus independent of beta-tubulin to play a role in BZ resistance.


Conflict of interest statement

The authors have declared that no competing interests exist.

Figures

Fig 1
Fig 1. One large-effect QTL on chromosome V underlies differences in TBZ response.
(A) Distribution of normalized relative resistance in 62.5 μM TBZ is shown in order from most susceptible to most resistant for 214 wild C. elegans strains. Strains with variation in ben-1 have a red triangle at the base of the bar for that strain. (B) Genome-wide association mapping results for animal length that has been regressed for the effect of ben-1 are shown. The genomic position is shown on the x-axis, and statistical significance (-log10(p) values) is shown on the y-axis for each SNV. SNVs are colored pink if they pass the Eigen significance threshold (dashed horizontal line) or red if they pass the Bonferroni significance threshold (solid horizontal line). (C) Linkage mapping results for animal length are shown. The genomic position is shown on the x-axis, and the statistical significance (logarithm of the odds (LOD) score) is shown on the y-axis for 13,003 genomic markers. A red triangle indicates a significant QTL, and a blue rectangle indicates the 95% confidence interval around the QTL.
Fig 2
Fig 2. A lysine at position 267 of CYP-35D1 confers increased resistance to TBZ.
(A) Strain names are displayed on the y-axis. The genomic background and the background where each cyp-35D1 allele originates are shown as orange or blue for N2 or CB4856, respectively. (B) Regressed median animal length values of response to 32.5 μM TBZ are shown on the x-axis. Each point represents a well that contains approximately 30 animals after 48 hours of exposure to TBZ. Data are shown as box plots with the median as a solid vertical line, the right and left vertical lines of the box represent the 75th and 25th quartiles, respectively. The top and bottom horizontal whiskers extend to the maximum point within 1.5 interquartile range from the 75th and 25th quartiles, respectively. Statistical significance is shown above each strain comparison; the N2 and CB4856 strain values are also significantly different (p < 0.01 = **, p < 0.0001 = ****, Tukey HSD).
Fig 3
Fig 3. Competitive fitness assay across seven generations in DMSO and TBZ.
(A) The change in allele frequencies of the lysine (orange) and glutamate (gray) alleles in the N2 background was determined using competitions between a barcoded N2 strain in 1% DMSO. Generation is shown on the x-axis, and the relative allele frequency of each strain is shown on the y-axis. (B) The log2-transformed competitive fitness of each allele is plotted. The allele tested is shown on the x-axis, and the competitive fitness is shown on the y-axis. Each point represents a biological replicate of that competition experiment. (C) The change in allele frequencies of the lysine (orange) and glutamate (gray) alleles in the N2 background was determined using a competition with a barcoded N2 strain in 25 μM TBZ. (D) The log2-transformed competitive fitness value of each allele is plotted. Each point represents one biological replicate of the competition assay. Data are shown as box plots, with the median as a solid horizontal line and the top and bottom of the box representing the 75th and 25th quartiles, respectively. The top and bottom whiskers are extended to the maximum point that is within 1.5 interquartile range from the 75th and 25th quartiles, respectively. The top and bottom vertical whiskers extend to the maximum point within 1.5 interquartile range from the 75th and 25th quartiles, respectively. Significant differences between the wild-type strain and all other alleles are shown as asterisks above the data from each strain (p > 0.05 = ns, p < 0.0001 = ****, Tukey HSD).
Fig 4
Fig 4. The abundances of TBZ and TBZ metabolites in the endo-metabolome six hours after exposure.
(A) Simplified TBZ metabolic pathway. (B) The change in the normalized abundances of TBZ and three metabolites: TBZ-OH, TBZ-O-glucoside, and TBZ-O-phosphoglucoside) are shown, with samples taken at six hours after exposure to 50 μM TBZ. CYP-35D1 alleles are shown on the x-axis with K267 (orange) and K267E (light gray) in the N2 genetic background, and E267 (blue) and E267K (dark gray) in the CB4856 genetic background. Normalized metabolite abundance is shown on the y-axis. Abundances are shown as the log of abundance after normalization to the abundance of ascr#2. Each point represents an individual replicate. Data are shown as box plots, with the median as a solid horizontal line and the top and bottom of the box representing the 75th and 25th quartiles, respectively. The top and bottom whiskers are extended to the maximum point that is within 1.5 interquartile range from the 75th and 25th quartiles, respectively. The top and bottom vertical whiskers extend to the maximum point within 1.5 interquartile range from the 75th and 25th quartiles, respectively. Statistical significance between strains with the same genetic background at the same time point is shown (p > 0.05 = ns, p < 0.05 = *, p < 0.0001 = ****, Wilcoxon Rank Sum test with Bonferroni correction).
Fig 5
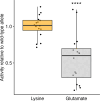
Fig 5. Activity of wild-type and mutant CYP-35D1 expressed in yeast.
The metabolic activity of the lysine and glutamate versions of CYP-35D1 when expressed in yeast and exposed to 100 μM TBZ for six hours is shown. The activity of each enzyme is shown relative to the wild-type activity. Each point represents an individual replicate. Data are shown as box plots, with the median as a solid horizontal line and the top and bottom of the box representing the 75th and 25th quartiles, respectively. The top and bottom whiskers are extended to the maximum point that is within 1.5 interquartile range from the 75th and 25th quartiles, respectively. The top and bottom vertical whiskers extend to the maximum point within 1.5 interquartile range from the 75th and 25th quartiles, respectively. Significant differences between the lysine and glutamate allele are shown as asterisks (p > 0.05 = ns, p < 0.05 = *, Wilcoxon Rank Sum test with Bonferroni correction). Differences observed between replicates of the same transgenic yeast line exceed any observed differences between different lines.
Fig 6
Fig 6. Variation in CYP-35D1 is not regionally distributed.
A map with the locations where each wild strain was recovered is shown. Each point represents a strain isolation location and is colored by the allele at the 267 position of CYP-35D1. (B) A neighbor-joining tree for the cyp-35D1 locus is shown. Each circle represents one wild strain and is colored by the allele at the 267 amino-acid position. Some areas where many strains were collected could not show all points because they are covered by other points. Map generated using ggplot2 under a MIT license (https://ggplot2.tidyverse.org/LICENSE.html).
Fig 7
Fig 7. Lysine at position 267 of CYP-35D1 orthologs is unique to C. elegans.
Neighbor-joining tree for seven species across the Caenorhabditis clade, four orthologs from H. contortus, and the free-living nematode Diploscapter coronatus as an outgroup. The tree scale is denoted on the left side of the tree and represents differences in the sequences of the CYP-35D1 ortholog found in each species. (B) Amino-acid alignment of the region surrounding position 267 in CYP-35D1 for the species shown in the neighbor-joining tree.

References

    1. Hotez PJ, Aksoy S, Brindley PJ, Kamhawi S. World neglected tropical diseases day. PLoS Negl Trop Dis. 2020;14: e0007999. doi: 10.1371/journal.pntd.0007999 - DOI - PMC - PubMed
    1. Miller CM, Waghorn TS, Leathwick DM, Candy PM, Oliver A-MB, Watson TG. The production cost of anthelmintic resistance in lambs. Vet Parasitol. 2012;186: 376–381. doi: 10.1016/j.vetpar.2011.11.063 - DOI - PubMed
    1. Kaplan RM, Vidyashankar AN. An inconvenient truth: global worming and anthelmintic resistance. Vet Parasitol. 2012;186: 70–78. doi: 10.1016/j.vetpar.2011.11.048 - DOI - PubMed
    1. Howell SB, Burke JM, Miller JE, Terrill TH, Valencia E, Williams MJ, et al.. Prevalence of anthelmintic resistance on sheep and goat farms in the southeastern United States. J Am Vet Med Assoc. 2008;233: 1913–1919. doi: 10.2460/javma.233.12.1913 - DOI - PubMed
    1. Krücken J, Fraundorfer K, Mugisha JC, Ramünke S, Sifft KC, Geus D, et al.. Reduced efficacy of albendazole against Ascaris lumbricoides in Rwandan schoolchildren. Int J Parasitol Drugs Drug Resist. 2017;7: 262–271. doi: 10.1016/j.ijpddr.2017.06.001 - DOI - PMC - PubMed

MeSH terms

LinkOut - more resources