. 2024 Nov 22;103(47):e40608.
doi: 10.1097/MD.0000000000040608.

Identification and validation of a novel defined stress granule-related gene signature for predicting the prognosis of ovarian cancer via bioinformatics analysis

Affiliations

Identification and validation of a novel defined stress granule-related gene signature for predicting the prognosis of ovarian cancer via bioinformatics analysis

Xiaoqi Chen et al. Medicine (Baltimore). .

Abstract

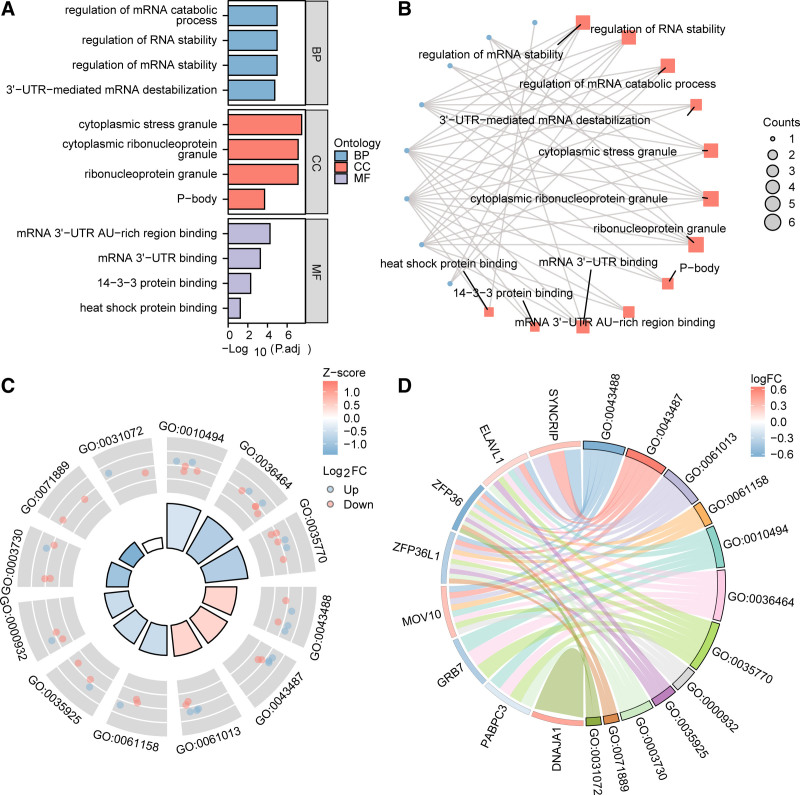
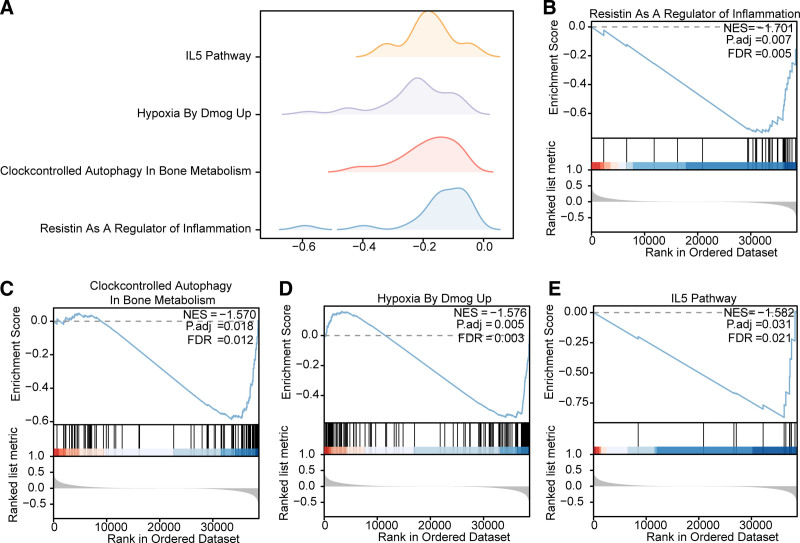
Ovarian cancer (OC) is a malignant gynecological cancer with an extremely poor prognosis. Stress granules (SGs) are non-membrane organelles that respond to stressors; however, the correlation between SG-related genes and the prognosis of OC remains unclear. This systematic analysis aimed to determine the expression levels of SG-related genes between high- and low-risk groups of patients with OC and to explore the prognostic value of these genes. RNA-sequencing data and clinical information from GSE18520 and GSE14407 in the Gene Expression Omnibus (GEO) and ovarian plasmacytoma adenocarcinoma in The Cancer Genome Atlas (TCGA) were downloaded. SG-related genes were obtained from GeneCards, the Molecular Signatures Database, and the literature. First, 13 SG-related genes were identified in the prognostic model using least absolute shrinkage and selection operator (LASSO) Cox regression. The prognostic value of each SG-related gene for survival and its relationship with clinical characteristics were evaluated. Next, we performed a functional enrichment analysis of SG-related genes. The protein-protein interactions (PPI) of SG-related genes were visualized using Cytoscape with STRING. According to the median risk score from the LASSO Cox regression, a 13-gene signature was created. All patients with OC in TCGA cohort and GEO datasets were classified into high- and low-risk groups. Five SG-related genes were differentially expressed between the high- and low-risk OC groups in the GEO datasets. The 13 SG-related genes were related to several important oncogenic pathways (TNF-α signaling, PI3K-AKT-mTOR signaling, and WNT-β-catenin signaling) and several cellular components (cytoplasmic stress granule, cytoplasmic ribonucleoprotein granule, and ribonucleoprotein granule). The PPI network identified 11 hub genes with the strongest interactions with ELAVL1. These findings indicate that SG-related genes (DNAJA1, ELAVL1, FBL, GRB7, MOV10, PABPC3, PCBP2, PFN1, RFC4, SYNCRIP, USP10, ZFP36, and ZFP36L1) can be used to predict OC prognosis.


Conflict of interest statement

The authors have no conflict of interest to disclose.

Figures

Figure 1.
Figure 1.
Workflow diagram. GO = gene ontology, GSEA = gene set enrichment analysis, GSVA = gene set variation analysis, KEGG = Kyoto Encyclopedia of Genes and Genomes, OV = ovarian plasmacytoma adenocarcinoma, PPI network = Protein–Protein Interaction Network, SGRGs = stress granule-related genes, TCGA = the cancer genome atlas.
Figure 2.
Figure 2.
Dataset normalization. (A) Box plot of dataset before normalization. (B) Box plot of dataset after normalization. (C) PCA plot of dataset before normalization. (D) PCA plot of dataset after normalization. PCA = principal component analysis.
Figure 3.
Figure 3.
Cox regression and related prognostic analysis. (A) Forest map of thirteen key genes of SGRGs. (B) Nomogram of cox regression for thirteen key genes of SGRGs. (C) The calibration curves test consistency between the actual overall survival rates and the predicted survival rates at 1, 3, and 5 years. (D–F) DCA of cox regression model. 1 (D), 3 (E), and 5 (F) years DCA of cox regression model. DCA = decision curve analysis, SGRGs = stress granule-related genes.
Figure 4.
Figure 4.
Screening of key genes of SGRGs by LASSO regression analysis and clinical relevant analysis. (A) The change track of every independent variable (horizontal axis: log value of the independent variable lambda; vertical axis: the coefficient of the independent variable). (B) Confidence interval under every lambda. (C) LASSO risk factor chart. (D–K) Time dependent ROC curves of genes GRB7 (D), PCBP2 (E), ZFP36L1 (F), ZFP36 (G), MOV10 (4H), PABPC3 (I), FBL (J), and LASSO model (K). LASSO = least absolute shrinkage and selection operator, SGRGs = stress granule-related genes.
Figure 5.
Figure 5.
Difference of hub genes related to clinical. (A) Heatmap of thirteen hub genes. (B) Chromosomal mapping of thirteen hub genes. (C) Violin chart of hub genes related to clinical. *, **, *** represent the P < .05, P < .01, and P < .001, respectively.
Figure 6.
Figure 6.
Identification of DEGs. Volcano map (A) and differential ranking map (B) for differential expression analysis between the high-risk group (High) and low-risk group (Low) of the dataset TCGA-OV. (C) Heatmap of hub genes between high-risk and low-risk groups in the dataset TCGA-OV. (D–E) Comparison chart of hub genes between high-risk and low-risk groups in datasets TCGA-OV (D) and combined datasets (E). ns represents the P > .05. *, **, *** represent the P < .05, P < .01, and P < .001, respectively. OV = ovarian plasmacytoma adenocarcinoma, TCGA = the cancer genome atlas.
Figure 7.
Figure 7.
Gene ontology and KEGG pathway analysis. (A) Bar chart of GO and KEGG enrichment analysis of thirteen hub genes. (B) Network diagrams of GO and KEGG enrichment analysis of thirteen hub genes. The blue dots and red squares represent specific genes and specific pathways, respectively. (C) Circle chart of GO and KEGG enrichment analysis of thirteen hub genes combined with logFC. (D) Chord chart of GO and KEGG enrichment analysis of thirteen hub genes combined with logFC. BP = biological process, CC = cellular component, GO = gene ontology, KEGG = kyoto encyclopedia of genes and genomes, MF = molecular function.
Figure 8.
Figure 8.
Gene set enrichment analysis. (A) Mountain map of GSEA. (B–E) Enrichment in the resistin as a regulator of inflammation (B), clock-controlled autophagy in bone metabolism (C), hypoxia by DMOG up (D), and IL5 pathway (E). GSEA = gene set enrichment analysis, OV = ovarian plasmacytoma adenocarcinoma, TCGA = the cancer genome atlas.
Figure 9.
Figure 9.
Gene set variation analysis. (A) Heatmap of GSVA. (B) Comparison chart of significantly enrichment pathways between high-risk and low-risk groups in datasets TCGA-OV of GSVA. ns represents the P > .05. *, **, *** represent the P < .05, P < .01, and P < .001, respectively. GSVA = gene set variation analysis, OV = ovarian plasmacytoma adenocarcinoma, TCGA = the cancer genome atlas.
Figure 10.
Figure 10.
PPI network. (A) PPI network of thirteen hub genes. (B) PPI network of thirteen hub genes in MCC. (C) Interaction network of functionally similar genes to thirteen hub genes through GeneMANIA website. MCC = maximal clique centrality, PPI = protein-protein interaction.

References

    1. Siegel RL, Miller KD, Jemal A. Cancer statistics, 2017. CA Cancer J Clin. 2017;67:7–30. - PubMed
    1. Weidle UH, Birzele F, Kollmorgen G, Rueger R. Mechanisms and targets involved in dissemination of ovarian cancer. Cancer Genomics Proteomics. 2016;13:407–23. - PMC - PubMed
    1. Gorski JW, Ueland FR, Kolesar JM. CCNE1 amplification as a predictive biomarker of chemotherapy resistance in epithelial ovarian cancer. Diagnostics (Basel). 2020;10:279. - PMC - PubMed
    1. Protter DSW, Parker R. Principles and properties of stress granules. Trends Cell Biol. 2016;26:668–79. - PMC - PubMed
    1. Khong A, Matheny T, Jain S, Mitchell SF, Wheeler JR, Parker R. The stress granule transcriptome reveals principles of mRNA accumulation in stress granules. Mol Cell. 2017;68:808–20.e5. - PMC - PubMed

Substances