. 2025 Jan;15(1):240340.
doi: 10.1098/rsob.240340. Epub 2025 Jan 15.

A simple inland culture system provides insights into ascidian post-embryonic developmental physiology

Affiliations

A simple inland culture system provides insights into ascidian post-embryonic developmental physiology

Birthe Thuesen Mathiesen et al. Open Biol. 2025 Jan.

Abstract

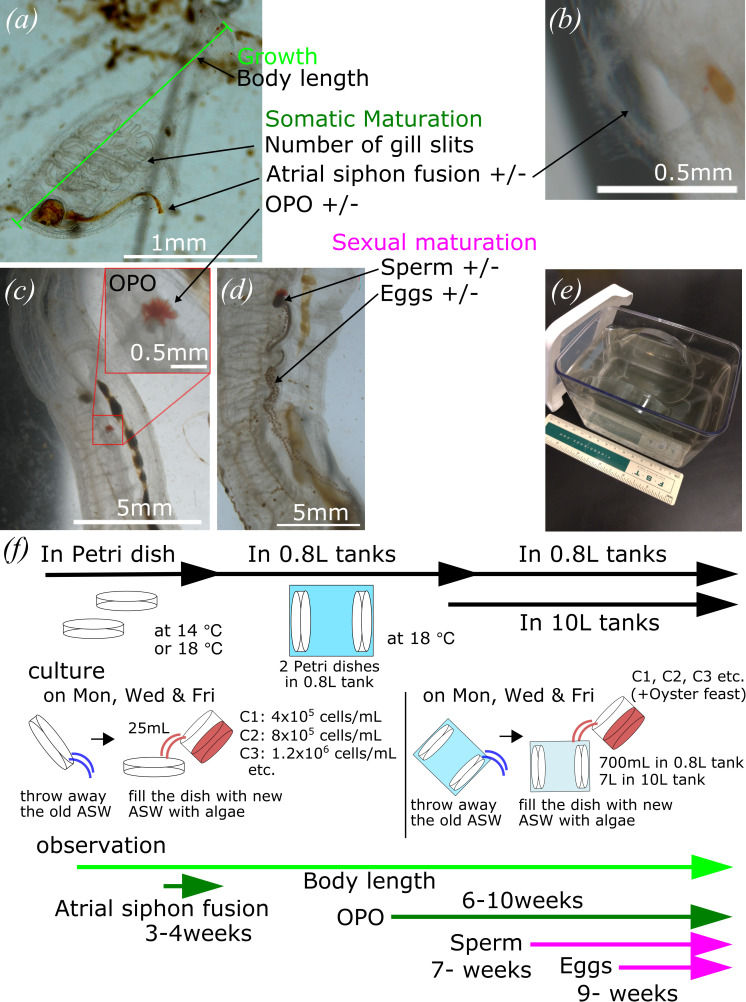
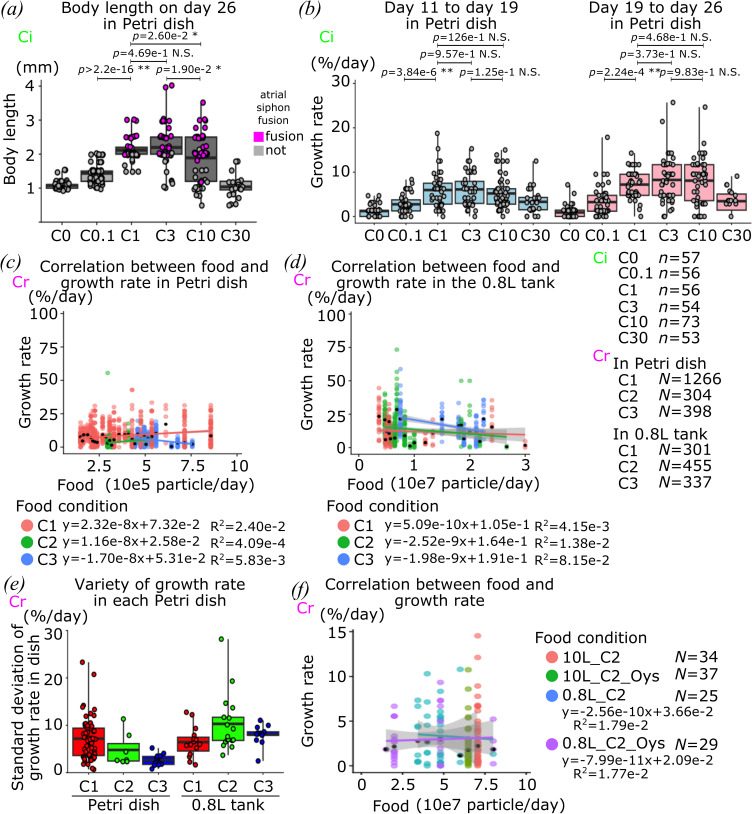
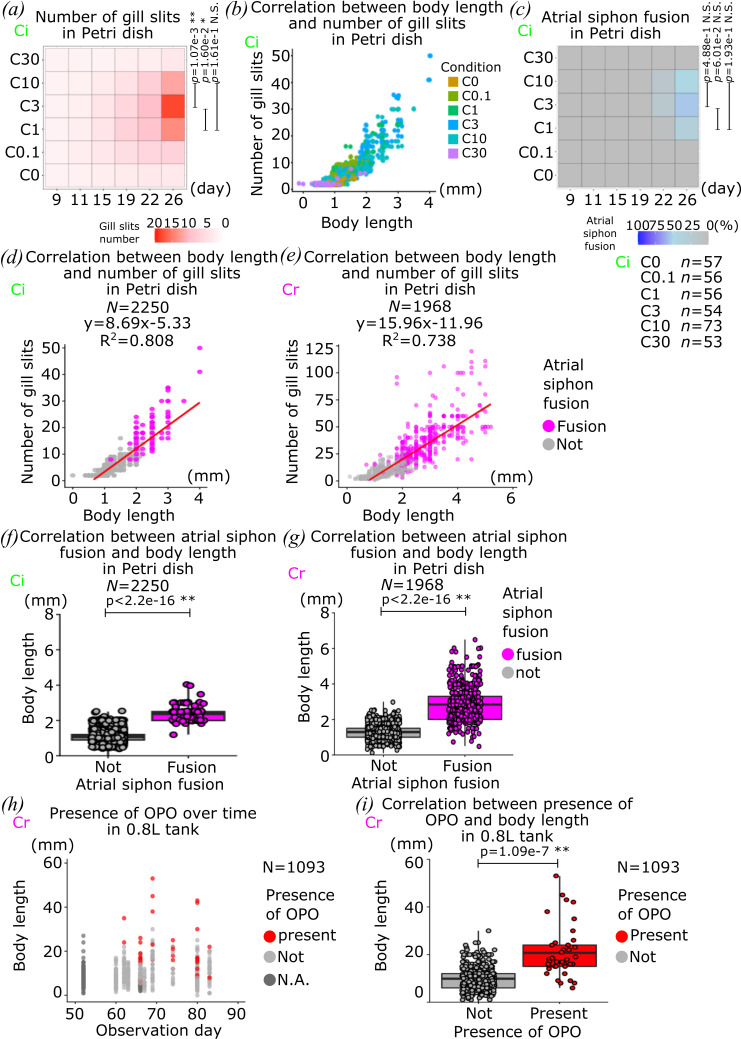
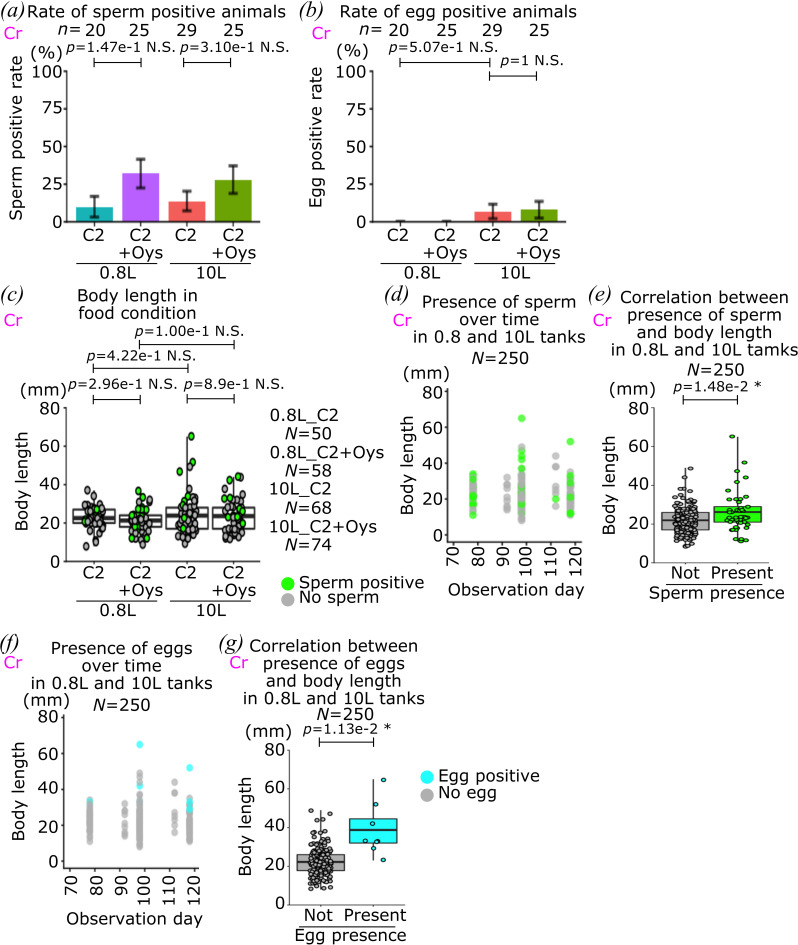
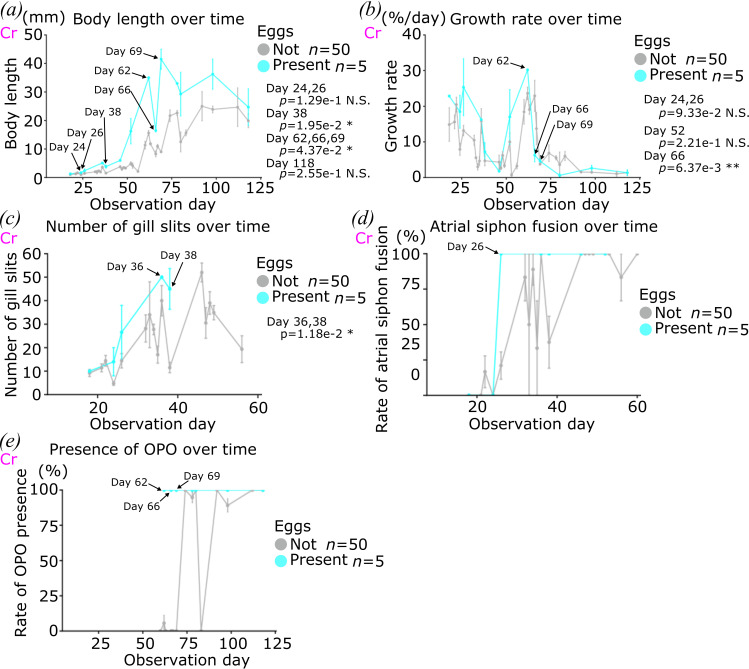
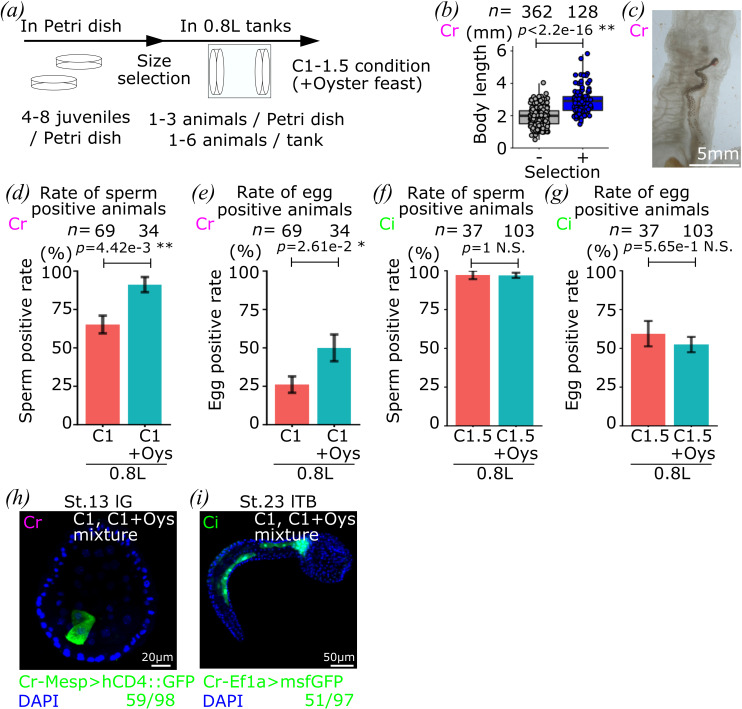
Maintenance and breeding of experimental organisms are fundamental to life sciences, but both initial and running costs, and hands-on zootechnical demands can be challenging for many laboratories. Here, we first aimed to further develop a simple protocol for reliable inland culture of tunicate model species of the Ciona genus. We cultured both Ciona robusta and Ciona intestinalis in controlled experimental conditions, with a focus on dietary variables, and quantified growth and maturation parameters. From statistical analysis of these standardized datasets, we gained insights into the post-embryonic developmental physiology of Ciona and inferred an improved diet and culturing conditions for sexual maturation. We showed that body length is a critical determinant of both somatic and sexual maturation, which suggests the existence of systemic control mechanisms of resource allocation towards somatic growth or maturation and supports applying size selection as a predictor of reproductive fitness in our inland culture to keep the healthiest animals at low density in the system. In the end, we successfully established a new protocol, including size selection, to promote both sperm and egg production. Our protocol using small tanks will empower researchers to initiate inland Ciona cultures with low costs and reduced space constraints.

Keywords: growth; growth burst; inland culture; maturation; tunicate.


Conflict of interest statement

We declare we have no competing interests.

Figures

Monitoring growth and maturation of C. robusta and C. intestinalis in inland culture
Figure 1.
Monitoring growth and maturation of C. robusta and C. intestinalis in inland culture. (a) Body length was measured as a parameter for growth, and the number of gill slits was counted as a parameter for somatic maturation. Atrial siphon fusion was observed as a parameter for somatic maturation in juvenile stage as binary data. (b) We scored the completion of atrial siphon fusion when the two openings become one. (c) OPO was observed as a parameter for somatic maturation in adult stage as binary data. (d) Sperm and eggs were observed as parameters for sexual maturation as binary data. (e) A 0.8 l tank was used for inland culture. (f) Schedule for culturing and observation.
Effect of food availability on growth
Figure 2.
Effect of food availability on growth. (a) Box and dot plots show the body length of juveniles on day 26 in each dietary condition in Petri dish. (b) Box and dot plots show the growth rate of individual juveniles before and after day 19 in each dietary condition in Petri dish. (c) Correlation between food availability and growth rate in Petri dishes is shown in scatter plot. Each coloured line indicates a fitting curve. This plot uses a part of the data of food particles between 105 and 106 particle/day. (d) Correlation between food availability and growth rate in a 0.8 l tank is shown in scatter plot. Each coloured line shows fitting curve. This plot uses a part of data on food particles between 106 and 30 × 107 particle/day. (e) Variability of body length of each juvenile in culture system is shown as standard deviation of body length in each Petri dish. (f) Correlation between food accessibility and growth rate in each dietary condition after animal selection is shown in scatter plot. Each coloured line shows fitting curve. Each dot shows individual juveniles observed at one time point in (a–d,f). Black dots show the median of the growth rate among each dietary condition on particle base or each condition of different animal numbers in a Petri dish in (c,d,f). The colour indicates dietary conditions of the Petri dishes in (c,d,f). Magenta and grey show the completion of atrial siphon fusion or not on (a). Species of animals that are used in each graph are indicated by green ‘Ci’ and magenta ‘Cr’ for C. intestinalis and C. robusta, respectively. n means the number of animals and N means the number of data points. p-value was calculated by t‐test in (a,b). N.S., p > 0.05; *0.05 > p > 0.01; **0.01 > p.
Correlation between food availability and somatic maturation
Figure 3.
Correlation between food availability and somatic maturation. (a) Average of the number of gill slits on half side of juveniles over time in each dietary condition is shown in heat map. (b) Correlation between body length and number of gill slits of each dietary condition is shown in scatter plot. (c) The rate of juveniles which have undergone atrial siphon fusion over time in each dietary condition is shown in heat map. (d,e) Correlation between body length, the number of gill slits and atrial siphon fusion is shown in a scatter plot. The red line indicates a fitting curve. (f,g) Box and dot plots show correlation between atrial siphon fusion and body length. (h) Body length and presence of OPO over time are shown in scatter plot. (i) Box and dot plot shows correlation between the presence of OPO and body length. Each dot shows individual animals observed at one time point in (b,d–i). Magenta and grey show the completion of atrial siphon fusion or not in (d–g). Red and grey show the presence of OPO or not at the tip of sperm duct in (h,i). Species of animals which are used in each graph are indicated by green ‘Ci’ and magenta ‘Cr’ for C. intestinalis and C. robusta, respectively. n means the number of animals and N means the number of data points. p-value was calculated by t‐test in (a,c,f,g,i). N.S., p > 0.05; *0.05 > p > 0.01; **0.01 > p.
Sexual maturation of C. robusta
Figure 4.
Sexual maturation of C. robusta. (a) Rates of sperm positive animals out of the total animals in each dietary condition at the end of the culture are shown. (b) Rates of egg positive animals out of total animals in each dietary condition at the end of the culture are shown. (c) Box and dot plots show the body length of animals in each dietary condition. (d) Body length and presence of sperm over time are shown in scatter plot. (e) Box and dot plots show correlation between the presence of sperm and body length. (f) Body length and presence of eggs over time are shown in scatter plot. (g) Box and dot plots show correlation between the presence of eggs and body length. Each dot shows individual animal observed at one time point in (c–g). The colour indicates dietary conditions of the animals in the 0.8 and 10 l tanks with or without the Oyster feast as a supplemental food in (a,b). Error bars show standard error in (a,b). Green and grey show presence of sperm or not in (c–e). Cyan and grey show the presence of eggs or not in (f,g). Ciona robusta is used for all the graphs in this figure, which is indicated by magenta ‘Cr’. n means the number of animals and N means the number of data points. p-value was calculated by Fisher’s exact test in (a,b) and by t‐test in (c,e,g). N.S., p > 0.05; *0.05 > p > 0.01; **0.01 > p.
Trajectory of the egg-producing animals
Figure 5.
Trajectory of the egg-producing animals. Trajectories of growth (a), growth rate (b), number of gill slits (c), atrial siphon fusion (d) and presence of OPO (e) of the animals of egg producing (cyan) and neither sperm nor egg producing (grey) during our culture are shown. Ciona robusta is used for all the graphs in this figure, which is indicated by magenta ‘Cr’. p-value was calculated by t‐test in (a–c). n means the number of animals. N.S., p > 0.05; *0.05 > p > 0.01; **0.01 > p.
Verification of new protocol
Figure 6.
Verification of new protocol. (a) Schedule of culturing in our new protocol. In Petri dishes, 4–8 juveniles are cultured in C1 condition. After three weeks, the biggest 1−3 animals are selected in each Petri dish, then they are transferred into the 0.8 l tank. At most six animals in the 0.8 l tank are cultured in C1 condition with or without the Oyster feast. (b) The bigger juveniles in the population were selected by size selection. Blue and grey show selected and unselected juveniles, respectively. Each dot shows an individual animal observed at size selection. (c) An image of the egg-producing animal raised in our inland culture system. (dg) Rates of sperm (d,f) and egg (e,g) positive animals out of the total animals in each dietary condition at the end of the culture with C. robusta (d,e) and C. intestinalis (f,g) are shown. (h,i) The eggs obtained from inland-cultured C. robusta (h) and C. intestinalis (i) were used for electroporation. Numbers show signal positive embryos out of total embryos. Error bars show standard error in (d–g). Species of animals that are used in each graph and picture are indicated by green ‘Ci’ and magenta ‘Cr’ for C. intestinalis and C. robusta, respectively. n means the number of animals in (b,d–g). p-value was calculated by t‐test in (b), and by Fisher’s exact test in (d–g). N.S., p > 0.05; *0.05 > p > 0.01; **0.01 > p.
None

Similar articles

References

    1. Matthews BJ, Vosshall LB. 2020. How to turn an organism into a model organism in 10 ‘easy’ steps. J. Exp. Biol. 223, jeb218198. (10.1242/jeb.218198) - DOI - PMC - PubMed
    1. Bertile F, Matallana-Surget S, Tholey A, Cristobal S, Armengaud J. 2023. Diversifying the concept of model organisms in the age of -omics. Commun. Biol. 6, 1062. (10.1038/s42003-023-05458-x) - DOI - PMC - PubMed
    1. Satoh N. 2003. The ascidian tadpole larva: comparative molecular development and genomics. Nat. Rev. Genet. 4, 285–295. (10.1038/nrg1042) - DOI - PubMed
    1. Lemaire P. 2011. Evolutionary crossroads in developmental biology: the tunicates. Development 138, 2143–2152. (10.1242/dev.048975) - DOI - PubMed
    1. Stolfi A, Christiaen L. 2012. Genetic and genomic toolbox of the chordate Ciona intestinalis. Genetics 192, 55–66. (10.1534/genetics.112.140590) - DOI - PMC - PubMed

LinkOut - more resources