. 2025 Jan 15;16(1):20.
doi: 10.1038/s41419-025-07338-0.

RNF128 deficiency in macrophages promotes colonic inflammation by suppressing the autophagic degradation of S100A8

Affiliations

RNF128 deficiency in macrophages promotes colonic inflammation by suppressing the autophagic degradation of S100A8

Xianwen Ran et al. Cell Death Dis. .

Abstract

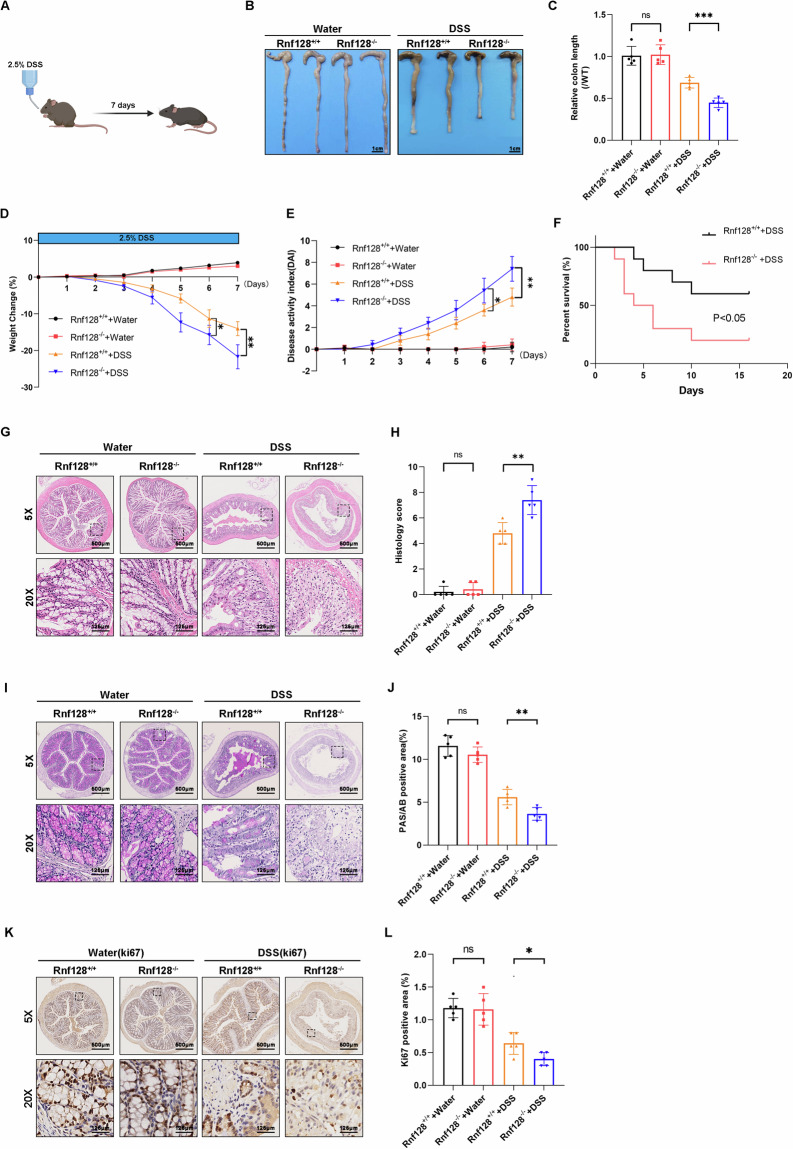
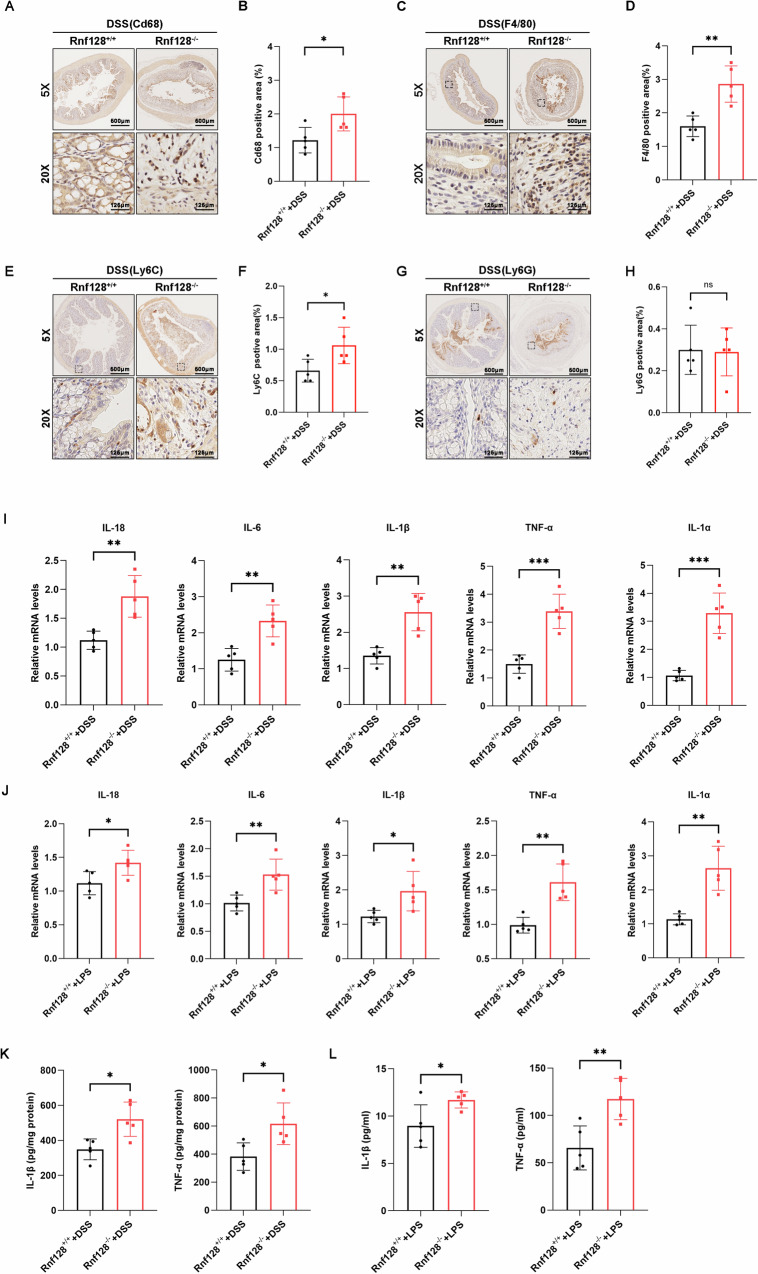
Macrophages play important roles in maintaining intestinal homeostasis and in the pathogenesis of inflammatory bowel diseases (IBDs). However, the underlying mechanisms that govern macrophage-mediated inflammation are still largely unknown. In this study, we report that RNF128 is downregulated in proinflammatory macrophages. RNF128 deficiency leads to elevated levels of effector cytokines in vitro and accelerates the progression of IBD in mouse models. Bone marrow transplantation experiments revealed that RNF128 deficiency in bone marrow cells contributes to the worsening of DSS-induced colitis. Mechanistically, RNF128 interacts with and destabilizes S100A8 by promoting its autophagic degradation, which is mediated by the cargo receptor Tollip. Moreover, the administration of an S100A8 neutralizing antibody mitigated the development of colitis and improved survival in DSS-treated Rnf128-/- mice. Overall, our study underscores the anti-inflammatory role of RNF128 in macrophages during the progression of colitis and highlights the potential of targeting the RNF128-Tollip-S100A8 axis to attenuate intestinal inflammation for the treatment of colitis.


Conflict of interest statement

Competing interests: The authors declare no competing interests. Ethics approval: All animal interventions were approved by the Animal Ethics Committee of The First Affiliated Hospital of Zhengzhou University, China. Human tissues used in this study was approved by the Human Ethical Committee of the First Affiliated Hospital of Zhengzhou University.

Figures

Fig. 1
Fig. 1. Inflammatory stimulation decreased RNF128 expression in macrophages.
A Representative images of immunofluorescence co-staining for RNF128 (green) and the indicated cell-type markers (red) in human colitis tissues. DAPI (blue) was used to label the nuclei. Scale bars, 10 μm. B Representative images of immunofluorescence co-staining for Rnf128 (green) and the indicated cell-type markers (red) in colitis tissues from DSS-induced colitis mice. DAPI (blue) labels the nuclei. Scale bars, 10 μm. C Relative RNF128 mRNA levels (normalized to GAPDH RNA levels) in PBMCs, BMDMs and THP-1 cells stimulated with LPS for different periods of time. Statistical data are presented as mean ± SD. *P < 0.05, **P < 0.01, ***P < 0.001. D Western blot analysis of RNF128 protein levels in PBMCs, BMDMs and THP-1 cells after LPS stimulation for different periods of time. E Relative RNF128 mRNA levels (normalized to GAPDH RNA levels) in peripheral blood monocytes from healthy (n = 20) and patients with colitis (n = 20). Statistical data are presented as mean ± SD. **P < 0.01. F Relative Rnf128 mRNA levels (normalized to GAPDH RNA levels) in BMDMs from control (n = 5) and DSS-induced colitis mice (n = 5). Statistical data are presented as mean ± SD. **P < 0.01. G Western blot analysis of Rnf128 protein levels in BMDMs from control (n = 5) and DSS-induced colitis mice (n = 5).
Fig. 2
Fig. 2. Rnf128 deficiency aggravated DSS-induced colon injury.
A Experimental scheme of DSS-induced colitis model. The mice were treated with 2.5% DSS drinking water for 7 consecutive days. B Representative images of colons from Rnf128+/+ (n = 5) and Rnf128−/− (n = 5) mice after DSS treatment for 7 days. Scale bars, 1 cm. C The colon length in (B) was measured. Statistical data are presented as mean ± SD. ns nonsense, ***P < 0.001. D The body weight of the mice in (B) was measured daily. Statistical data are presented as mean ± SD. *P < 0.05, **P < 0.01. E Disease activity index scores of the mice in (B). Statistical data are presented as mean ± SD. *P < 0.05, **P < 0.01. F Survival analysis of Rnf128+/+ and Rnf128−/− mice treated with water or 3% DSS (n = 10). Statistical data are presented as mean ± SD. *P < 0.05. G Representative H&E-staining images of colon sections from the mice in (B). Scale bar, 500 μm. H Histopathology score in (G) was measured. Statistical data are presented as mean ± SD. ns, nonsense, **P < 0.01. I Representative periodic acid sthiff-alcian blue (PAS/AB) staining images of colon sections from mice in (B). Scale bars, 500 μm. J The PAS-positive areas in (I) were measured and analyzed. Statistical data are presented as mean ± SD. ns, nonsense; **P < 0.01. K Representative Ki67 staining images of colon sections from mice in (B). Scale bars, 500 μm. L The Ki67 positive areas in (K) were measured and analyzed. Statistical data are presented as mean ± SD. ns nonsense. *P < 0.05.
Fig. 3
Fig. 3. RNF128 deficiency augments macrophage infiltration and inflammatory factors production.
A Rnf128+/+ (n = 5) and Rnf128−/− (n = 5) mice were exposed to 2.5% DSS for 7 days. Representative histochemical images of Cd68 staining in distal colon sections. Scale bars, 500 µm. B The staining positive areas in (A) were measured and analyzed. Statistical data are presented as mean ± SD. *P < 0.05. C Rnf128+/+ (n = 5) and Rnf128−/ (n = 5) mice were exposed to 2.5% DSS for 7 days. Representative histochemical images of F4/80 staining in distal colon sections. Scale bar, 500 µm. D The F4/80 positive areas in (C) were measured and analyzed. Statistical data are presented as mean ± SD. **P < 0.01. E Rnf128+/+ (n = 5) and Rnf128−/ (n = 5) mice were exposed to 2.5% DSS for 7 days. Representative histochemical images of Ly6C high staining in distal colon sections. Scale bars, 500 µm. F The Ly6C positive areas in (E) were measured and analyzed. Statistical data are presented as mean ± SD. *P < 0.05. G Rnf128+/+ (n = 5) and Rnf128−/− (n = 5) mice were exposed to 2.5% DSS for 7 days. Representative histochemical images of Ly6G high staining in distal colon sections. Scale bars, 500 µm. H The Ly6G positive areas in (G) were measured and analyzed. Statistical data are presented as mean ± SD. ns nonsense. I The mRNA levels of Il18, Il6, Il1β, Il1α and Tnf-α (each normalized to GAPDH RNA level) in colon tissues from Rnf128+/+ (n = 5) and Rnf128–/– (n = 5) mice subjected to 2.5% DSS. Statistical data are presented as mean ± SD. *P < 0.05, **P < 0.01, ***P < 0.001. J BMDMs were extracted from Rnf128+/+ and Rnf128–/– mice and stimulated with LPS (200 ng/ml) for 8 h. The mRNA levels of Il18, Il6, Il1β, Il1α and Tnf-α (each normalized to GAPDH RNA level) in the BMDMs were detected via qRT‒PCR. The statistical data are presented as mean ± SD. *P < 0.05, **P < 0.01. K ELISA analysis of IL-1β and TNF-α levels in colon tissue from Rnf128+/+ (n = 5) and Rnf128–/– (n = 5) mice subjected to 2.5% DSS. Statistical data are presented as mean ± SD. *P< 0.05. L ELISA analysis of IL-1β and TNF-α levels in the supernatant of BMDMs. Statistical data are presented as mean ± SD. *P < 0.05, **P < 0.01.
Fig. 4
Fig. 4. RNF128 in myeloid cells prevents DSS-induced colitis.
A Schematic diagram of the bone marrow transplantation experiments. B Rnf128+/+Rnf128+/+ (n = 5) and Rnf128−/−Rnf128+/+ mice (n = 5) were exposed to 2.5% DSS for 7 days. The body weight of mice was measured daily. Statistical data are presented as mean ± SD. *P < 0.05, ***P < 0.001. C Representative images of colons from the mice in (B). Scale bars, 1 cm. D The colon length in (B) was measured. Statistical data are presented as mean ± SD. **P < 0.01. E Representative H&E-staining images of colon sections from mice in (B). Scale bar, 500 μm. F Histopathology score in (E) were measured. Statistical data are presented as mean ± SD. ***P < 0.001. G Representative Ki67 staining images of distal colon tissue sections from the mice in (B). Scale bars, 500 μm. H The Ki67 positive areas in (G) were analyzed. Statistical data are presented as mean ± SD. *P < 0.05. I Representative F4/80 staining images of distal colon tissue sections from the mice in (B). Scale bar = 500 µm. J The F4/80 positive areas in (I) were measured. Statistical data are presented as mean ± SD. ***P < 0.001. K ELISA analysis of IL-1β and TNF-α levels in serum from the mice in (B). Statistical data are presented as mean ± SD. *P < 0.05, **P < 0.01.
Fig. 5
Fig. 5. RNF128 interacts with S100A8.
A THP-1 cells were transfected with empty vector or RNF128-Flag. The cell lysates were immunoprecipitated with an anti-FLAG antibody. S100A8 was identified via mass spectrometry. B Mass spectrometry analysis of S100A8 peptide immunoprecipitated by RNF128. C Total THP-1 cell lysates were immunoprecipitated with anti-RNF128 or anti-S100A8 antibodies. RNF128 and S100A8 were detected by western blot. D 239T cells were co-transfected with RNF128-Flag and S100A8-GFP for 48 h. Total cell lysates were immunoprecipitated with anti-Flag or anti-GFP antibodies. RNF128-Flag and S100A8-GFP were detected by western blot. E Immunofluorescence assay of RNF128 and S100A8 in THP-1 cells. Representative confocal microscopy images were shown. Scale bars, 5 μm. F The colocalization of RNF128 and S100A8 in THP-1 cells was analyzed. G Schematic diagram of RNF128-Flag and its truncation mutants. H 239T cells were co-transfected with RNF128-Flag, RNF128-Flag1-276, RNF128-Flag277-428 and S100A8-GFP for 48 h. Total cell lysates were immunoprecipitated with an anti-Flag antibody. The immunoprecipitation complex was detected with anti-GFP and anti-Flag antibodies. I Schematic diagram of S100A8-GFP and its truncation mutants. J 239T cells were co-transfected with S100A8-GFP, S100A8-GFP1-46, S100A8-GFP47-93 and RNF128-Flag for 48 h. Total cell lysates were immunoprecipitated with an anti-GFP antibody. The immunoprecipitation complex was detected by anti-GFP and anti-Flag antibodies.
Fig. 6
Fig. 6. RNF128 promotes the degradation of S100A8 by autophagy.
A Western blot analysis of S100A8 expression in THP-1 cells stably overexpressing RNF128-Flag treated with or without LPS (200 ng/ml) for 8 h. B Western blot analysis of S100A8 expression in stable RNF128-knockout THP-1 cells treated with or without LPS (200 ng/ml) for 8 h. C THP-1 cells were co-transfected with S100A8-GFP and increasing concentrations of RNF128-Flag for 48 h. The expression of S100A8-GFP was analyzed by western blot. D THP-1 cells stably overexpressing RNF128-Flag were transfected with GFP-S100A8 and incubated with CHX for the indicated time. The expression of S100A8-GFP was analyzed by western blot. E Rnf128+/+ and Rnf128−/− BMDMs were stimulated with LPS (200 µg/ml) for 8 h and subsequently treated with cycloheximide (100 µg/mL) for the indicated time. The expression of S100a8 was detected by western blot. F THP-1 cells stably overexpressing RNF128-Flag were transfected with S100A8-GFP and treated with MG132, CQ, 3-MA, or NH4Cl. The expression of S100A8-GFP was analyzed via western blot. G THP-1 cells stably overexpressing RNF128 were treated with CQ (50 mM) for 4 h. The expression of S100A8 was detected by western blot. H THP-1 cells stably overexpressing RNF128 were treated with wortmannin (WM, 10 μM) for 12 h. The expression of S100A8 was detected by western blot. I THP-1 cells with stable ATG7 knockout or control cells were transfected with RNF128-Flag for 48 h. The expression of S100A8 was measured by western blot. J THP-1 cells with stable ATG5 knockout or control cells were transfected with RNF128-Flag for 48 h. The expression of S100A8 was measured by western blot.
Fig. 7
Fig. 7. RNF128 promotes Tollip-mediated selective autophagic degradation of S100A8.
A Representative TEM images of Rnf128+/+ and Rnf128–/– BMDMs treated with or without EBSS for 2 h. The blue arrows indicate autophagic structures. Scale bars = 2 µm. B The number of autophagosomes per cell in (A) was quantified. The data are shown as mean ± SD. Five cells were counted. **P < 0.01. C Western blot analysis of LC3 and Sqstm1/p62 protein levels in BMDMs from Rnf128+/+ and Rnf128–/– mice stimulated with LPS (200 µg/ml) for 8 h. D Rnf128+/+ and Rnf128–/– BMDMs were transfected with GFP-LC3B for 48 h. GFP-LC3B distribution was observed by confocal microscopy. Scale bar, 5 μm. E The number of autophagosomes per cell in (D) was quantified. Data shown as mean ± SD. Ten cells were counted. Statistical data are presented as mean ± SD. **P < 0.01. F Rnf128+/+ and Rnf128–/– BMDMs were transfected with GFP-mCherry-LC3B for 48 h. GFP-mCherry-LC3B distribution was observed via confocal microscopy. Scale bar, 5 μm. G The numbers of autophagosomes and autolysosomes per cell in (F) were quantified. The data are shown as mean ± SD. Ten cells were counted. Statistical data are presented as mean ± SD. *P < 0.05; ***P < 0.001. H 293T cells were co-transfected with the indicated autophagy cargo receptors and S100A8-GFP for 48 h. Total cell lysates were immunoprecipitated with anti-Flag antibody. The immunoprecipitation complex was detected with anti-GFP and anti-Flag antibodies. I RNF128-Flag stably overexpressing or control THP-1 cells were treated with CQ (50 μM) for 4 h, and total cell lysates were immunoprecipitated with an anti-Tollip antibody. S100A8 and Tollip were detected by western blot. J THP-1 cells stably overexpressing RNF128 were transfected with Flag-Tollip and treated with CQ (50 μM) for 4 h. The co-localization of Flag-Tollip and S100A8 was observed by confocal microscopy. Representative confocal microscopy images were shown. Scale bars, 5 μm. K The colocalization Pearson correlation of Tollip-Flag and S100A8 in (J) was quantified. Statistical data are presented as mean ± SD. **P < 0.01. L Tollip stable knockout THP-1 or control cells were treated with EBSS for the indicated time, and the expression of S100A8 was detected by western blot.
Fig. 8
Fig. 8. Neutralizing antibodies to S100A8 attenuate DSS-induced colonic injury in Rnf128−/− mice.
A Rnf128+/+ (n = 5) and Rnf128−/− (n = 5) mice treated with 2.5% DSS were treated with an anti-S100A8 neutralizing antibody (200 μg, i.p.) on Days 0, 2, 4, and 6. Body weight of mice were measured daily. Statistical data are presented as mean ± SD. *P < 0.05; **P < 0.01; ***P < 0.001. B Representative images of colons from the mice in (A). Scale bars, 1 cm. C The colon length in (B) was measured and analyzed. *P < 0.05. D The survival of Rnf128+/+ (n = 10) and Rnf128−/− (n = 10) mice treated with 3% DSS and an anti-S100A8 neutralizing antibody. E Representative images of H&E-stained colon sections from the mice in (A). Scale bar: 500 μm. F Histopathology score in (E) was measured (n = 5). Statistical data are presented as mean ± SD. *P < 0.05; **P < 0.01. G Representative F4/80 staining images of colon sections from the mice in (A). Scale bars = 500 μm. H The F4/80 positive areas in (G) were measured and analyzed. Statistical data are presented as mean ± SD. *P < 0.05; **P < 0.01. I Representative images of Ki67 staining in cross-sections of distal colon tissues from the mice in (A). Scale bars = 500 μm. J Ki67 positive areas were measured and analyzed (n = 5). Statistical data are presented as mean ± SD. *P < 0.05; **P < 0.01. K, L ELISA analysis of IL-1β (I) and TNF-α (K) levels in the colon tissue from the mice in (A). Statistical data are presented as mean ± SD. *P < 0.05; **P < 0.01; ***P < 0.001.

Similar articles

References

    1. Neurath MF. Targeting immune cell circuits and trafficking in inflammatory bowel disease. Nat Immunol. 2019;20:970–9. - PubMed
    1. Adolph TE, Zhang J. Diet fuelling inflammatory bowel diseases: preclinical and clinical concepts. Gut. 2022;71:2574–86. - PMC - PubMed
    1. Wijnands AM, Penning de Vries BBL, Lutgens M, Bakhshi Z, Al Bakir I, Beaugerie L, et al. Dynamic prediction of advanced colorectal neoplasia in inflammatory bowel disease. Clin Gastroenterol Hepatol. 2024;22:1697–708. - PubMed
    1. Ma S, Zhang J, Liu H, Li S, Wang Q. The role of tissue-resident macrophages in the development and treatment of inflammatory bowel disease. Front Cell Dev Biol. 2022;10:896591. - PMC - PubMed
    1. Hou Q, Huang J, Ayansola H, Masatoshi H, Zhang B. Intestinal stem cells and immune cell relationships: potential therapeutic targets for inflammatory bowel diseases. Front Immunol. 2020;11:623691. - PMC - PubMed

MeSH terms

LinkOut - more resources