. 2025 Jan 14;16(1):18.
doi: 10.1038/s41419-025-07333-5.

Infiltrating peripheral monocyte TREM-1 mediates dopaminergic neuron injury in substantia nigra of Parkinson's disease model mice

Affiliations

Infiltrating peripheral monocyte TREM-1 mediates dopaminergic neuron injury in substantia nigra of Parkinson's disease model mice

Wei Song et al. Cell Death Dis. .

Abstract

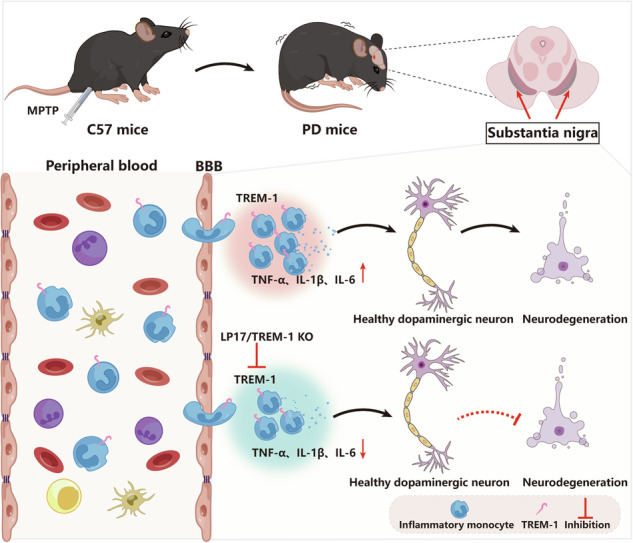
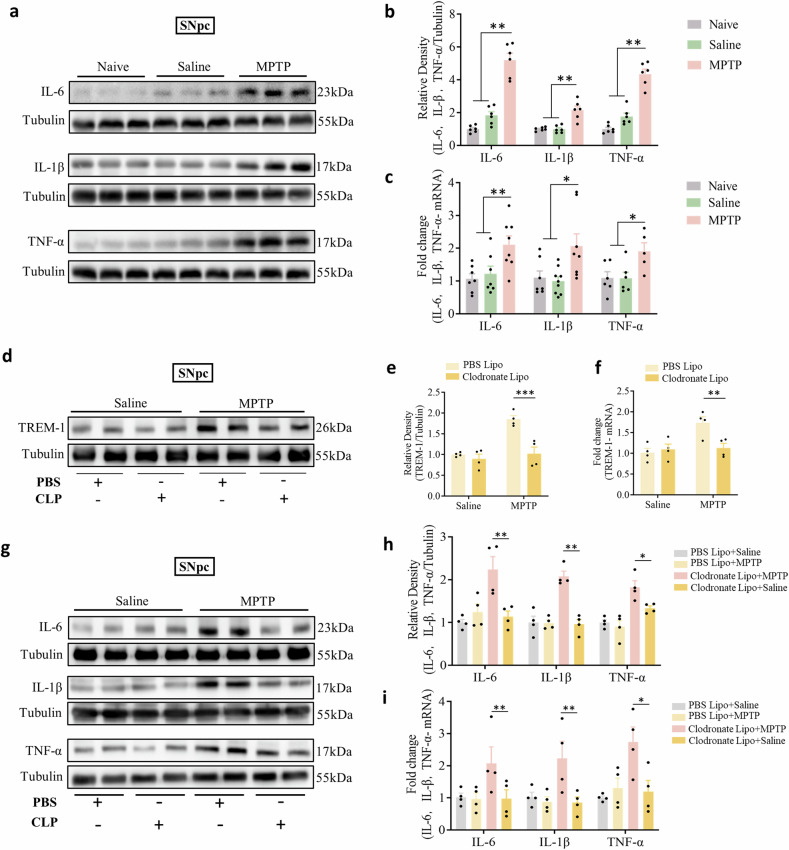
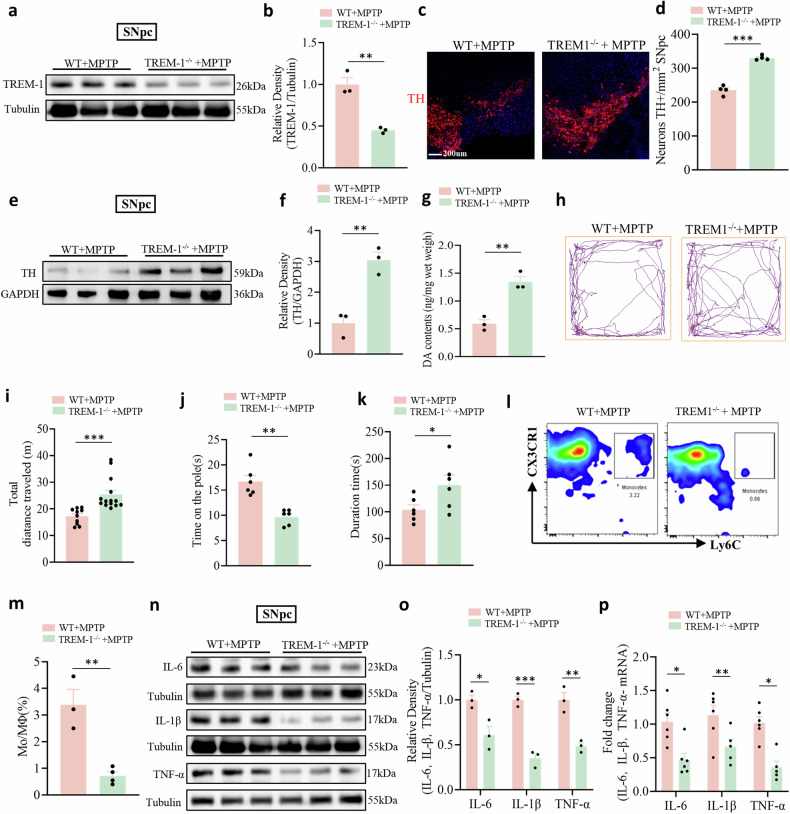
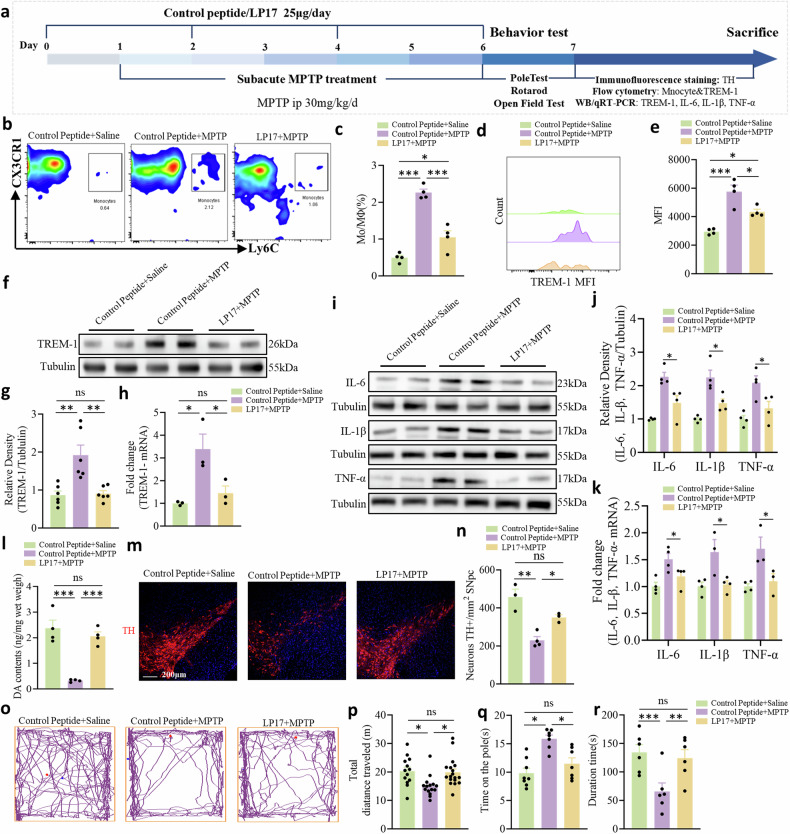
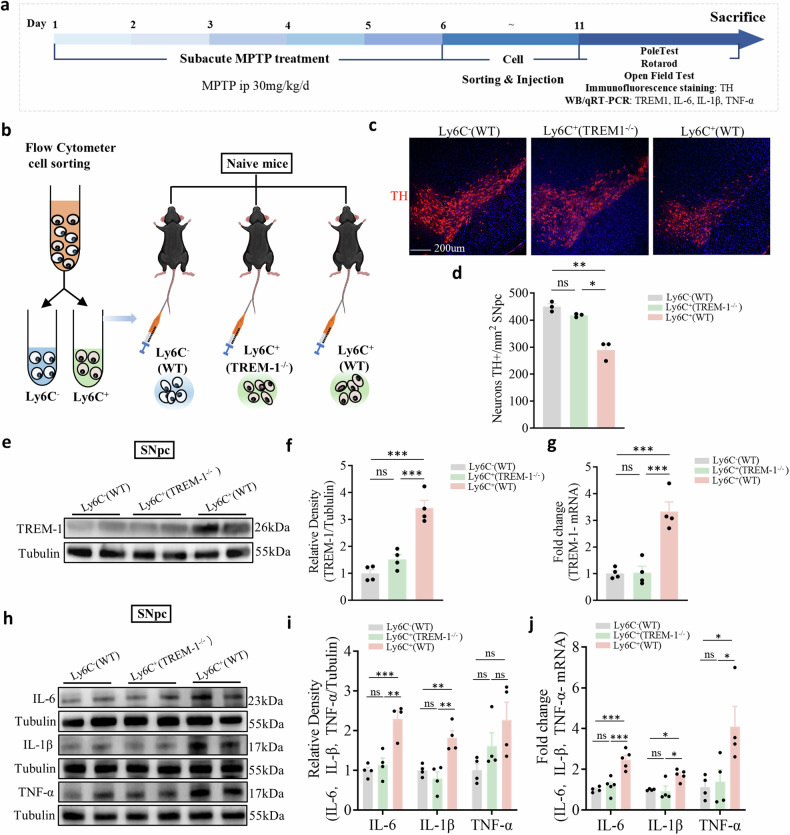
Neuroinflammation is a key factor in the pathogenesis of Parkinson's disease (PD). Activated microglia in the central nervous system (CNS) and infiltration of peripheral immune cells contribute to dopaminergic neuron loss. However, the role of peripheral immune responses, particularly triggering receptor expressed on myeloid cells-1 (TREM-1), in PD remains unclear. Using a 1-methyl-4-phenyl-1,2,3,6-tetrahydropyridine hydrochloride (MPTP)-induced PD mouse model, we examined TREM-1 expression and monocyte infiltration in the substantia nigra pars compacta (SNpc). We found that MPTP increased peripheral monocytes, and deletion of peripheral monocytes protected against MPTP neurotoxicity in the SNpc. TREM-1 inhibition, both genetically and pharmacologically, reduced monocyte infiltration, alleviated neuroinflammation, and preserved dopaminergic neurons, resulting in improved motor function. Furthermore, adoptive transfer of TREM-1-expressing monocytes from PD model mice to naive mice induced neuronal damage and motor deficits. These results underscore the critical role of peripheral monocytes and TREM-1 in PD progression, suggesting that targeting TREM-1 could be a promising therapeutic approach to prevent dopaminergic neurodegeneration and motor dysfunction in PD. Schematic diagram of monocyte TREM-1-mediated dopaminergic neuron damage. The figure illustrates that in experimental MPTP-induced PD model mice, the number of inflammatory monocytes in the peripheral blood increases, after which the monocytes infiltrate the CNS through the Blood-Brain Barrier(BBB). These infiltrating monocytes increase the release of inflammatory cytokines and eventually cause neuronal injury. TREM-1 gene deletion and pharmacological blockade limit inflammatory monocyte recruitment into the SNpc and ameliorate neuroinflammatory events and the loss of dopaminergic neurons.


Conflict of interest statement

Competing interests: The authors declare no competing interests. Consent for publication: All the authors read and approved the publication of this manuscript. Ethics approval and consent to participate: Animal protocols were approved by the Institutional Animal Care and Use Committee of Xuzhou Medical University.

Figures

None
Schematic diagram of monocyte TREM-1-mediated dopaminergic neuron damage. The figure illustrates that in experimental MPTP-induced PD model mice, the number of inflammatory monocytes in the peripheral blood increases, after which the monocytes infiltrate the CNS through the Blood-Brain Barrier(BBB). These infiltrating monocytes increase the release of inflammatory cytokines and eventually cause neuronal injury. TREM-1 gene deletion and pharmacological blockade limit inflammatory monocyte recruitment into the SNpc and ameliorate neuroinflammatory events and the loss of dopaminergic neurons.
Fig. 1
Fig. 1. MPTP administration caused dopaminergic neuron loss in the SNpc and motor dysfunction.
a Time course of MPTP administration and behavior tests in mice. b, c Global view of the substantia nigra in a C57BL/6 J mouse. d, e Representative images of immunofluorescence staining of TH and quantification of TH+ dopaminergic neurons in the SNpc. Scale bars: 200 μm for the top row and 100 μm for the bottom row. (n = 9 sections/3 mice per group). f Western blot analysis of TH in the SNpc of naive mice and mice treated with saline or MPTP (n = 4). g MPTP injection significantly decreased striatal dopamine content as measured by HPLC (n = 4). h Movement paths in OFT in different experimental groups. i Total distance moved in the OFT (n = 8–11). j Latency to fall off the rod on the rotarod (n = 6). k Latency to descend in the pole (n = 8). The data are presented as the mean ± SEM. (*P < 0.05, **P < 0.01, or ***P < 0.001 by one-way ANOVA).
Fig. 2
Fig. 2. Mo/MΦs infiltrated the SNpc of PD model mice.
a Mo/MΦs infiltration in the SNpc was demonstrated by staining for Hexb and Iba1; infiltrating Mo/MΦs are Iba1+/Hexb cells, and microglia are Iba1+/Hexb+ cells. Scale bars: 200 µm for the overview (left) and 100 µm for the detail (right). b Plots showing Mo/MΦs in the SNpc. c Percentages of Mo/MΦs detected in the SNpc by flow cytometry. d Plots showing Ly6Chi monocytes in peripheral blood. e Percentages of Ly6Chi monocytes detected in peripheral blood by flow cytometry. f Schematic representation of the CLP intervention therapy. Mice were intravenously injected with PBS liposomes (200 µL) or CLP (200 µL) three times 2 days apart. g Plots showing Ly6Chi monocytes in peripheral blood. h Percentages of LY6Chi monocytes detected in peripheral blood by flow cytometry (n = 3–5). i Movement paths in OFT in different experimental groups. j Total distance moved in the OFT (n = 11–15). k Latency to fall off the rod in the rotarod test (n = 6–8). l Latency to descend in the pole (n = 6–7). m, n Representative photographs of immunofluorescent staining of TH and quantification of the total number of TH+ dopaminergic neurons in the SNpc (n = 9–12 sections/3–4 mice per group). Scale bars: 200 µm for the overview. The data are presented as mean ± SEM. (*P < 0.05, **P < 0.01, or ***P < 0.001 by two-way ANOVA).
Fig. 3
Fig. 3. The expression of TREM-1 is upregulated in PD model mice.
a The plasma level of sTREM-1 was significantly increased (n = 5). b, c Representative histograms of monocyte TREM-1 expression and the monocyte TREM-1 MFI in the SNpc. d, e Western blot analysis of TREM-1 in the SNpc of naive mice and mice treated with saline or MPTP (n = 6). f The expression level of TREM-1 in the SNpc was analyzed via qRT-PCR (n = 6). The data are presented as the mean ± SEM. (*P < 0.05, **P < 0.01, or ***P < 0.001 by one-way ANOVA).
Fig. 4
Fig. 4. Monocyte depletion decreases TREM-1 levels in the SNpc and neuroinflammation.
a, b Western blot analysis of IL-6, IL-1β, and TNF-α in the SNpc of naive mice and mice treated with saline or MPTP (n = 6). c The expression levels of IL-6, IL-1β, and TNF-α in the SNpc were analyzed via qRT-PCR (n = 6–8). d, e Western blot analysis of TREM-1 in the SNpc of MPTP-injected mice that underwent CLP or PBS (n = 6). f The expression level of TREM-1 in the SNpc was analyzed via qRT-PCR after monocyte depletion (n = 4). g, h Western blot analysis of IL-6, IL-1β, and TNF-α in the SNpc of MPTP-injected mice that underwent CLP or PBS (n = 4). i The expression levels of IL-6, IL-1β, and TNF-α in the SNpc were analyzed via qRT-PCR after the depletion of monocytes (n = 4). The data are presented as the mean ± SEM. (*P < 0.05, **P < 0.01, or ***P < 0.001 by one-way ANOVA and two-way ANOVA).
Fig. 5
Fig. 5. Changes induced by TREM-1 deficiency in PD model mice.
a, b Western blot analysis of TREM-1 in the SNpc of WT and TREM-1-deficient mice treated with MPTP (n = 3). c, d Quantification of the total number of TH+ cells in the SNpc (n = 12 sections/4 mice per group). Scale bars: 200 µm for the overview. e, f Western blot analysis of TH in the SNpc of WT and TREM-1-deficient mice treated with MPTP (n = 3). g TREM-1 gene knockout significantly increased the striatal dopamine concentration, as measured by HPLC (n = 3). h Movement paths in OFT in different experimental groups. i Total distance moved in the OFT (n = 11–14). j Latency to descend in the pole (n = 6). k Latency to fall off the rod in the rotarod test (n = 6). l Plots showing Mo/MΦs in the SNpc. m Percentages of Mo/MΦs detected in the SNpc by flow cytometry (n = 4). n, o Western blot analysis of IL-6, IL-1β, and TNF-α in the SNpc of WT and TREM-1-deficient mice treated with MPTP (n = 3). p The expression levels of IL-6, IL-1β, and TNF-α in the SNpc were analyzed via qRT-PCR (n = 6). The data are presented as the mean ± SEM. (*P < 0.05, **P < 0.01, or ***P < 0.001 by Student’s t test).
Fig. 6
Fig. 6. The TREM-1 decoy peptide LP17 reduces neuroinflammation and dopaminergic neuron injury.
a Schematic representation of LP17 intervention therapy. Mice were intranasally administered four intraperitoneal injections of LP17/control peptide at 2-day intervals. b Plots showing Mo/MΦs in the SNpc. c Percentages of Mo/MΦs detected in the SNpc by flow cytometry (n = 4). d Representative histograms of TREM-1 expression on Mo/MΦs. e The MFI of Mo/MΦs TREM-1 in the SNpc (n = 4–5). f, g Western blot analysis of TREM-1 in the SNpc of MPTP-injected mice treated with LP17 or control peptide compared with control mice (n = 3). h The expression levels of TREM-1 in the SNpc were analyzed via qRT-PCR (n = 3). i, j Western blot analysis of IL-6, IL-1β, and TNF-α in the SNpc of MPTP-injected mice treated with LP17 or control peptide compared with control mice (n = 4). k The expression levels of IL-6, IL-1β, and TNF-α in the SNpc were analyzed via qRT-PCR (n = 3–4). l Pharmacological inhibition of TREM-1 significantly increased the striatal dopamine concentration, as measured by HPLC (n = 4). m, n Representative photographs of immunofluorescent staining of TH and quantification of the total number of TH+ dopaminergic neurons in the SNpc (n = 9–12 sections/3, 4 mice per group). Scale bars: 200 µm for the overview. o Movement paths in OFT in different experimental groups. p Total distance moved in the OFT (n = 12–16). q Latency to descend in the pole (n = 9–10). r Latency to fall off the rod in the rotarod test (n = 7–8). The data are presented as the mean ± SEM. (*P < 0.05, **P < 0.01, or ***P < 0.001 by one-way ANOVA).
Fig. 7
Fig. 7. Administration of TREM-1-producing monocytes sorted from PD model mice induces dopaminergic neuron injury and neuroinflammation in naive mice.
a Experimental design. b Ly6C+ cells were collected from the peripheral blood of WT or Trem-1−/− donor mice 24 h after MPTP injection and sorted based on the surface expression of Ly6C. Naive mice were injected with 3 × 106 Ly6C+ or Ly6C cells on Day 11. c, d Quantification of the total number of TH+ dopaminergic neurons in the SNpc (n = 9 sections/3 mice per group). Scale bars: 200 µm for the overview. e, f Western blot analysis of TREM-1 in the SNpc of recipient mice that were injected with Ly6C+ or Ly6C cells from WT MPTP-injected mice or Trem-1−/− MPTP-injected mice (n = 4). g Expression levels of TREM-1 in the SNpc determined by qRT-PCR (n = 4). h, i Western blot analysis for IL-6, IL-1β, and TNF-α in the SNpc of recipient mice that were injected with Ly6C+ or Ly6C cells from WT MPTP-injected mice or Trem-1−/− MPTP-injected mice (n = 4). j The expression levels of IL-6, IL-1β, and TNF-α in the SNpc were analyzed via qRT-PCR (n = 4). The data are presented as the mean ± SEM. (*P < 0.05, **P < 0.01, or ***P < 0.001 by one-way ANOVA).

Similar articles

References

    1. Poewe W, Seppi K, Tanner CM, Halliday GM, Brundin P, Volkmann J, et al. Parkinson disease. Nat Rev Dis Prim. 2017;3:17013. - PubMed
    1. Pradhan S, Andreasson K. Commentary: progressive inflammation as a contributing factor to early development of Parkinson’s disease. Exp Neurol. 2013;241:148–55. - PubMed
    1. Glass CK, Saijo K, Winner B, Marchetto MC, Gage FH. Mechanisms underlying inflammation in neurodegeneration. Cell. 2010;140:918–34. - PMC - PubMed
    1. McKim DB, Niraula A, Tarr AJ, Wohleb ES, Sheridan JF, Godbout JP. Neuroinflammatory dynamics underlie memory impairments after repeated social defeat. J Neurosci. 2016;36:2590–604. - PMC - PubMed
    1. Chen H, O’Reilly EJ, Schwarzschild MA, Ascherio A. Peripheral inflammatory biomarkers and risk of Parkinson’s disease. Am J Epidemiol. 2008;167:90–95. - PubMed

MeSH terms

Substances