. 2025 Jan 15;16(1):673.
doi: 10.1038/s41467-025-55932-9.

A diagnostic host-specific transcriptome response for Mycoplasma pneumoniae pneumonia to guide pediatric patient treatment

Affiliations

A diagnostic host-specific transcriptome response for Mycoplasma pneumoniae pneumonia to guide pediatric patient treatment

Sandra Viz-Lasheras et al. Nat Commun. .

Abstract

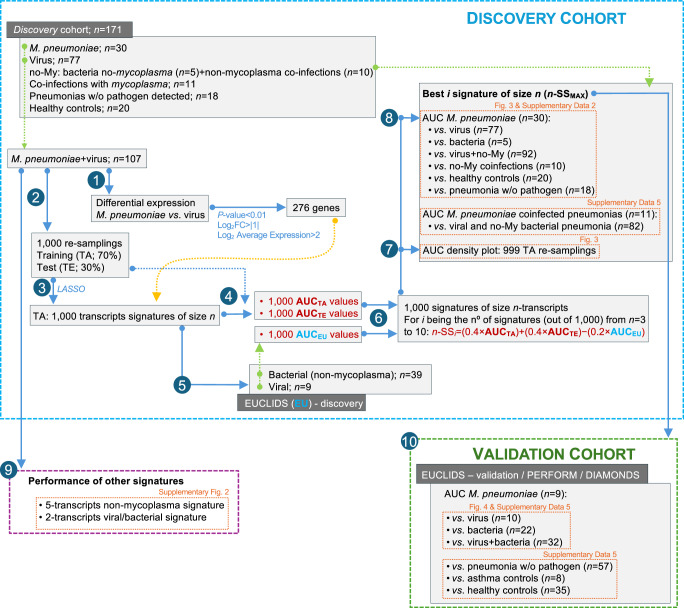
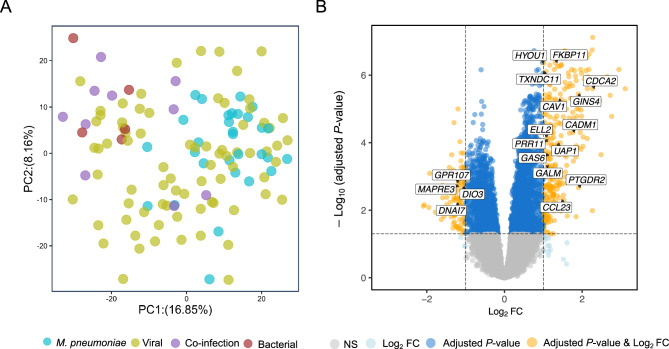
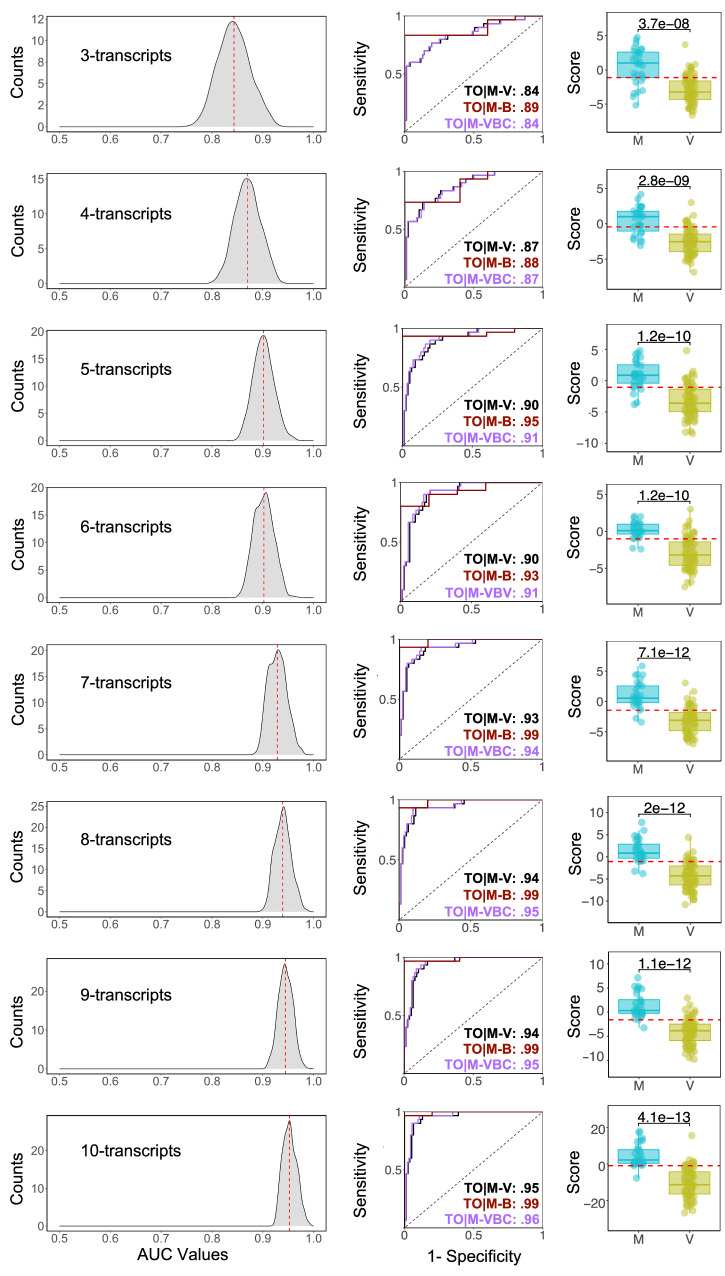
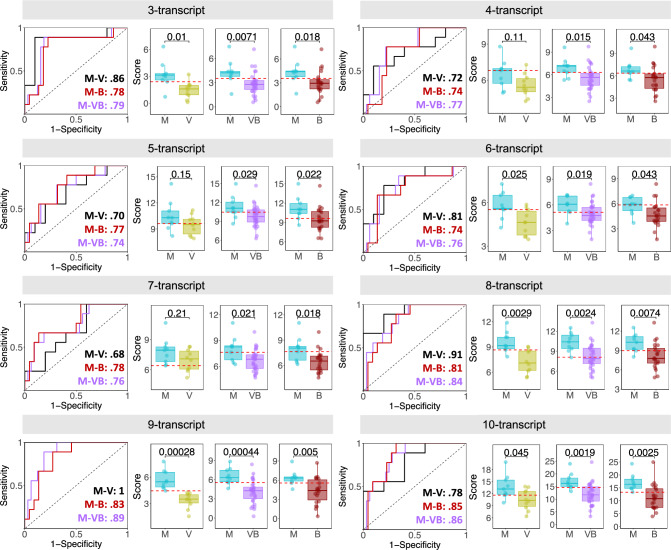
Mycoplasma pneumoniae causes atypical pneumonia in children and young adults. Its lack of a cell wall makes it resistant to beta-lactams, which are the first-line treatment for typical pneumonia. Current diagnostic tests are time-consuming and have low specificity, leading clinicians to administer empirical antibiotics. Using a LASSO regression simulation approach and blood microarray data from 107 children with pneumonia (including 30 M. pneumoniae) we identify eight different transcriptomic signatures, ranging from 3-10 transcripts, that differentiate mycoplasma pneumonia from other bacterial/viral pneumonias with high accuracy (AUC: 0.84-0.95). Additionally, we demonstrate that existing signatures for broadly distinguishing viral/bacterial infections and viral/bacterial pneumonias are ineffective in distinguishing M. pneumoniae from viral pneumonia. The new signatures are successfully validated in an independent RNAseq cohort of children with pneumonia, demonstrating their robustness. The high sensibility of these signatures presents a valuable opportunity to guide the treatment and management of M. pneumoniae pneumonia patients.


Conflict of interest statement

Competing interests: The authors declare no competing interests.

Figures

Fig. 1
Fig. 1. Overall study design.
Differential expression was investigated between M. pneumoniae and virus datasets from17 (step 1). We employed a re-sampling approach (step 2) to generate 1000 transcript signatures of size n (step 3). These signatures were utilized to compute 1000 AUC values on both the training (TA) and test (TE) datasets (step 4), as well as on the non-mycoplasma bacteria and virus datasets from the EUCLIDS (discovery) cohort (step 4 and 5). Next, Signature Scores (SS) were obtained for the different n-transcript signatures (from n = 3 to 10) based on AUCTA, AUCTE, and AUCEU values (step 6), allowing to derive the best signature of size n (step 7); n-SSMAX. AUC values were then computed with the best n-transcript signatures for the comparison between M. pneumoniae vs. virus and M. pneumoniae vs. virus + other pathogens from ref. (step 8). For comparative purposes, we also assessed the performance of other available signatures in the literature (step 9). Finally, the best signatures were subsequently validated in the EUCLIDS (validation cohort), DIAMONDS, and PERFORM cohorts (step 10).
Fig. 2
Fig. 2. PCA of transcriptomic profiles of different pneumonia cohorts and differential expression analysis.
A PCA of transcriptome profiles from blood samples of viral, M. pneumoniae, co-infections or other bacteria pneumonia infections. The two first principal components (PC1 and PC2) are shown. B Volcano plot showing the DEGs between conditions: M. pneumoniae pneumonia vs. viral pneumonia. The statistical test used to obtain P-values was a two-sided moderated t-test implemented in the limma package. Adjustments for multiple comparisons were performed using the Benjamini-Hochberg procedure to control the false discovery rate (FDR). The plot shows the log2 fold change (Log2FC) on the x-axis and the -log10 adjusted P-value on the y-axis. Genes with an adjusted P-value < 0.05 and a log2FC > |1| were colored in orange, genes with an adjusted P-value < 0.05 but a log2FC < |1| were colored in dark blue, genes with an adjusted P-value > 0.05 but a log2FC > |1| were colored in light blue and non-significant genes with log2 FC < |1| were colored in grey. Only genes included in the final signatures were labeled in the graphic.
Fig. 3
Fig. 3. Transcriptomic signatures obtained from the discovery cohort.
AUCs and ROC curves from the density plots (left panels) of the AUC values computed on the 999 training resamples and using the optimal n-transcript signature; red dashed vertical lines in the left panels indicate the median values. ROC curves and AUC values (central panels) for the total cohort of i) M. pneumoniae (n = 30) vs. viral pneumonia (n = 77) (black line; AUCTO|M-V), ii) M. pneumoniae pneumonias (n = 30) vs. Bacterial pneumonias (n = 5) (red line; AUCTO|M-B) and iii) M. pneumoniae pneumonias (n = 30) vs. all non-mycoplasma pneumonia infections (including, virus, non-mycoplasma bacteria, and non-mycoplasma co-infections; n = 92) (violet line; AUCTO|M-VBC). Boxplots of the predicted values using each optimal model in the total cohort with two-sided Wilcoxon rank-sum test P-values (right panels). Red dashed line represents the optimal cutpoint. The boxes are defined by the upper and lower quartile (Q1 and Q3); the median is shown as a bold-colored horizontal line; whiskers extend to the most extreme data point which is no more than 1.5 times the interquartile range (IQR) from the box. VBC all non-mycoplasma pneumonias (including, virus, non-mycoplasma bacteria, and non-mycoplasma co-infections), B bacterial, M M. pneumoniae, TO total sample, V viral.
Fig. 4
Fig. 4. Validation of the transcriptomic signatures.
ROC curves with AUC values for the three tested validation subsets: M. pneumoniae (n = 9) vs. viral pneumonias (n = 10) (black line; AUCM-V), M. pneumoniae (n = 9) vs. non-mycoplasma pneumonias including viral and other bacterial pneumonias (n = 32) (violet line; AUCM-VB) and M. pneumoniae vs. non-mycoplasma bacterial pneumonias (n = 22) (red line; AUCM-B) (left panels). Boxplots of the predicted values using each model in the three validation subsets (right panels). Two-sided Wilcoxon P-values are also displayed. The red dashed line represents the optimal cut off. The boxes represent the distribution of scores for M. pneumoniae, viral and bacterial pneumonia samples. They are defined by the upper and lower quartiles (Q1 and Q3), with the median displayed as a bold-colored horizontal line. The whiskers extend to the most extreme data points within 1.5 times the interquartile range (IQR) from the box. Abbreviations as in legend of Fig. 3. VB all non-mycoplasma pneumonias including viral and other bacterial pneumonias, B bacterial, M M. pneumoniae, V viral.
Fig. 5
Fig. 5. Differential pathways analysis.
A Volcano plot showing the genes in DRPs between conditions: M. pneumoniae pneumonia (n = 30) vs. viral pneumonia (n = 77). The statistical test used to obtain P-values was a two-sided moderated t-test implemented in the limma package. Adjustments for multiple comparisons were performed using the Benjamini-Hochberg procedure to control the false discovery rate (FDR). The plot shows the log2 fold change (Log2FC) on the x-axis and the -log10 adjusted P-value on the y-axis. Pathways meeting the criteria of an adjusted P-value < 0.05 and a log2FC > |0.1| were colored in yellow, pathways with an adjusted P-value < 0.05 but a log2FC < |0.1| were colored in dark blue, genes with an adjusted P-value > 0.05 but a log2FC > |0.1| were colored in light blue and non-significant genes were colored in grey. B Boxplots representing the pathway activity of the DRPs for the M. pneumoniae (n = 30) and viral pneumonia (n = 77) groups in which genes from the transcriptomic signatures are involved (left panel). Two-sided Wilcoxon rank-sum test P-values are displayed. The boxes are defined by the upper and lower quartiles (Q1 and Q3), with the median displayed as a bold-colored horizontal line. The whiskers extend to the most extreme data points within 1.5 times the interquartile range (IQR) from the box. Bubble plot of the DRPs in which genes included in the transcriptomic signatures are involved (right panel). Numeric identifies indicate DRPs in which genes from the transcriptomic signatures are involved. The statistical test used to obtain P-values was a two-sided moderated t-test implemented in the limma package. Adjustments for multiple comparisons were performed using the Benjamini-Hochberg procedure to control the false discovery rate (FDR). Size of the points is proportional to the -log10 adjusted P-value and color bar indicates the log2FC values.

Similar articles

References

    1. Larcher, R., Boudet, A., Roger, C., Villa, F. & Loubet, P. Mycoplasma pneumoniae is back! Is it the next pandemic? Anaesth Crit Care. Pain. Med.43, 101338 (2024). - PubMed
    1. Meyer Sauteur, P. M. et al. Mycoplasma pneumoniae detections before and during the COVID-19 pandemic: results of a global survey, 2017 to 2021. Euro Surveill.27, 2100746 (2022). - PMC - PubMed
    1. Meyer Sauteur, P. M. et al. Mycoplasma pneumoniae: delayed re-emergence after COVID-19 pandemic restrictions. Lancet Microbe5, e100–e101 (2024). - PubMed
    1. Urbieta, A. D. et al. Mycoplasma pneumoniae at the rise not only in China: rapid increase of Mycoplasma pneumoniae cases also in Spain. Emerg. Microbes Infect.13, 2332680 (2024). - PMC - PubMed
    1. Nordholm, A. C. et al. Mycoplasma pneumoniae epidemic in Denmark, October to December, 2023. Euro Surveill.29, 2300707 (2024). - PMC - PubMed

Substances