. 2025 Jan 14;16(1):647.
doi: 10.1038/s41467-025-55967-y.

The small GTPase MRAS is a broken switch

Affiliations

The small GTPase MRAS is a broken switch

Gabriela Bernal Astrain et al. Nat Commun. .

Abstract

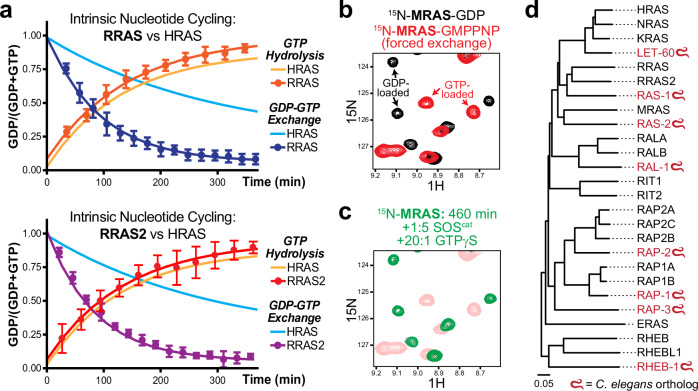
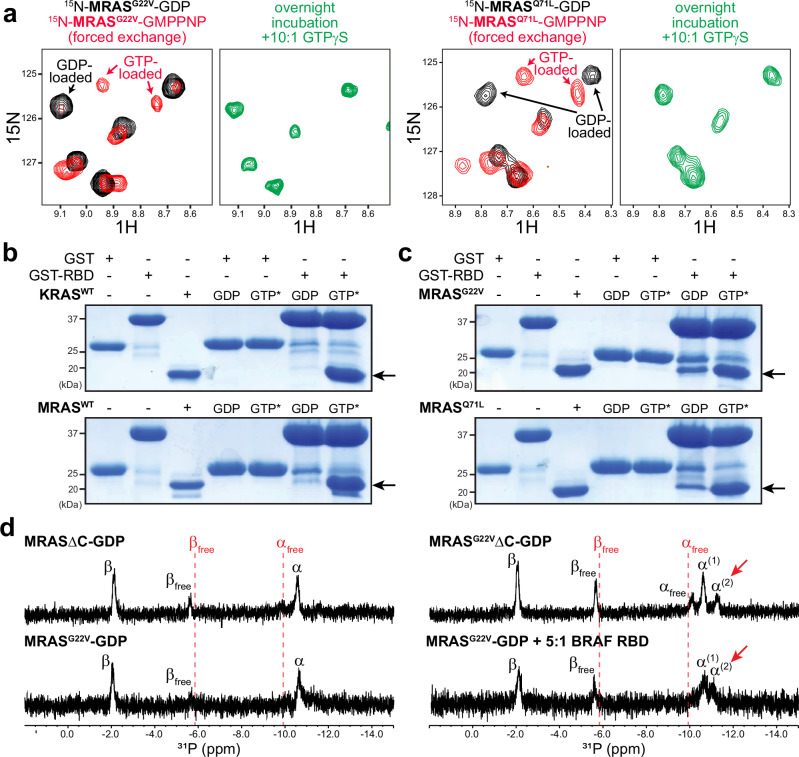
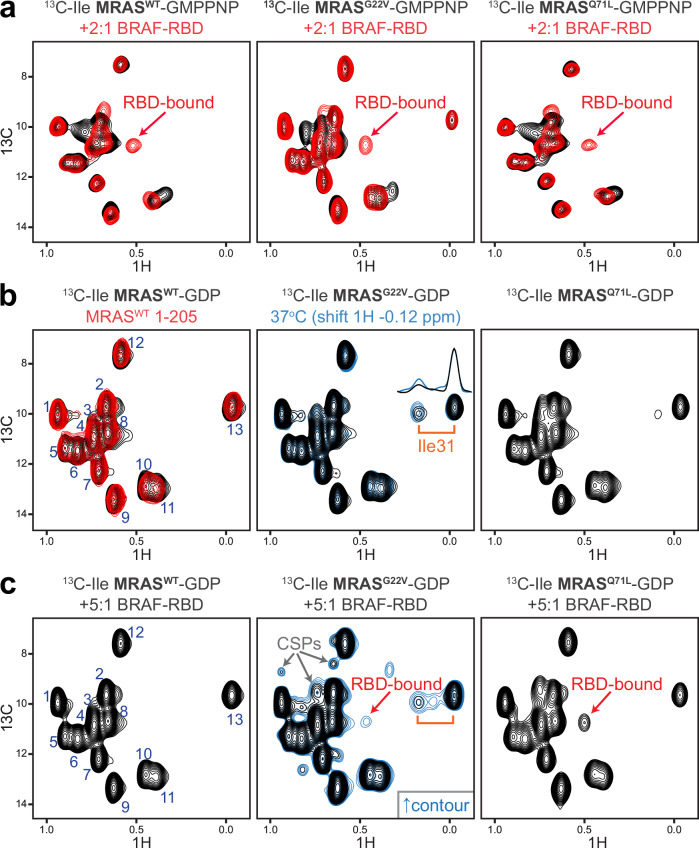
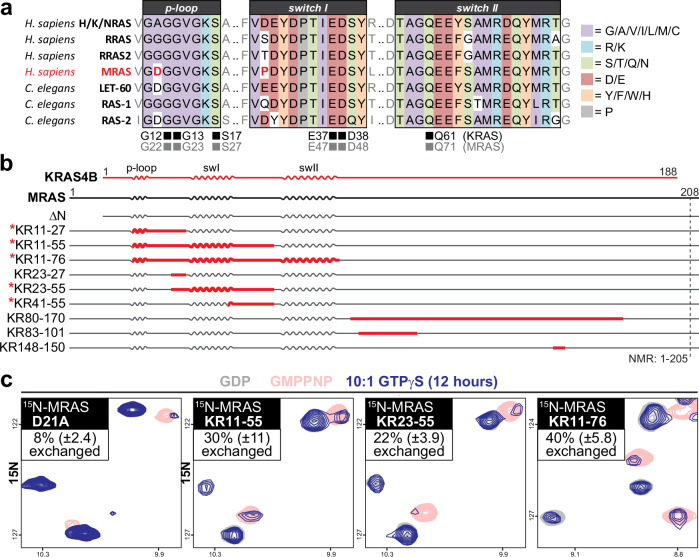
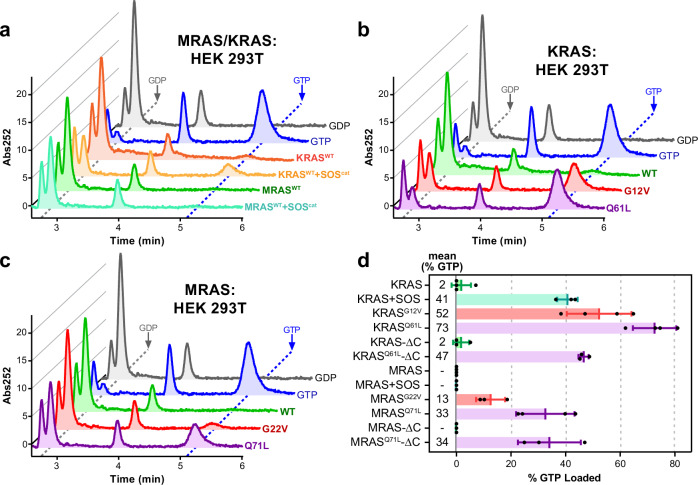
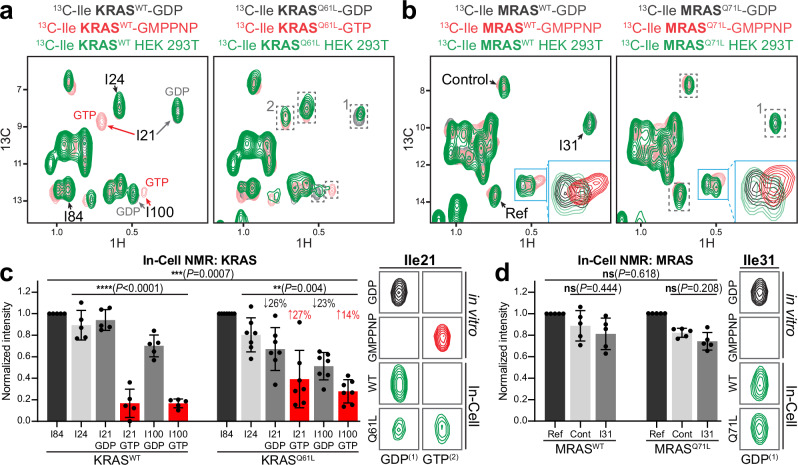
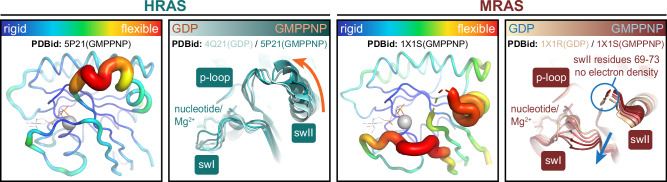
Intense research on founding members of the RAS superfamily has defined our understanding of these critical signalling proteins, leading to the premise that small GTPases function as molecular switches dependent on differential nucleotide loading. The closest homologs of H/K/NRAS are the three-member RRAS family, and interest in the MRAS GTPase as a regulator of MAPK activity has recently intensified. We show here that MRAS does not function as a classical switch and is unable to exchange GDP-to-GTP in solution or when tethered to a lipid bilayer. The exchange defect is unaffected by inclusion of the GEF SOS1 and is conserved in a distal ortholog from nematodes. Synthetic activating mutations widely used to study the function of MRAS in a presumed GTP-loaded state do not increase exchange, but instead drive effector binding due to sampling of an activated conformation in the GDP-loaded state. This includes nucleation of the SHOC2-PP1Cα holophosphatase complex. Acquisition of NMR spectra from isotopically labeled MRAS in live cells validated the GTPase remains fully GDP-loaded, even a supposed activated mutant. These data show that RAS GTPases, including those most similar to KRAS, have disparate biochemical activities and challenge current dogma on MRAS, suggesting previous data may need reinterpretation.


Conflict of interest statement

Competing interests: The authors declare no competing interests.

Figures

Fig. 1
Fig. 1. MRAS does not intrinsically exchange GDP for GTPγS in vitro.
a Intrinsic nucleotide exchange and hydrolysis curves for HRAS (Kexch=3.4 ± 0.1 × 10–3 (light blue) and Khydro = 7.5 ± 0.1 × 10–3 (yellow)), RRAS (top panel, Kexch = 10.7 ± 0.3 × 10–3 (dark blue) and Khydro = 6.8 ± 0.2 × 10–3 (orange)), and RRAS2 (bottom panel, Kexch = 8.2 ± 0.7 × 10–3 (purple) and Khydro = 7.4 ± 0.3 × 10–3 (red)). Curves were obtained using changes across multiple peak intensities extracted from sequential 1H/15N HSQC spectra of isotopically labeled GTPases. Plotted are mean ± standard deviation. n = 3 experiments were performed independently with similar results. GTPases were incubated in a tenfold molar excess of GTPγS to measure exchange. For hydrolysis, GTPases were preloaded with GTP and incubated in the magnet at 25 °C. b NMR spectra show distinct chemical shifts specific to GDP or GMPPNP-bound MRAS. Overlay is of 1H/15N HSQC spectra from force-loaded MRAS-GDP (black) and MRAS-GMPPNP (red). c MRAS shows no change in nucleotide binding after the addition of 20:1 excess GTPγS and 1:5 molar ratio of the catalytic subunit from its alleged GEF, SOS1 (SOScat). Green spectrum is from 15N-MRAS incubated with GTPγS/SOScat for 460 min. d Phylogenetic tree of human RAS GTPase subfamilies with orthologs from C. elegans (red). Source data are provided as a Source Data file.
Fig. 2
Fig. 2. Mutationally ‘activated’ MRAS is also defective in GDP-to-GTPγS exchange yet binds the RAF RBD when GDP-loaded.
a Mutants used to study MRAS in a constitutively active state show no intrinsic exchange. Overlays of 1H/15N HSQC spectra of MRASG22V (left) and MRASQ71L (right) bound to GDP (black) or GMPPNP (red) show resonances specific to each nucleotide-bound state. HSQC spectra after overnight incubation with 10:1 molar excess GTPγS are in green. b Interaction between the BRAF RBD and both KRASWT (top) and MRASWT (bottom) is nucleotide dependent. In vitro binding assays mixed 2 μM recombinantly purified, GST-BRAF-RBD or GST alone control with 25 μM purified RAS GTPases. Complexes were precipitated on glutathione beads followed by washing to remove non-specific binders. Arrows indicate where precipitated GTPases should appear. KRAS and MRAS were pre-loaded with the nucleotides indicated at top (GTP* refers to the analog GMPPNP). n = 3 experiments were performed independently with similar results. c MRASG22V (top) and MRASQ71L (bottom) bind the BRAF RBD when either GTP* or GDP-loaded. MRAS mutants were pre-loaded with the nucleotides indicated at top (GTP* refers to GMPPNP). n = 3 experiments were performed independently with similar results. d 1D 31P-NMR spectra reveal MRASG22V samples two conformations when GDP bound. Spectra include GDP-loaded MRASWTΔC, MRASG22VΔC, MRASG22V and MRASG22V incubated with a 5:1 molar excess BRAF RBD. α and β labels represent the α- and β-phosphate resonances. (1) and (2) represent state 1 and state 2 conformations of the GTPase, and ‘free’ is unbound nucleotide. Spectra were recorded using 1 mM purified proteins. Source data are provided as a Source Data file.
Fig. 3
Fig. 3. MRASG22V and MRASQ71L adopt an RBD-binding conformation when GDP bound.
a The RBD of BRAF binds MRAS variants force loaded with GMPPNP. 13C-Ileδ1 MRAS wild-type (left), G22V (middle) or Q71L (right) were incubated in a twofold molar excess of unlabeled RBD domain. SOFAST-HMQCs revealed a consistent chemical shift reporting on the bound state for each variant (middle of red spectra, marked with arrows). b SOFAST-HMQCs of wild-type (left), G22V (middle) and Q71L (right) 13C-Ileδ1 MRAS bound to GDP. All 13 Ile are detected for both full length (1-205) and ΔC (1-181) MRAS (blue numbering). An additional resonance, presumably a split of Ile31, is present in the G22V spectrum and to a lesser extent Q71L. Intensity of this peak increases at 37˚C (blue, G22V; inset is 1D projections). c A fivefold molar excess of BRAF RBD added to 13C-Ileδ1 wild-type MRAS (left) does not induce chemical shift changes and all 13 Ile are detected (blue numbering). RBD binding is observed with MRASG22V-GDP through multiple chemical shift perturbations (CSPs; arrows, gray). RBD binding to MRASQ71L-GDP is revealed by a characteristic peak also observed with GMPPNP-bound protein (red, arrow). This peak is visible when RBD is added to G22V but is less intense (requiring a higher contour level (blue), arrow).
Fig. 4
Fig. 4. MRASQ71L nucleates formation of the SHOC2-MRAS-PP1Cα (SMP) complex when GDP bound.
a Traces (UV 280 nm) from size exclusion chromatography (SEC) of complexes formed by MRASWT-GDP (black) or MRASWT-GMPPNP (red) with purified SHOC2 and PP1Cα. Coomassie stained SDS-PAGE gels of the corresponding fractions are below. Two fractions from the most intense SHOC2 peaks (within dashed lines) are shown to the right with higher contrast. n = 3 experiments were performed independently with similar results. b UV traces following SEC of complexes formed by MRASQ71L-GDP (black) or MRASQ71L-GMPPNP (red) with purified SHOC2 and PP1Cα. Coomassie stained gels of the corresponding fractions are below. Two fractions from the most intense SHOC2 peaks (dashed lines) are shown at right with increased contrast. n = 3 experiments were performed independently with similar results. c Nucleation of the SMP complex by MRASWT is significantly enhanced by GMPPNP-loading. In vitro pull-down assays mixed 12 μM each of recombinantly purified PP1Cα and MRASWT with GFP-SHOC2 purified from HEK 293T cells on NHS-beads conjugated with anti-GFP nanobodies. The GTPase was preloaded with the nucleotides indicated in legend. n = 3 experiments were performed independently, used to calculate the relative amounts of PP1Cα/MRASWT precipitated by SHOC2 at right by densitometry. Plotted are mean ± standard deviation. d MRASQ71L can nucleate SMP complex formation independent of its nucleotide loaded state. In vitro pull-down assays mixed 12 μM each of purified PP1Cα and MRASQ71L with GFP-SHOC2 on beads. The GTPase was preloaded with the indicated nucleotides. n = 3 experiments were performed independently, used to calculate the relative amounts of PP1Cα/MRASQ71L precipitated by SHOC2 at right. Plotted are mean ± standard deviation. Statistical comparison between GDP and GMPPNP complex nucleation was performed using a 1-way ANOVA. Source data are provided as a Source Data file.
Fig. 5
Fig. 5. The MRAS GDP-to-GTP exchange defect is complex and only substantial amino acid substitutions rescue activity.
a Sequence alignment of human RAS proteins with C. elegans orthologs covering the p-loop, switch 1 and switch 2 regions. Key residues from H/K/NRAS studies including frequent sites of oncogenic mutation are at bottom (human numbering). b Schematic representation of substitutions made in MRAS-KRAS chimeras. KRAS regions are denoted in red and MRAS in black, naming of chimeras includes amino acid numbers of KRAS used in the substitution. Red asterisks denote chimeric constructs that showed any GDP-to-GTPγS exchange. c Overlay of 1H/15N HSQC spectra from three MRAS-KRAS chimeric constructs and the point mutant MRASD21A. Spectra from 15N-MRAS variants preloaded with GDP (gray) or GMPPNP (pink) are in the background with an HSQC taken 12 h after incubation with 10:1 molar excess GTPγS on top (blue). Multiple peak intensities were used to determine % exchanged (GTPγS loaded).
Fig. 6
Fig. 6. HPLC-based identification of nucleotides bound to overexpressed GTPases purified from cultured cells.
a Representative chromatographs measuring UV absorbance at 252 nm for guanine nucleotides extracted from Venus-tagged RAS proteins alone or co-expressed with a membrane tethered FLAG-SOScat-CaaX GEF protein (HEK 293T cells). Included are wild-type MRAS and KRAS. Proteins were purified on NHS-beads conjugated with anti-GFP nanobodies and samples heated to 95°C. Bound nucleotides were detected by IP-RP-HPLC with GDP (gray) and GTP (blue) at 5 μM serving as standards. n = 3 experiments were performed independently. b Representative chromatographs for guanine nucleotides extracted from Venus-tagged KRASWT, KRASG12V and KRASQ61L expressed in HEK 293T cells. GDP (gray) and GTP (blue) at 5 μM are standards. n = 3 experiments were performed independently. c Chromatographs of guanine nucleotides extracted from Venus-tagged MRASWT, MRASG22V and MRASQ71L expressed in HEK 293T. GDP (gray) and GTP (blue) are standards. n = 3 experiments were performed independently. d Relative amounts of guanine nucleotides extracted from Venus-tagged proteins purified from HEK 293T cells. GDP/GTP ratios were quantified from areas under the GDP- and GTP-specific curves detected by IP-RP-HPLC. Data represented are the mean and standard deviation from n=3 independent experiments. Source data are provided as a Source Data file.
Fig. 7
Fig. 7. In-Cell NMR reveals MRASWT and MRASQ71L remain GDP bound in cells, in contrast to KRASQ61L which becomes GTP loaded.
a Overlay of 1H/13C SOFAST-HMQC spectra from 13C-Ileδ1-KRASWT (left) and KRASQ61L (right). Spectra from KRAS prebound to GDP (black) or GMPPNP/GTP (red) in buffer are in the background, and in HEK 293T cells seven hours after electroporation on top (green). Ile21 and Ile100 serve as reporting peaks for nucleotide-bound status and are emphasized with red and gray arrows for GTP and GDP, respectively, on KRASWT spectra and boxed on KRASQ61L spectra. Ile84 served as a normalization peak to permit comparisons over multiple experiments. b Overlay of spectra from 13C-Ileδ1-MRASWT (left) and MRASQ71L (right) preloaded with GDP (black) or GMPPNP (red) in solution, or in HEK 293T cells seven hours after electroporation (green). Presumed MRAS Ile31 (corresponding with KRAS Ile21) is marked. Broadening of Ile31 informs on GDP/GTP loading, as does the line shape of peaks within the blue square (zoomed, inset). ‘REF’ peak was for normalization between biological replicates. c Quantitation of GDP- and GTP-bound fractions of KRASWT and KRASQ61L in cells. Ile84 was used for normalization. Ile24 is also unchanged by nucleotides and is a control. Data are mean and standard deviation from n = 3 independent experiments. Statistical comparison between wild-type and mutant used a 2-way ANOVA (P = 0.0007) with a 1-way ANOVA for in-group comparisons (wild-type P < 0.0001 and Q61L P = 0.004). At right are resonances observed at Ile21 GDP- and GTP chemical shifts (marked with a 1 and 2 on spectra in a). d Quantitation of peak intensity for MRASWT (left) and MRASQ71L (right) in HEK 293T cells. Loss of the GDP-specific peak reports on GTP loading. ‘REF’ is stable independent of nucleotide and was used for normalization. Control peak is also unchanging. Data are mean and standard deviation from at least n = 3 independent experiments. Statistical analysis between wild-type and mutant used a 2-way ANOVA (P = 0.618) and in-group comparisons used t tests (wild-type P = 0.444 and Q71L P = 0.208). At right are resonances at the Ile31 (GDP) chemical shift (marked with a 1 on spectra in b). Source data are provided as a Source Data file.
Fig. 8
Fig. 8. Nucleotide-driven structural conversions in KRAS versus MRAS.
Structural comparison of GDP- and GMPPNP-loaded HRAS (left panels) and MRAS (right panels), focusing on flexibility of the p-loop, switch 1 and switch 2 regions. Putty representations for HRAS-GMPPNP (PDBid: 5P21) and MRAS-GMPPNP (PDBid: 1X1S) are colored by crystallography B-factors (blue=rigid to red=flexible). Ribbons diagrams are overlays of GDP- and GMPPMP-bound proteins with three simulated steps to represent motion. MRAS switch 2 residues 69-73 have no electron density.

References

    1. Prior, I. A., Hood, F. E. & Hartley, J. L. The frequency of ras mutations in cancer. Cancer Res.80, 2669–2974 (2020). - PMC - PubMed
    1. Colicelli, J. Human RAS superfamily proteins and related GTPases. Sci. STKE2004, RE13 (2004). - PMC - PubMed
    1. Goh, L. L. & Manser, E. The GTPase-deficient Rnd proteins are stabilized by their effectors. J. Biol. Chem.287, 31311–31320 (2012). - PMC - PubMed
    1. Fueller, F. & Kubatzky, K. F. The small GTPase RhoH is an atypical regulator of haematopoietic cells. Cell Commun. Signal.6, 6 (2008). - PMC - PubMed
    1. Ji, W. & Rivero, F. Atypical Rho GTPases of the RhoBTB subfamily: Roles in vesicle trafficking and tumorigenesis. Cells5, 28 (2016). - PMC - PubMed

MeSH terms

LinkOut - more resources