. 2025 Jan 14;16(1):649.
doi: 10.1038/s41467-024-55420-6.

Enabling next-generation engineered TCR-T therapies based on high-throughput TCR discovery from diagnostic tumor biopsies

Affiliations

Enabling next-generation engineered TCR-T therapies based on high-throughput TCR discovery from diagnostic tumor biopsies

Thomas Kuilman et al. Nat Commun. .

Abstract

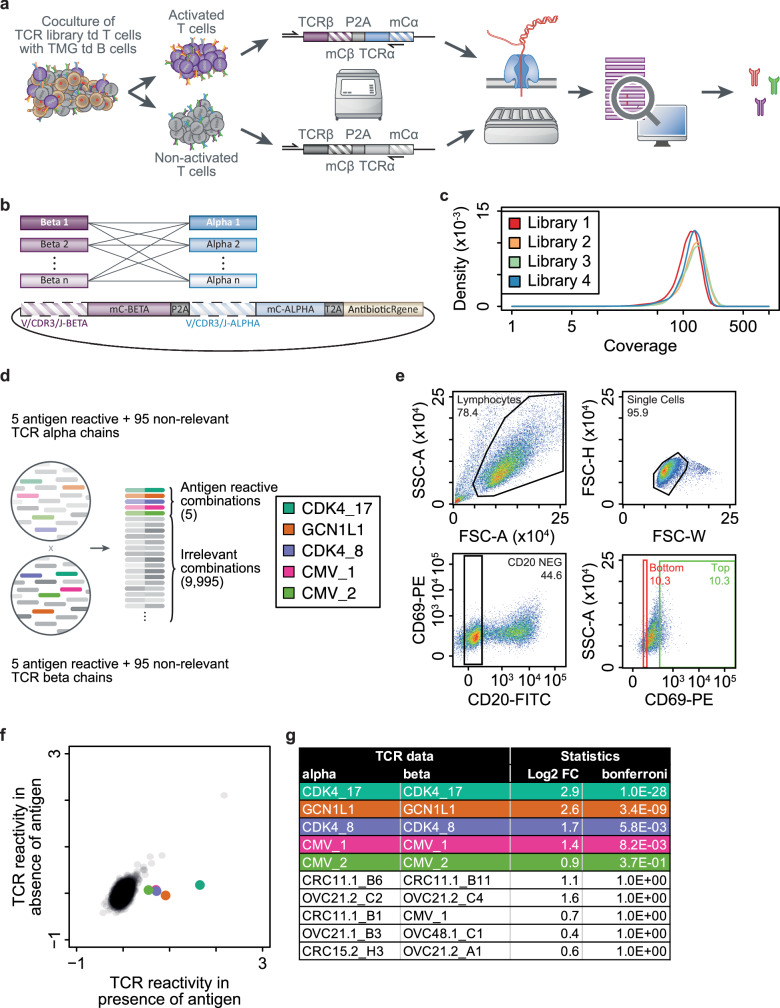
Adoptive cell therapy with tumor-infiltrating lymphocytes (TIL) can mediate tumor regression, including complete and durable responses, in a range of solid cancers, most notably in melanoma. However, its wider application and efficacy has been restricted by the limited accessibility, proliferative capacity and effector function of tumor-specific TIL. Here, we develop a platform for the efficient identification of tumor-specific TCR genes from diagnostic tumor biopsies, including core-needle biopsies frozen in a non-viable format, to enable engineered T cell therapy. Using a genetic screening approach that detects antigen-reactive TCRs with high sensitivity and specificity based on T cell activation, we show that high complexity TCR libraries can be efficiently screened against multiplexed antigen libraries to identify both HLA class I and II restricted TCRs. Through the identification of neoantigen-specific TCRs directly from melanoma as well as low tumor mutational burden microsatellite-stable colorectal carcinoma samples, we demonstrate the pan-cancer potential of this platform.


Conflict of interest statement

Competing interests: T.K., D.S.S., J.G., R.G., R.M.S., L.B., J.W., H.K., D.H., M.V., Y.B.C., M.Saornil., O.K., B.S., H.D., A.G., A.C.M., B.W., M.L., C.G.E., M.Sabatino., J.v.d.B., J.W.J.v.H., G.M.B., and C.L. are salaried employees and stock option holders of Neogene Therapeutics. K.Y.T is a compensated consultant for Verrica Pharmaceuticals and NFlection Therapeutics (also with ownership interest), and receives research support from Incyte Corporation. J.J.M. is Associate Center Director at Moffitt Cancer Center, has ownership interest in Aleta Biotherapeutics, CG Oncology, Turnstone Biologics, Ankyra Therapeutics, and AffyImmune Therapeutics, and is a paid consultant/paid advisory board member for ONCoPEP, CG Oncology, Mersana Therapeutics, Turnstone Biologics, Vault Pharma, Ankyra Therapeutics, AffyImmune Therapeutics, UbiVac, Vycellix, and Aleta Biotherapeutics. V.K.S. is a compensated consultant for Alkermes, Bristol Myers Squibb, Genesis Drug Discovery & Development, Iovance, Merck, Mural Oncology, and Novartis, and receives research funding from SkylineDX and Turnstone, in addition to Neogene Therapeutics. I.J. is involved in projects supported by research agreements between the NKI and Neogene Therapeutics, Asher Biotherapeutics and Sastra Cell Therapy. J.H, is a member of the Neogene Therapeutics Scientific Advisory Board and is a stock option holder of Neogene Therapeutics. He is also advisor for Achilles Therapeutics, BioNTech, Instil Bio, PokeAcell, Scenic Biotech, T-Knife and Third Rock Ventures. T.N.S. is co-founder of Neogene Therapeutics; is advisor for Allogene Therapeutics, Asher Bio, Celsius, Merus, Neogene Therapeutics, and Scenic Biotech; is a stockholder in Allogene Therapeutics, Asher Bio, Cell Control, Celsius, Merus, Neogene Therapeutics and Scenic Biotech; and is venture partner at Third Rock Ventures. The remaining authors declare no competing interests. The Netherlands Cancer Institute has entered into a clinical trial collaboration with Neogene Therapeutics. The TCR library screening technology is described in patents WO2021011482A1 and US2021040558A1 (pending) with inventors C.L., T.N.S., D.S.S., T.K., J.W.J.v.H. G.M.B., R.G. and J.G. and the B cell immortalization technology is described in patent US20220228164A1 (pending) with inventors T.N.S, C.L., T.K., G.M.B., J.G., J.W.J.v.H., R.G., D.S.S., J.W. and L.B.; all patents are assigned to Neogene Therapeutics B.V.

Figures

Fig. 1
Fig. 1. A functional genetic screen outperforms an immunological approach to antigen-specific TCR identification.
a Schematic of a functional genetic screening approach to identify neoantigen specific TCRs within a TCR library. Targeted sequencing of tumor material (step 1) enables identification of intratumoral TCR sequences and tumor neoantigens, which can be used to create TCR libraries and neoantigen libraries (step 2). In a functional genetic screening approach, the TCR library is screened to identify neoantigen-specific TCRs (step 3). From these TCRs, a selection can be made for manufacturing of a fully individualized T cell product (step 4). b An immunological screen was performed to test whether low-frequency neoantigen-specific T cells may be identified. Jurkat reporter T cells expressing defined antigen-specific TCRs (CDK4_17 and CDK4_8) at frequencies of 1:10-1:10,000 were cocultured with EBV-immortalized B cells loaded with a non-cognate (Irrelevant) or a cognate CDK4 peptide. Reporter T cells were analyzed by staining for the CD69 T cell activation marker and by FACS analysis. Data for defined antigen-specific TCRs at 1:1000 dilution are displayed. c, FACS sorting strategy for a functional genetic screen to identify antigen-specific TCRs. Cells expressing the TCRs from (b) were mixed at frequencies ranging from 1:10,000-1:1,000,000 into a population of cells expressing 24 non-relevant TCRs. A FACS plot is shown indicating ~10% top (activated T cells; green sorting gate) and ~10% bottom sorting gates (non-activated T cells; red sorting gate) based on CD69 expression on reporter T cells after a coculture with tandem minigene (TMG) expressing B cells encoding all cognate antigens as described in (b). d Enrichment of antigen-specific TCRs in a functional genetic screening approach. Genomic DNA was isolated from the samples in (c) and retroviral TCR inserts were recovered and quantified using PCR and Illumina-based sequencing. The bar graph shows the fold enrichment of individual TCRs in the activated T cell relative to the non-activated T cell sample. For each TCR, the frequency in the original pool of T cells is represented in the legend. Source data are provided as a Source Data file.
Fig. 2
Fig. 2. Optimized immortalization and antigen presentation in autologous B cells.
a Antigen presentation capability of B cells for an HLA-I TCR. Reporter T cells expressing the NY-ESO-1 1G4 HLA-I TCR were cocultured with BCL-6/BCL-xL immortalized B cells expressing indicated antigen encoding constructs. TMGx indicates the tandem expression of x MGs, where x was 3, 12 or 40. +LAMP1 indicates fusion of LAMP1 signaling, transmembrane and cytoplasmic domains to the MG or TMG coding sequence. CD40L support was provided either by CD40L-expressing L cell feeder layer (‘L cells’) or by CD40L expression in immortalized B cells (‘+CD40L’). Expression of the T cell activation marker CD69 on reporter T cells was measured by flow cytometry. The dotted line indicates the percentage of TCR+ reporter T cells used in the coculture. Bars represent the average value of two biological biological replicates and grey dots represent individual replicate values. b As in a, but for reporter T cells expressing the NY-ESO-1 5B8 HLA-II TCR. Source data are provided as a Source Data file.
Fig. 3
Fig. 3. Sensitivity and specificity of combinatorial TCR library screen.
a Schematic of a functional genetic screening approach to identify antigen-specific TCRs. A TCR library is expressed in T cells and cocultured with TMG-expressing B cells. Cells are subsequently sorted into activated and non-activated T cells. TCR inserts are retrieved from both samples by PCR, and comparative analysis using next-generation sequencing is used to identify candidate TCRs recognizing an antigen encoded by one of the expressed TMGs. td: transduced. b Schematic of a combinatorial TCR library cloning strategy. An assembly reaction using multiple TCRα and β chains is performed, in which assembled plasmids contain one TCRα chain linked with one TCRβ chain. c Density plot showing the frequency distribution of each combinatorial TCR identified within four TCR libraries each assembled from 100 TCRα and 100 β chains. d Schematic of the composition of a proof-of-concept combinatorial TCR library assembled using five TCRα and TCRβ chains of defined antigen specificity and 95 TCRα and β chains of undefined specificity. e An overnight 1:1 coculture of reporter T cells expressing the TCR library from d and EBV-immortalized B cells expressing the cognate antigens of the 5 defined antigen-specific TCRs in TMG format was performed and cells were stained and sorted. The gating strategy is indicated from top-left to bottom-right, and the red ‘non-activated’ and green ‘activated’ T cell sorting gates are represented. f TCR expression cassettes from samples in (e) were retrieved and quantified as described in (a). TCR reactivity in the absence and presence of exogenous antigen expression is represented. The 5 TCRs of defined antigen-specificity are colored according to the legend in (d). g Table representing statistical metrics from an enrichment analysis of the data in (f). Statistical testing was performed in a one-sided fashion, and a Bonferroni correction was applied to adjust p-values for multiple testing (see also Methods for a more detailed description). The top 10 candidate TCRs based on enrichment significance are represented, and candidate TCRs are colored according to the legend in (d). Source data are provided as a Source Data file.
Fig. 4
Fig. 4. Identification of neoantigen-specific TCRs in a melanoma sample.
a Jurkat reporter T cells expressing a positive control TCR CDK4-17 or a combination of all sub-libraries from Supplementary Fig. 4d, e were mixed and cocultured with B cell pools from Supplementary Fig. 4a. Cells were subsequently sorted using MACS to isolate CD62L+ non-activated and CD62L-,CD69+ activated reporter T cells from each coculture. TCRs were retrieved and quantified as in Fig. 3. Candidate TCRs were identified by differential expression analysis. Statistical testing was one-sided, and a Bonferroni correction was applied to p-values (see Methods for a detailed description). Colored dots represent the 10 TCRs that were most significantly enriched, and the larger red dot represents the positive control TCR CDK4-17. b Table representing statistical metrics, and analogous color coding, of the 10 most enriched TCR candidates identified in (a) and their TMG reactivity. c Reporter T cells were transduced with expression constructs encoding candidate TCRs and were cocultured with autologous B cells that were non-transduced or that were expressing the matched TMG identified in the TCR library screen in (a, b). T cell activation was assessed by CD69 expression on reporter T cells by FACS. Bars represent the average value of two biological replicates and red dots represent individual replicate values. d 25-Mer peptides representing the MGs that were encoded in TMGs recognized by candidate TCRs validated in (c) were electroporated into B cells, and these cells were cocultured with reporter T cells expressing the relevant candidate TCR. TCRs recognizing the same TMG are represented with dots in the same color. TMGs 15 and 41 contained MGs harboring frameshift mutations, and partially overlapping peptides were ordered to cover the entire MG sequence. The size of each dot represents the percentage of CD69 + TCR-expressing reporter T cells as measured by FACS. e Summary table of the number of validated TCRs, their mutation specificity and HLA class restriction are shown for the melanoma patient screen. f Transcript expression and variant allele frequencies of the validated neoantigens (red) in comparison to all mutations included in the screen (black). Source data are provided as a Source Data file.
Fig. 5
Fig. 5. Identification of neoantigen-specific TCRs in a diagnostic tumor biopsy of microsatellite-stable colorectal cancer.
a A combinatorial library assembled from the 199 most prevalent alpha and beta chains from CRC17, and including a positive control TCR CDK4−17, were expressed in reporter T cells, which were subsequently cocultured with B cell pools combinatorially encoding 11 TMGs expressing 135 neoepitopes. Cells were MACS-sorted as in Fig. 4a and candidate TCRs were identified as in Fig. 3. Statistical testing was one-sided, and a Bonferroni correction was applied to p-values (see Methods for a detailed description). The 10 most significantly enriched TCRs and the positive control TCR CDK4-17 are represented by colored dots and the larger red dot respectively. b Table representing statistical metrics, and analogous color coding, of the 10 TCR candidates identified in (a) and their TMG reactivity. ‘+’ refers to B cells that express a mutated CDK4 epitope, which can be recognized by the positive control TCR. c, Candidate TCR validation and characterization experiments for the alpha10xbeta11 TCR, where TCR-expressing reporter T cells were cocultured with B cells electroporated with 10 μM of one of the twelve 25 mer peptides encoded in TMG8. T cells cultured in the absence of B cells, (-), with B cells without the antigen (B cells), with a B cell pool expressing TMG8 without (TMG8) or with an antibody blocking HLA-class II presentation (II block) or with PMA/Ionomycin (P + I) were included as controls. T cell activation was assessed by CD69 expression detected by FACS. Red dots represent individual biological replicates and bars represent their average. d Summary graph of the data in c for all TCRs. Validation of reactivity of TCRs against B cell pools expressing their respective TMGs (left panel) and TCR reactivity against the deconvoluted 25-mer epitope (right panel) are shown with coloring by neoantigen specificity. Dashed lines indicate thresholds for further characterization (5 for TMG reactivity; 10 for peptide reactivity). e As in (d) but the ratio of TCR reactivities against B cell pools expressing the relevant TMGs without versus with HLA-class II block as in (c) are shown. f Example of peptide titration assays for the alpha10xbeta11 TCR with mutant (MT) and wildtype (WT) peptide 87. T cell activation was measured as in (c) as the average of two biological replicates for titrated amounts of electroporated 25-mer peptide. g Summary graph of the data in (f) for all TCRs that displayed peptide reactivity above threshold in (d). The area under the curve for MT and WT peptide titrations, the neoantigen specificity, and HLA-class restriction is represented for each TCR. Source data are provided as a Source Data file.

References

    1. Jacobson, C. A. et al. Axicabtagene ciloleucel in relapsed or refractory indolent non-Hodgkin lymphoma (ZUMA-5): a single-arm, multicentre, phase 2 trial. Lancet Oncol.23, 91–103 (2022). - PubMed
    1. Maude, S. L. et al. Tisagenlecleucel in children and young adults with B-cell lymphoblastic Leukemia. N. Engl. J. Med.378, 439–448 (2018). - PMC - PubMed
    1. Berdeja, J. G. et al. Ciltacabtagene autoleucel, a B-cell maturation antigen-directed chimeric antigen receptor T-cell therapy in patients with relapsed or refractory multiple myeloma (CARTITUDE-1): a phase 1b/2 open-label study. Lancet Lond. Engl.398, 314–324 (2021). - PubMed
    1. Rodriguez-Otero, P. et al. Ide-cel or standard regimens in relapsed and refractory multiple myeloma. N. Engl. J. Med.388, 1002–1014 (2023). - PubMed
    1. Patel, U. et al. CAR T cell therapy in solid tumors: a review of current clinical trials. Ejhaem3, 24–31 (2022). - PMC - PubMed

MeSH terms

Substances