. 2025 Jan 14;16(1):654.
doi: 10.1038/s41467-025-56013-7.

Multi-omics architecture of childhood obesity and metabolic dysfunction uncovers biological pathways and prenatal determinants

Affiliations

Multi-omics architecture of childhood obesity and metabolic dysfunction uncovers biological pathways and prenatal determinants

Nikos Stratakis et al. Nat Commun. .

Abstract

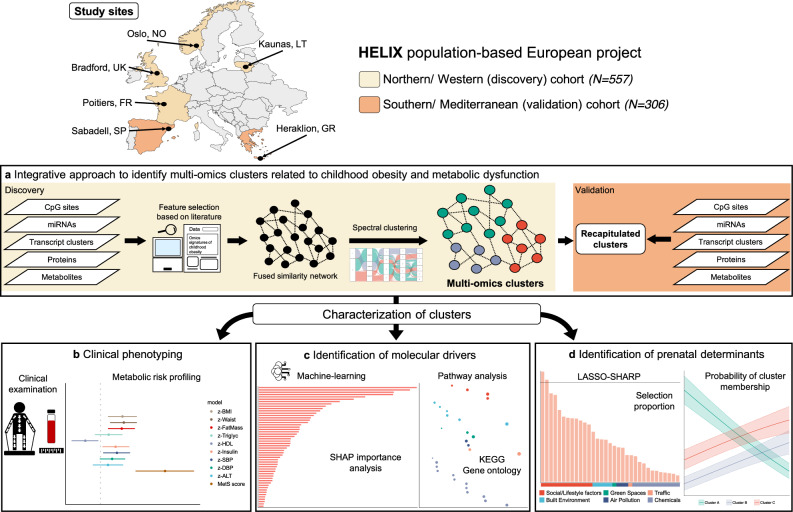
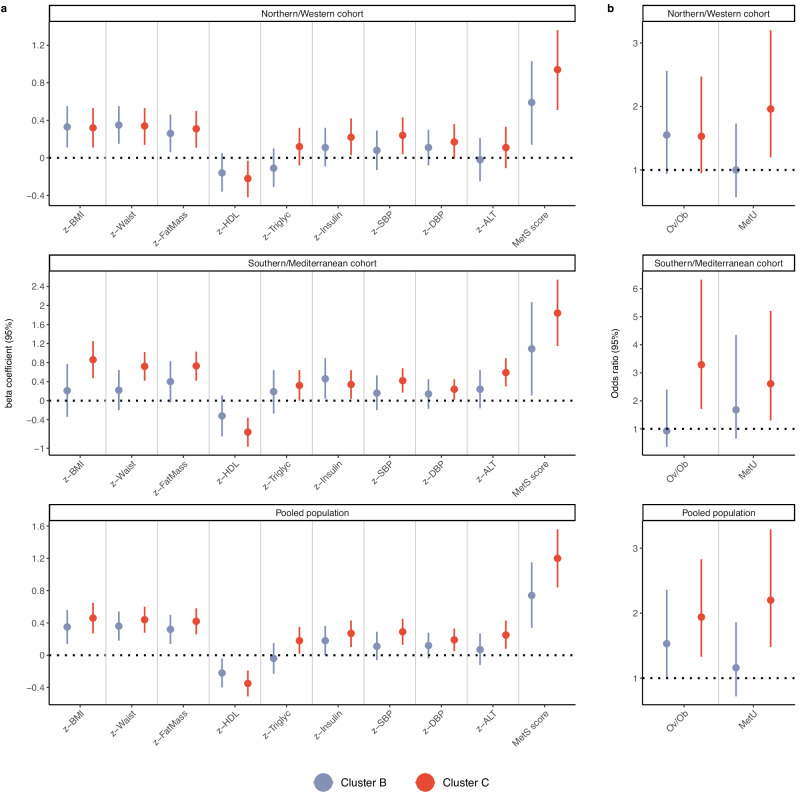
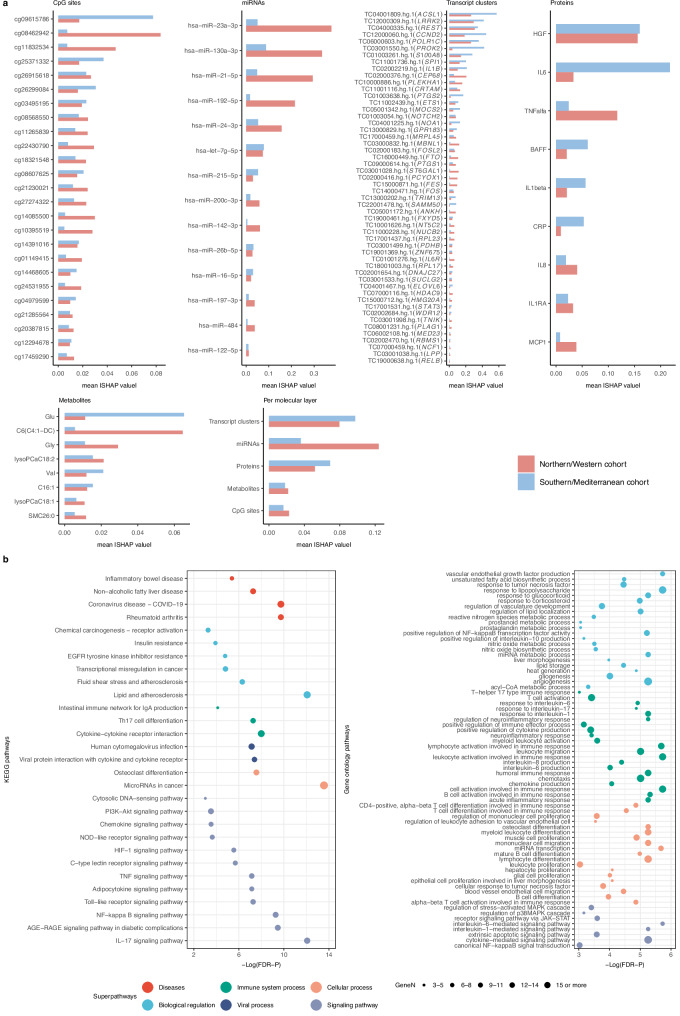
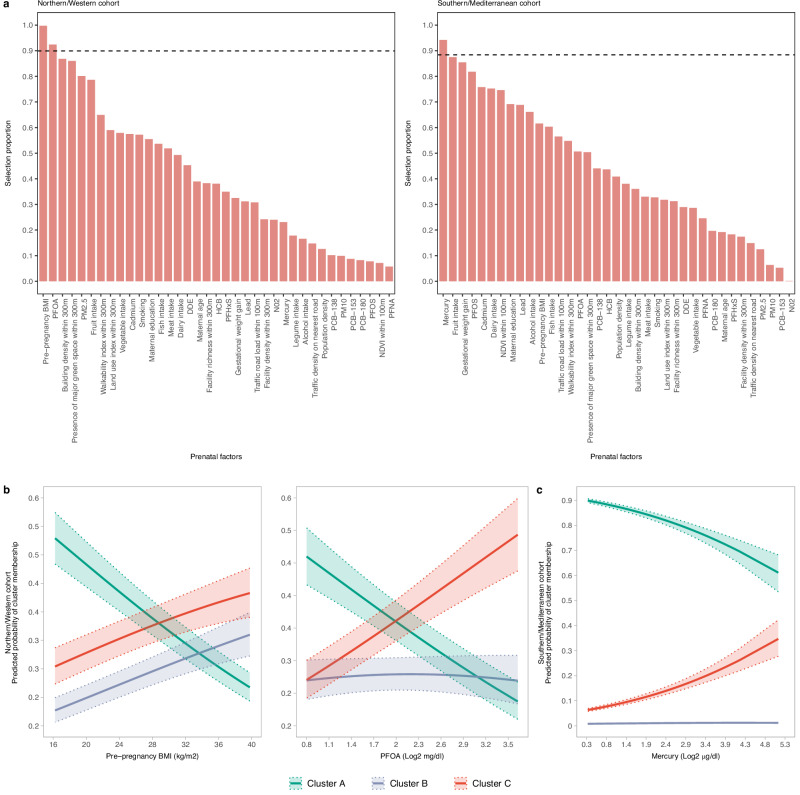
Childhood obesity poses a significant public health challenge, yet the molecular intricacies underlying its pathobiology remain elusive. Leveraging extensive multi-omics profiling (methylome, miRNome, transcriptome, proteins and metabolites) and a rich phenotypic characterization across two parts of Europe within the population-based Human Early Life Exposome project, we unravel the molecular landscape of childhood obesity and associated metabolic dysfunction. Our integrative analysis uncovers three clusters of children defined by specific multi-omics profiles, one of which characterized not only by higher adiposity but also by a high degree of metabolic complications. This high-risk cluster exhibits a complex interplay across many biological pathways, predominantly underscored by inflammation-related cascades. Further, by incorporating comprehensive information from the environmental risk-scape of the critical pregnancy period, we identify pre-pregnancy body mass index and environmental pollutants like perfluorooctanoate and mercury as important determinants of the high-risk cluster. Overall, our work helps to identify potential risk factors for prevention and intervention strategies early in the life course aimed at mitigating obesity and its long-term health consequences.


Conflict of interest statement

Competing interests: The authors declare no competing interests.

Figures

Fig. 1
Fig. 1. Analytic workflow of the study.
a We integrated multi-omics data, including DNA methylation, miRNAs, transcript clusters, proteins and metabolites, from childhood blood samples from the HELIX population-based project. We applied similarity network fusion and spectral clustering to derive distinct multi-omics clusters in children from the Northern/Western European part and recapitulated these clusters in children of the Southern/Mediterranean part. b Using generalized regression models, we examined the association of the multi-omics clusters with several metabolic outcomes to characterize the clinical phenotype of each cluster. c We applied machine learning methods to derive SHapley Additive exPlanation (SHAP) values in order to identify the molecular features with high importance in cluster definition and then performed pathway analysis to characterize underlying biological pathways. d We examined how the prenatal environment affects cluster membership. We applied Least Absolute Shrinkage Selection Operator (LASSO) with Stability-enHanced Approaches using Resampling Procedures (SHARP) to identify the most important determinants among several prenatal factors. We then estimated the probability of cluster membership across levels of the identified determinants.
Fig. 2
Fig. 2. Associations of the identified multi-omics clusters with metabolic health outcomes in childhood.
a Associations with continuous metabolic health outcomes. Effect estimates and their 95% CIs were derived from generalized linear regression models while controlling for study site, sex, and age at examination. Circles indicate beta coefficients (expressed in SD change) and whiskers indicate 95% CIs. The metabolic syndrome (MetS) score was derived using z-scores for waist circumference, HDL cholesterol level, triglyceride level, insulin level, and systolic and diastolic blood pressure. Cluster A was the reference category. ALT alanine aminotransferase, BMI body mass index, DBP diastolic blood pressure, HDL high-density lipoprotein cholesterol, SBP systolic blood pressure. b Associations with categorical metabolic health outcomes. Effect estimates and their 95% CIs were derived from logistic regression models while controlling for study site, sex, and age at examination. Circles indicate odds ratios and whiskers indicate 95% CIs. Given the asymmetrical nature of the odds ratio scale, odds ratios are not in the centre of the 95% CIs. Overweight/obesity (Ov/Ob) was defined according to the World Health Organization criteria. Metabolically unhealthy (MetU) status was defined as the presence of at least one of the following risk factors: systolic or diastolic blood pressure ≥90th percentile, insulin ≥90th percentile, HDL cholesterol ≤40 mg/dl, triglycerides ≥110 mg/dl, ALT ≥ 22.1 U/L for females and ≥25.8 U/L for males. Cluster A was the reference category. The number of participants in each multi-omics cluster across cohorts was as follows: N = 227 for Cluster A, N = 150 for Cluster B and N = 180 for Cluster C in the Northern/Western cohort, and N = 238 for Cluster A, N = 21 for Cluster B, and N = 47 for Cluster C in the Southern/Mediterranean cohort. Source data for all panels are provided as a Source Data file.
Fig. 3
Fig. 3. Molecular drivers of the high-risk Cluster C.
a Global importance of the features contributing to the definition of Cluster C. Mean absolute SHAP values were calculated based on a classifier comparing membership to Cluster C vs. membership to Cluster A or B. We present the top features, defined as those with mean SHAP values at concordant direction across cohorts and mean absolute SHAP values ranking within the top quartile in each cohort. b Integrated pathway analysis at the gene level of the top features contributing to the definition of Cluster C. Significance was tested using hypergeometric tests with a false discovery rate (FDR)-P value threshold of less than 0.05. Enriched pathways with more than or equal to three genes annotated to the top features are presented. The size of the dots is proportional to the number of genes (GeneN). KEGG Kyoto encyclopedia of genes and genomes. Source data for all panels are provided as a Source Data file.
Fig. 4
Fig. 4. Prenatal determinants of the multi-omics clusters.
a Selection proportion values of prenatal factors derived from Least Absolute Shrinkage Selection Operator (LASSO) penalized multinomial models using cluster membership as outcome and a stability enhanced approach employing resampling. Dashed lines represent the threshold in selection proportion for which each factor is stably selected or stably excluded. DDE 4,4′dichlorodiphenyl dichloroethylene, HCB hexachlorobenzene, NDVI average Normalized Difference Vegetation Index, NO2 nitrogen dioxide, PCB polychlorinated biphenyl, PFHxS perfluorohexane sulfonate, PFNA perfluorononanoate, PFOA perfluorooctanoate, PFOS perfluorooctane sulfonate, PM10 particulate matter with an aerodynamic diameter of less than 10 μm, PM2.5 particulate matter with an aerodynamic diameter of less than 2.5 μm. Outdoor environment buffers reflect distance from home address. b Predicted probabilities of cluster membership for the selected prenatal factors in the Northern/Western cohort derived from multinomial regression models controlled for study site, sex and age at examination. Solid lines represent the predicted probabilities and dotted lines represent their 95% CIs. c Same as (b) but for the Southern/Mediterranean cohort. The number of participants in each multi-omics cluster across cohorts was as follows: N = 227 for Cluster A, N = 150 for Cluster B and N = 180 for Cluster C in the Northern/Western cohort, and N = 238 for Cluster A, N = 21 for Cluster B, and N = 47 for Cluster C in the Southern/Mediterranean cohort. Source data for all panels are provided as a Source Data file.

References

    1. Bluher, M. Obesity: global epidemiology and pathogenesis. Nat. Rev. Endocrinol.15, 288–298 (2019). - PubMed
    1. Report on the fifth round of data collection, 2018–2020: WHO European Childhood Obesity Surveillance Initiative (COSI). (WHO Regional Office for Europe, Copenhagen, 2022).
    1. Magge, S. N. et al. The metabolic syndrome in children and adolescents: shifting the focus to cardiometabolic risk factor clustering. Pediatrics140, e20171603 (2017). - PubMed
    1. Powell-Wiley, T. M. et al. Obesity and cardiovascular disease: a scientific statement from the american heart association. Circulation143, e984–e1010 (2021). - PMC - PubMed
    1. Stefan, N., Haring, H. U. & Schulze, M. B. Metabolically healthy obesity: the low-hanging fruit in obesity treatment? Lancet Diab. Endocrinol.6, 249–258 (2018). - PubMed

Substances

LinkOut - more resources