. 2025 Jan 14;9(1):14.
doi: 10.1038/s41698-024-00786-5.

Optimizing the NGS-based discrimination of multiple lung cancers from the perspective of evolution

Affiliations

Optimizing the NGS-based discrimination of multiple lung cancers from the perspective of evolution

Ziyang Wang et al. NPJ Precis Oncol. .

Abstract

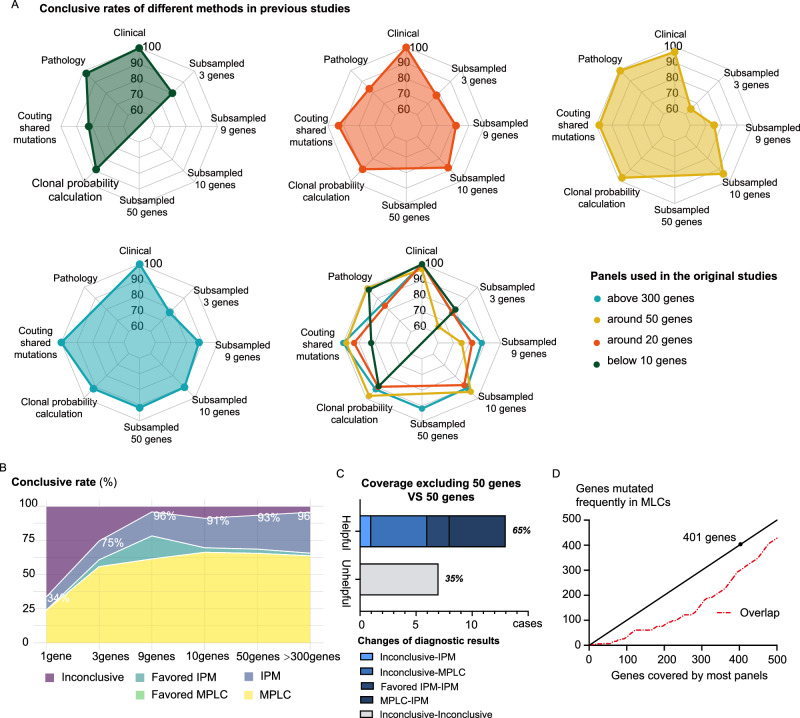
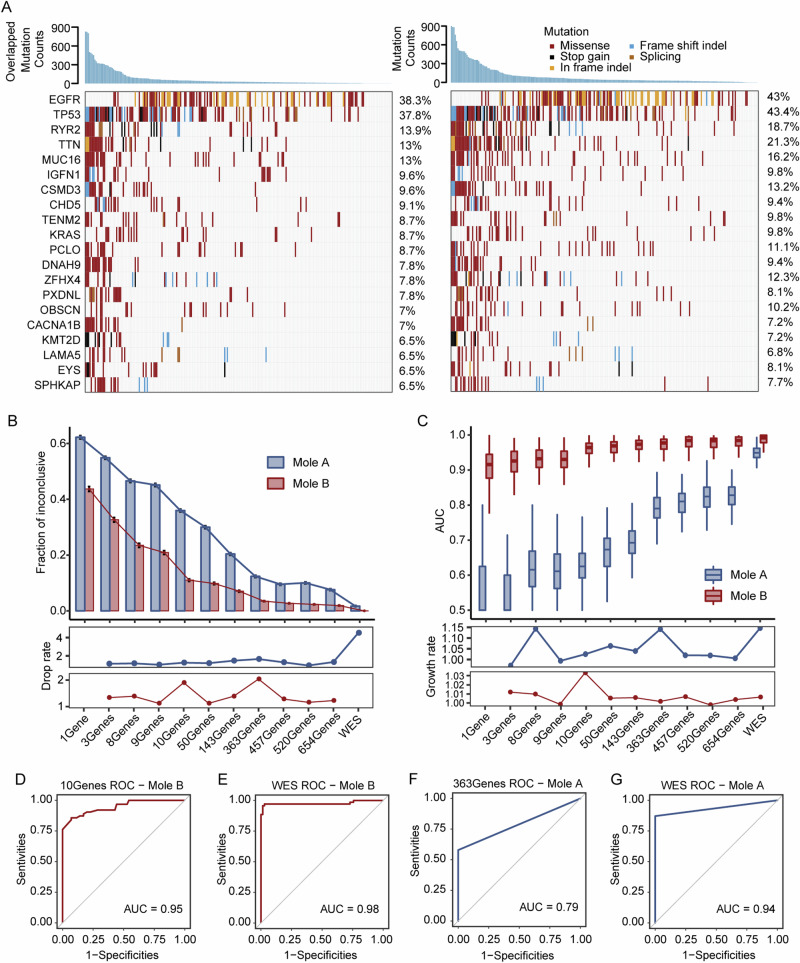
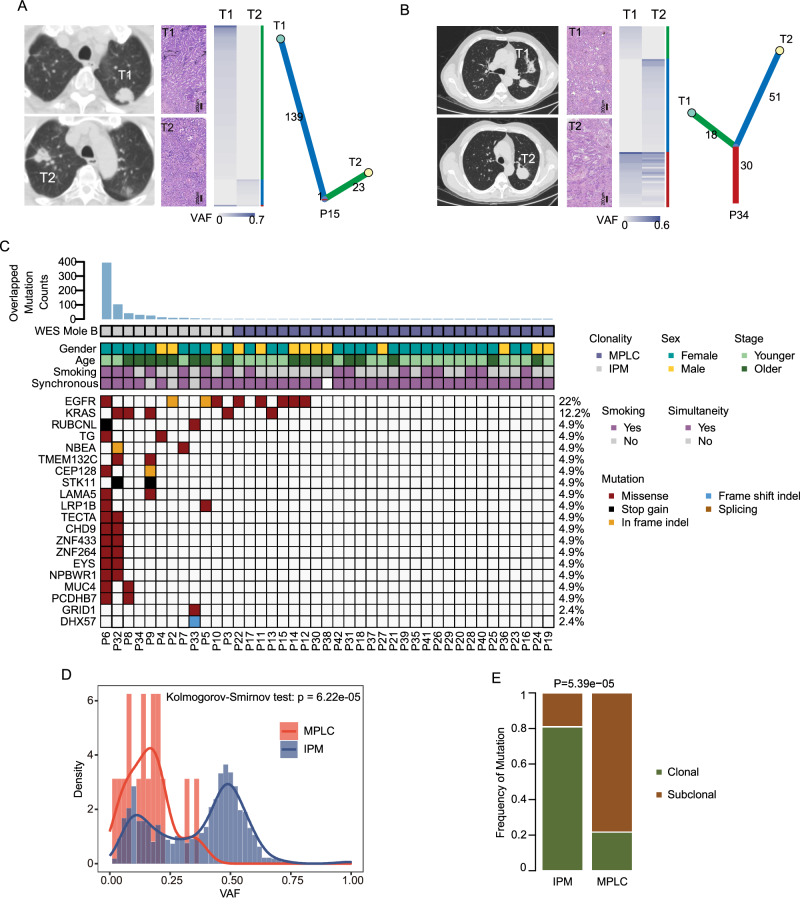
Next-generation sequencing (NGS) offers a promising approach for differentiating multiple primary lung cancers (MPLC) from intrapulmonary metastasis (IPM), though panel selection and clonal interpretation remain challenging. Whole-exome sequencing (WES) data from 80 lung cancer samples were utilized to simulate MPLC and IPM, with various sequenced panels constructed through gene subsampling. Two clonal interpretation approaches primarily applied in clinical practice, MoleA (based on shared mutation comparison) and MoleB (based on probability calculation), were subsequently evaluated. ROC analysis highlighted MoleB's superior performance, especially with the NCCNplus panel (AUC = 0.950 ± 0.002) and pancancer MoleA (AUC = 0.792 ± 0.004). In two independent cohorts (WES cohort, N = 42 and non-WES cohort, N = 94), NGS-based methodologies effectively stratified disease-free survival, with NCCNplus MoleB further predicting prognosis. Phylogenetic analysis further revealed evolutionary distinctions between MPLC and IPM, establishing an optimized NGS-based framework for differentiating multiple lung cancers.


Conflict of interest statement

Competing interests: The authors declare no competing interests.

Figures

Fig. 1
Fig. 1. Design of this study.
The left half illustrates the main workflow of our study, starting with a systematic review, followed by simulation analysis based on WES data from solitary NSCLC patients and independent validation comprising two MLCs cohorts, including a WES cohort (N = 42) and non-WES cohorts (N = 94). The right half depicted mutation-based clonal relatedness analysis adopted in this study, including MoleA (counting the shared mutations) and MoleB (clonal probability calculation). More details are elaborated in the “Methods” section. MLCs multiple lung cancers, MPLC multiple primary lung cancers, IPM intrapulmonary metastasis, WES whole-exome sequencing, NGS next-generation sequencing, NSCLC non-small cell lung cancer.
Fig. 2
Fig. 2. Data extracted from previous studies implicate the superiority of NGS in discriminating MLCs.
A Conclusive rates of the clinical criterion (Martini-Melamed criteria and proposals in the American Joint Committee on Cancer (AJCC) staging system), pathology and NGS (Empirical &Bioinformatic interpretation of sequencing results) of different coverages subsampled from the extracted sequencing data (sub3genes, etc). These charts were separated according to the panels (below 10 genes, etc) used in the original articles. B Summary of discrimination results of different mimicked panels. C The effects of the coverage excluding the 50 genes (sub50 genes or non 50 genes) compared with the 50-genes panel. The results were changed in 21 cases. D Overlaps between the genes covered by most NGS panels and the genes mutated frequently in MLCs. The number of mutations located on a specific gene is defined as the total number of selected mutations divided by the proportion of mutated cases in all cases where the corresponding gene was sequenced. The diagnosis of the different methods applied to each patient in included studies is presented in tabular form (Supplementary Tables 3 and 4). MLCs multiple lung cancers, MPLC multiple primary lung cancers, IPM intrapulmonary metastasis.
Fig. 3
Fig. 3. Simulation data reveals the optimal panels and superiority of bioinformatic analysis in judging clonal relatedness.
A Left panel: heatmap of overlapped mutations in 230 mimicked IPM tumor pairs, ranked by frequencies and counts. Right panel: heatmap of mutations in 235 tumor samples from 80 solitary NSCLC patients, ranked by frequencies and counts. B The proportions of inconclusive cases corresponding to different panels with MoleB or MoleA and their drop rates. C The AUCs corresponding to different panels with MoleB or MoleA and their growth rates. D The ROC curve of 10-genes panel with MoleB. E The ROC curve of WES with MoleB. F The ROC curve of 363-genes panel with MoleA. G The ROC curve of WES with MoleA. MoleA empirical interpretation by counting the shared mutations, MoleB bioinformatic interpretation by calculating the clonal probability based on all the mutations, AUC area under the receiver operating curve.
Fig. 4
Fig. 4. Analysis of the WES cohort verifies the superiority of optimal panels in discriminating MLCs.
A Clinical features, discriminating results, and mutational profiles of the 42 patients in WES cohort. The stage was the highest stage among the MLCs when staging all lesions separately. T1, T2, and T3 refer to different tumors of the same MLCs patient. A square consisting of two colors represents that the patient has multiple tumor pairs with different identification results. B Survival analyses stratified by clinic criteria of ACCP criteria. C Survival analyses stratified by CHA. D Survival analyses of patients diagnosed by the 10-genes panel with MoleB. E Survival analyses of patients diagnosed by WES with MoleB. F Summary of survival analyses stratified by different panels with MoleB, subsampled from WES data. G Heatmap of mutations with high frequency in the 10 cases where the 10-genes panel failed to detect mutations. H Typical pathologic manifestations of MPLC and IPM and one ambiguous example of MLCs. I Concordant rates between different discriminating methods (note that the unit here is “tumor pairs”). J Sensitivities and specificities for diagnosing MPLC or IPM of different discriminating methods, with WES MoleB as reference. MLCs multiple lung cancers, MPLC multiple primary lung cancers, IPM intrapulmonary metastasis, WES whole-exome sequencing, MoleA empirical interpretation by counting the shared mutations, MoleB bioinformatic interpretation by calculating the clonal probability based on all the mutations, ACCP American College of Chest Physicians, CHA comprehensive histology assessment.
Fig. 5
Fig. 5. Representative cases of pathological misdiagnoses and exploration of MLCs evolution.
A Images, pathology, mutation profiles, and the phylogenetic tree of a pathologically-inconclusive patient with a clear molecular diagnosis of MPLC (case 1). T1 and T2 refer to tumor1 and tumor2 of the same patient. B Images, pathology, mutation profiles, and the phylogenetic tree of a molecular-diagnosed IPM patient with typical MPLC pathology (case 2). C Heatmap of overlapped mutations within MLCs cases, ranked by frequencies and counts. D VAF distributions of overlapped mutations within MPLC and IPM. E Clonal/subclonal compositions of overlapped mutations within MPLC and IPM. MLCs multiple lung cancers, MPLC multiple primary lung cancers, IPM intrapulmonary metastasis, VAF variant allele frequency.
Fig. 6
Fig. 6. Timing of mutations in MLCs evolution based on the WES cohort.
A Tumor evolution of MLCs, merging MPLC and IPM. B Tumor evolution of IPM. This Figure shows the approximate timing of driver mutations with respect to the cancer life history. Driver genes were screened against the COSMIC database. The timing of mutations is shown as bars indicating whether the events are clonal or subclonal. Clonal mutations are further timed as early, late, or untimed with respect to whole-genome doubling. The frequency of mutations (subclonal and total) is indicated on the right side of the bars. Only genes containing ≥2 driver alterations across the cohort are included. MLCs multiple lung cancers, MPLC multiple primary lung cancers, IPM intrapulmonary metastasis, WES whole-exome sequencing, Pre-GD occurrence before whole-genome doubling, Post-GD occurrence after whole-genome doubling.
Fig. 7
Fig. 7. Recommended procedure for discriminating MLCs.
The gray boxes stand for the diagnostic steps before discriminating MLCs. The pink boxes display the clinicopathological evaluation and possible biopsy. The blue boxes describe the molecular assessment. The discrimination of MLCs starts with clinical evaluation. If preoperative biopsy of multiple foci is possible, it may allow the identification based on molecular features. Resected tumors are routinely subjected to pathological evaluation, which can unambiguously diagnose some typical cases with CHA. Molecular evaluation is recommended to be carried out together with pathology for all cases to reduce misdiagnosis. If the case is pathologically equivocal or lacking experienced pathologists, molecular evaluation should be preferentially performed. Bioinformatic interpretation of detected mutations is advised to quantify the clonal relatedness. On this premise, NGS with the NCCNplus panel (9 drivers recommended by the NCCN [EGFR, KRAS, ALK, BRAF, ERBB2, MET, RET, ROS1, PIK3CA] plus TP53) is recommended as the first choice, followed by WES as the second choice, and NGS with panels modified for MLCs as the third choice. With limited access to bioinformatic analysis, NGS using pancancer panels is recommended. If no mutation has been detected by limited sequencing, WES should be applied to eliminate inconclusiveness. Techniques based on other marker, such as variations in chromosomes or RNAs need further verification but could be carried out simultaneously with the former methods for research purposes. MLCs multiple lung cancers, MPLC multiple primary lung cancers, IPM intrapulmonary metastasis, NGS next-generation sequencing, WES whole-exome sequencing, ACCP American College of Chest Physicians, IASLC International Association for the Study of Lung Cancer, NCCN National Comprehensive Cancer Network.

Similar articles

References

    1. Siegel, R. L., Miller, K. D., Fuchs, H. E. & Jemal, A. Cancer statistics, 2022. CA Cancer J. Clin.72, 7–33 (2022). - PubMed
    1. Shintani, Y. et al. Clinical features and outcomes of patients with stage I multiple primary lung cancers. Cancer Sci.112, 1924–1935 (2021). - PMC - PubMed
    1. Mascalchi, M. et al. Screen-detected multiple primary lung cancers in the ITALUNG trial. J. Thorac. Dis.10, 1058–1066 (2018). - PMC - PubMed
    1. Cheng, H., Lei, B. F., Peng, P. J., Lin, Y. J. & Wang, X. J. Histologic lung cancer subtype differentiates synchronous multiple primary lung adenocarcinomas from intrapulmonary metastases. J. Surg. Res.211, 215–222 (2017). - PubMed
    1. Shao, J. et al. A comprehensive algorithm to distinguish between MPLC and IPM in multiple lung tumors patients. Ann. Transl. Med.8, 1137–1137 (2020). - PMC - PubMed

LinkOut - more resources