. 2025 Apr;32(4):675-686.
doi: 10.1038/s41594-024-01451-y. Epub 2025 Jan 14.

Single-molecule analysis of transcription activation: dynamics of SAGA coactivator recruitment

Affiliations

Single-molecule analysis of transcription activation: dynamics of SAGA coactivator recruitment

Jongcheol Jeon et al. Nat Struct Mol Biol. 2025 Apr.

Abstract

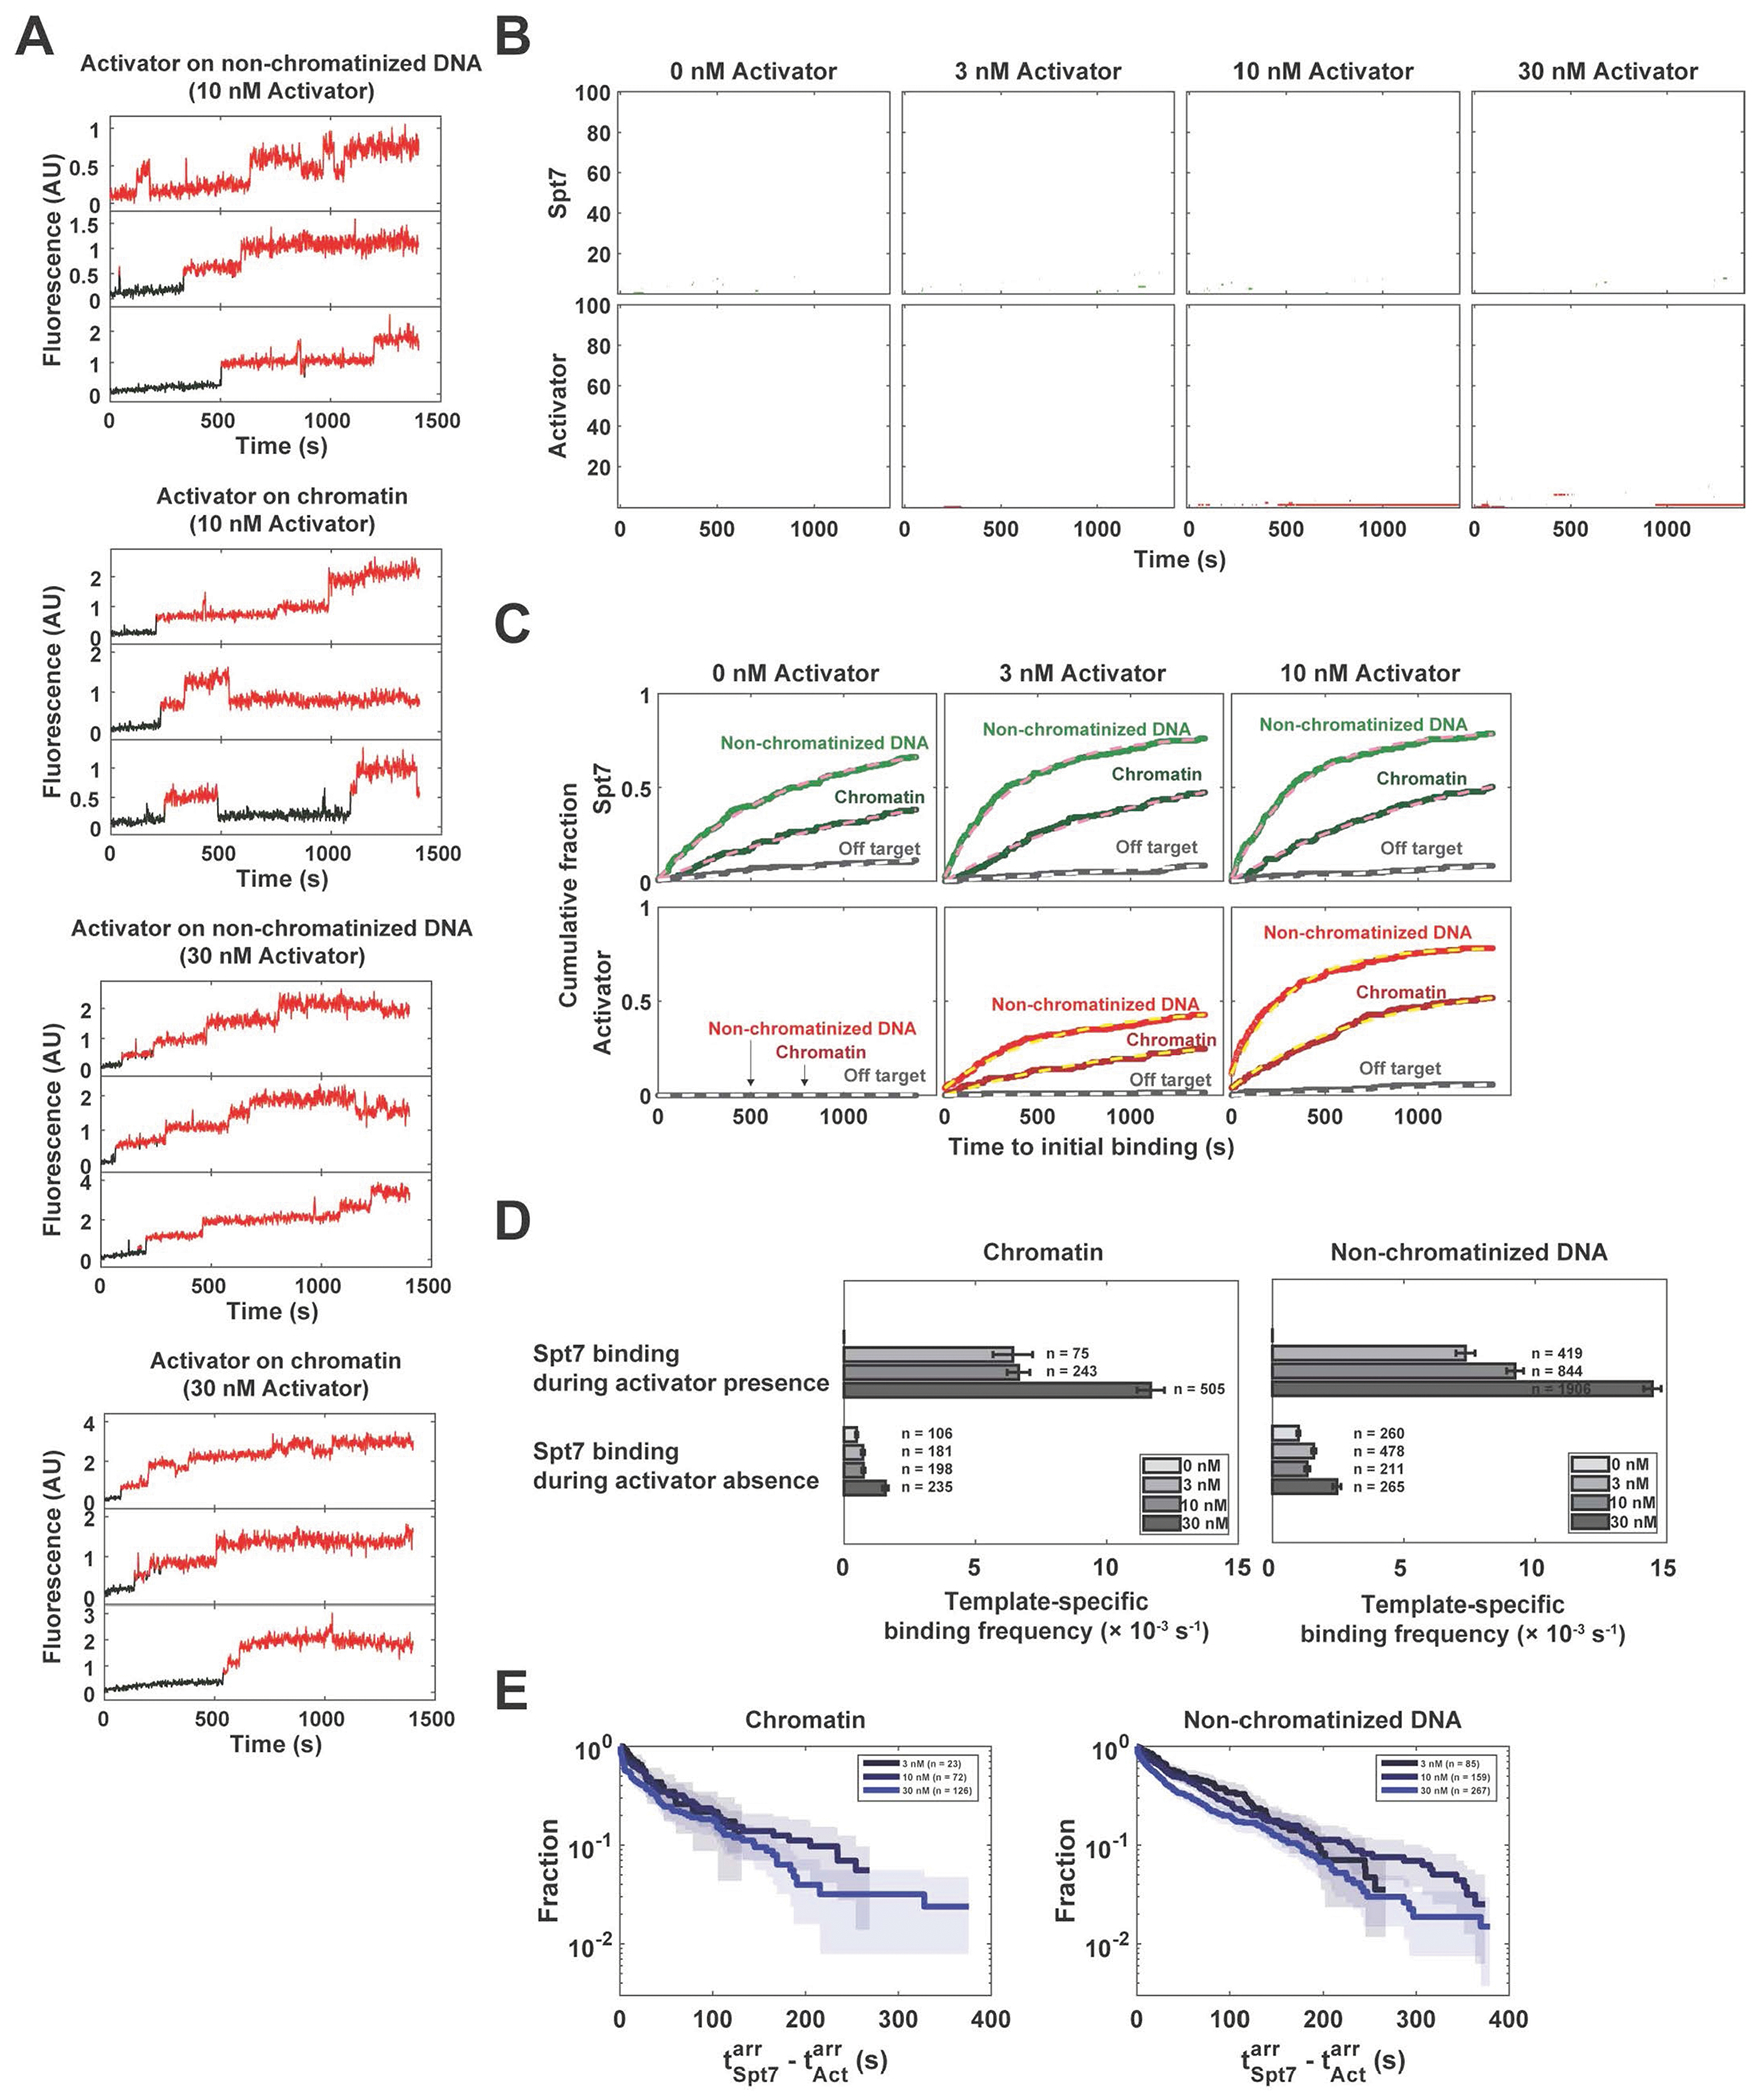
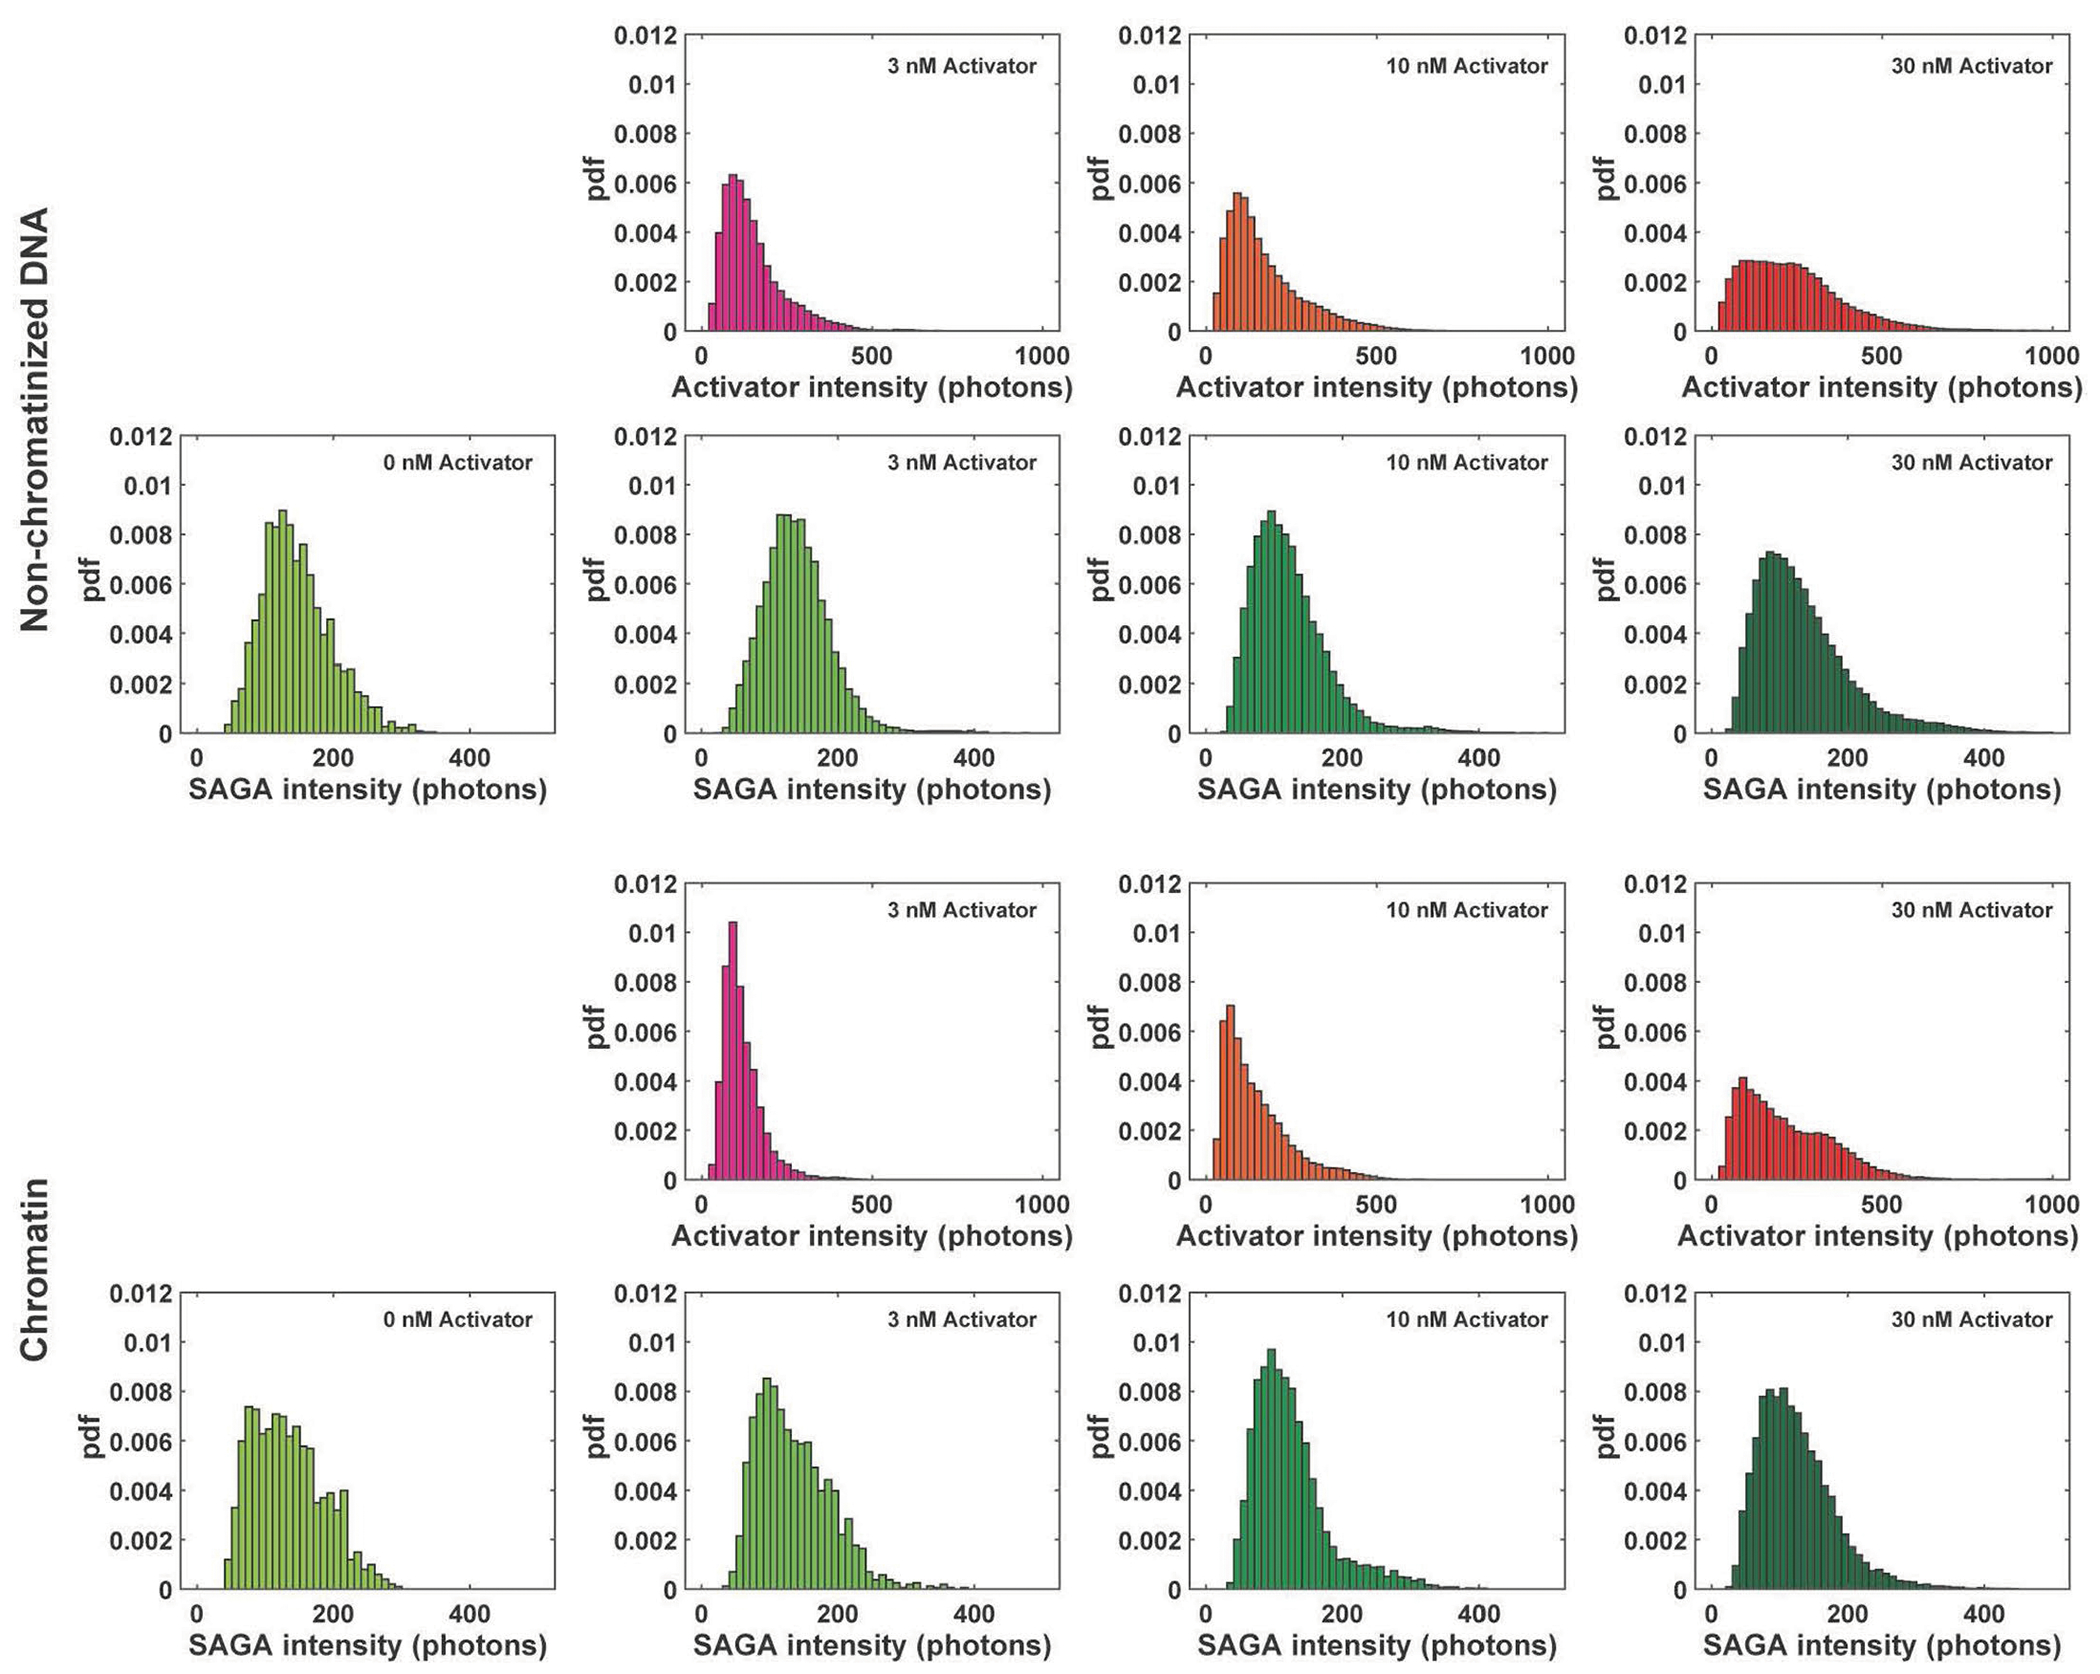
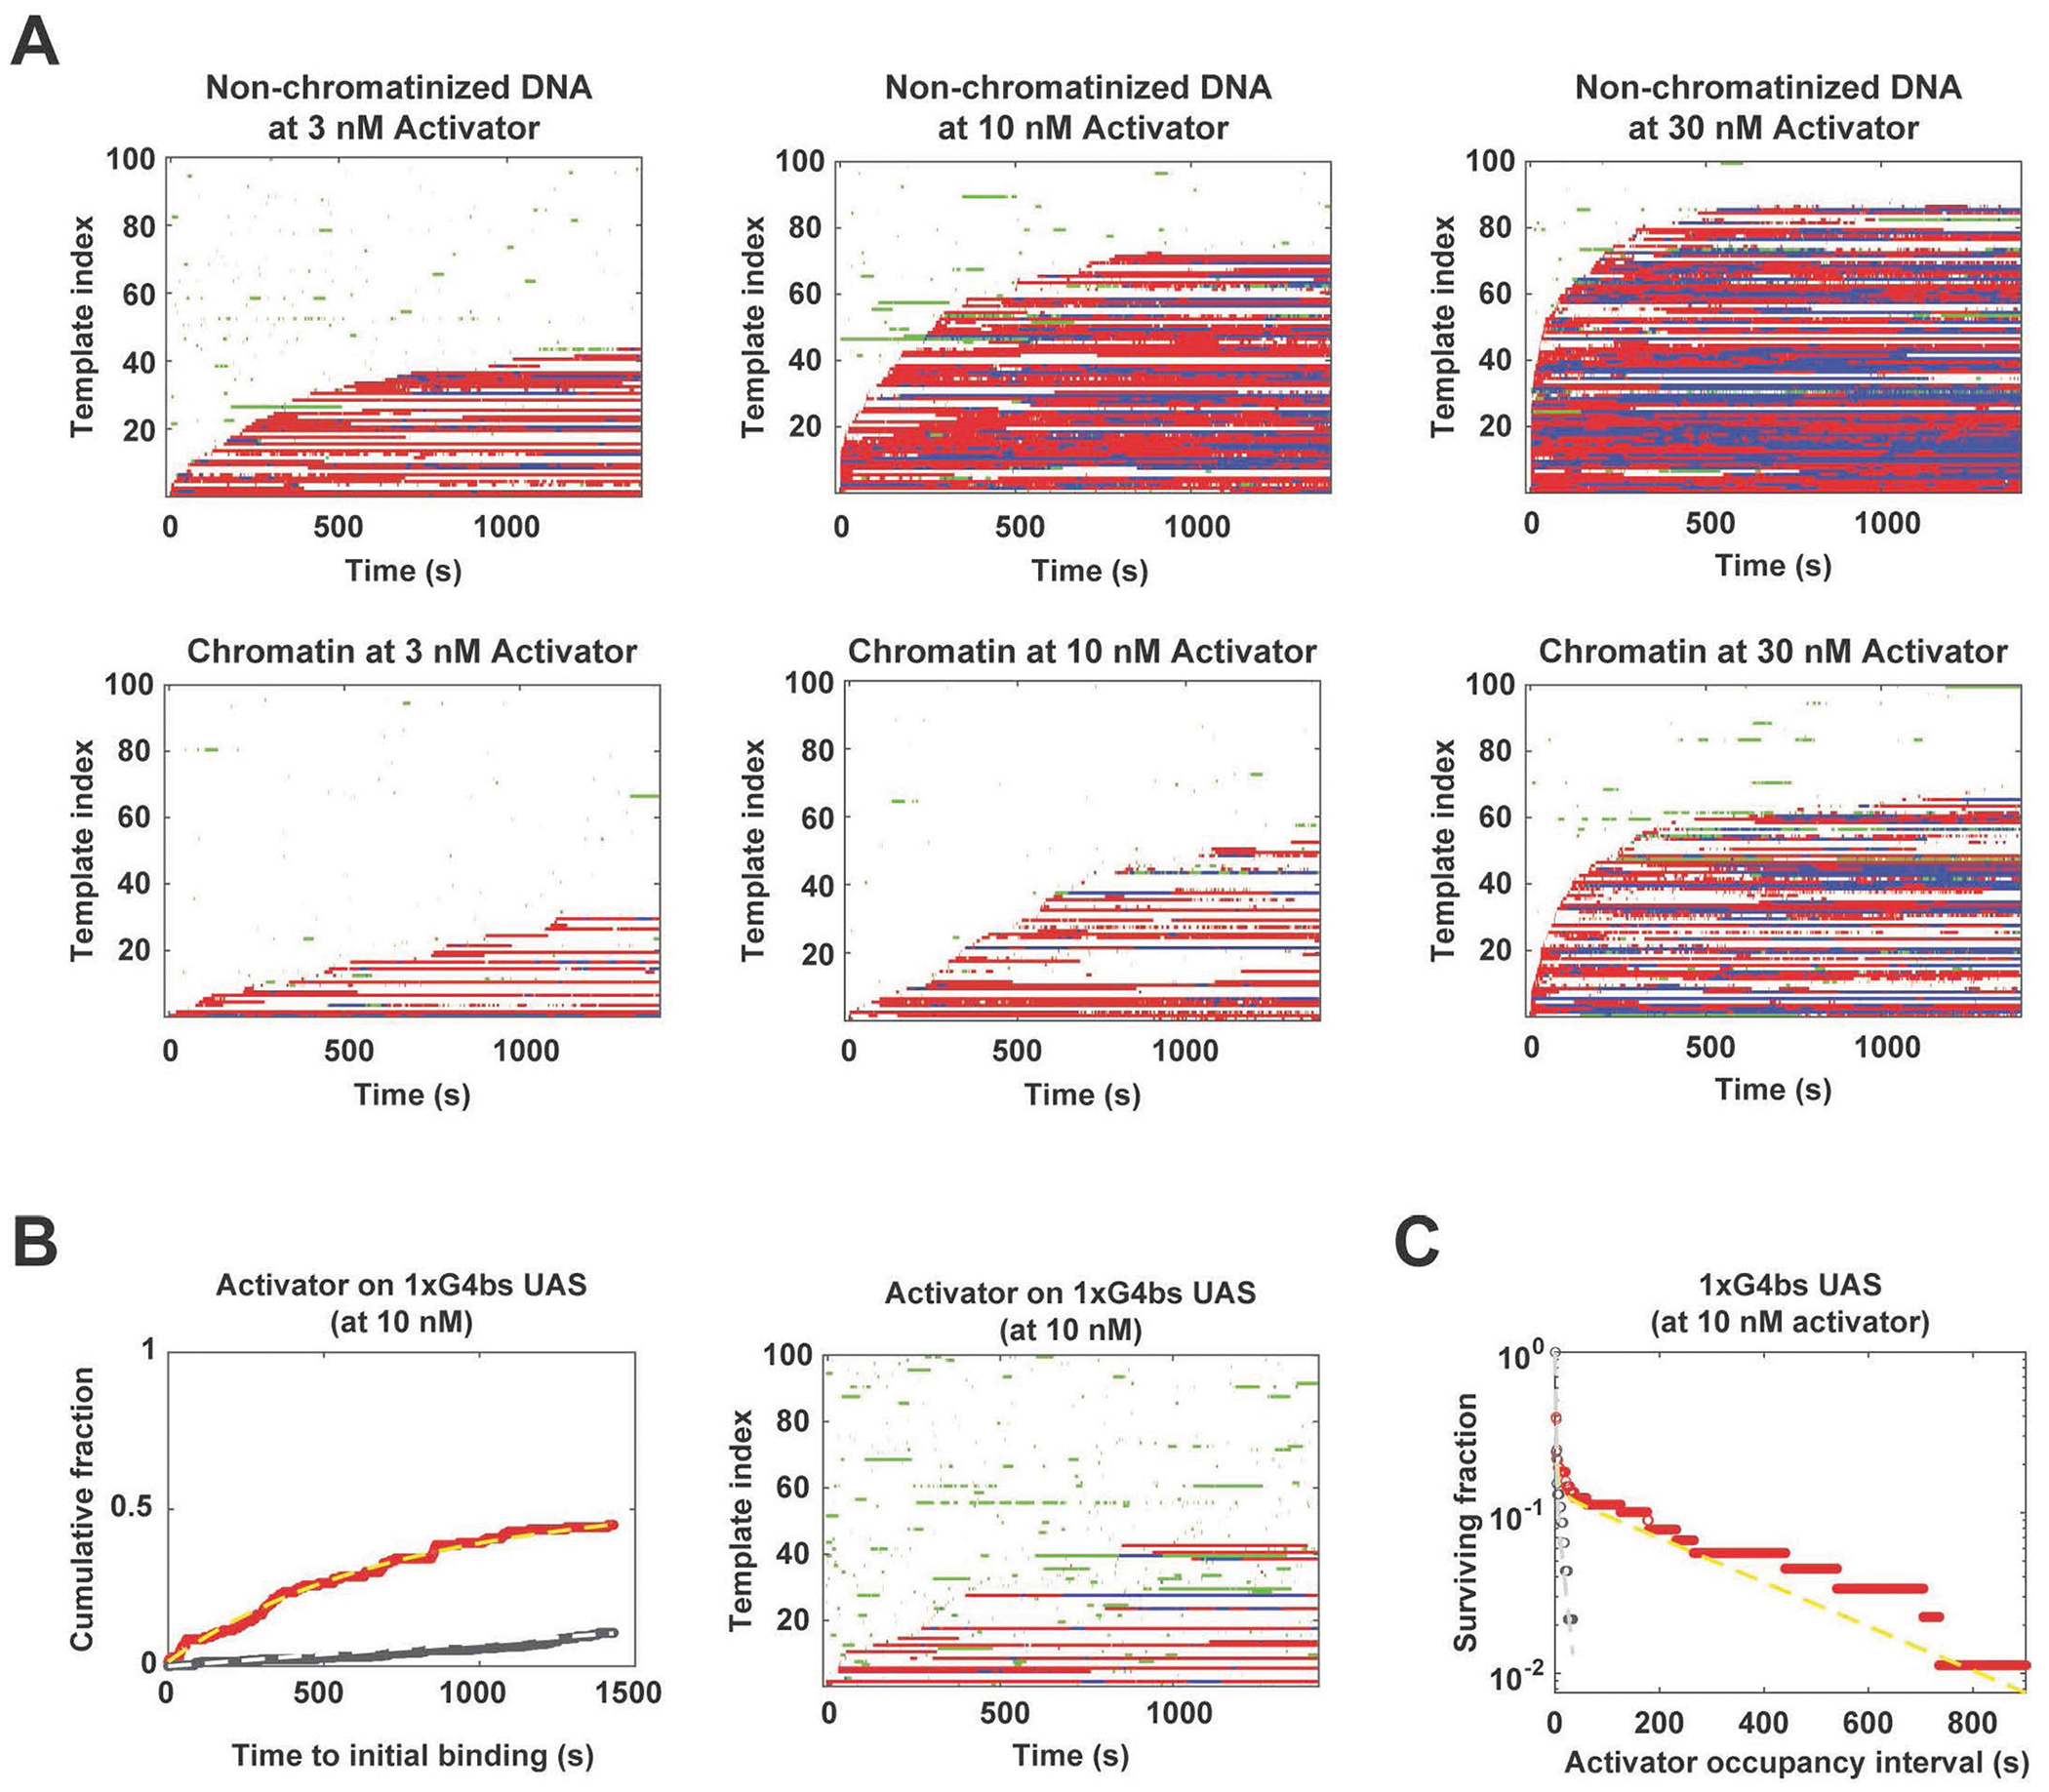
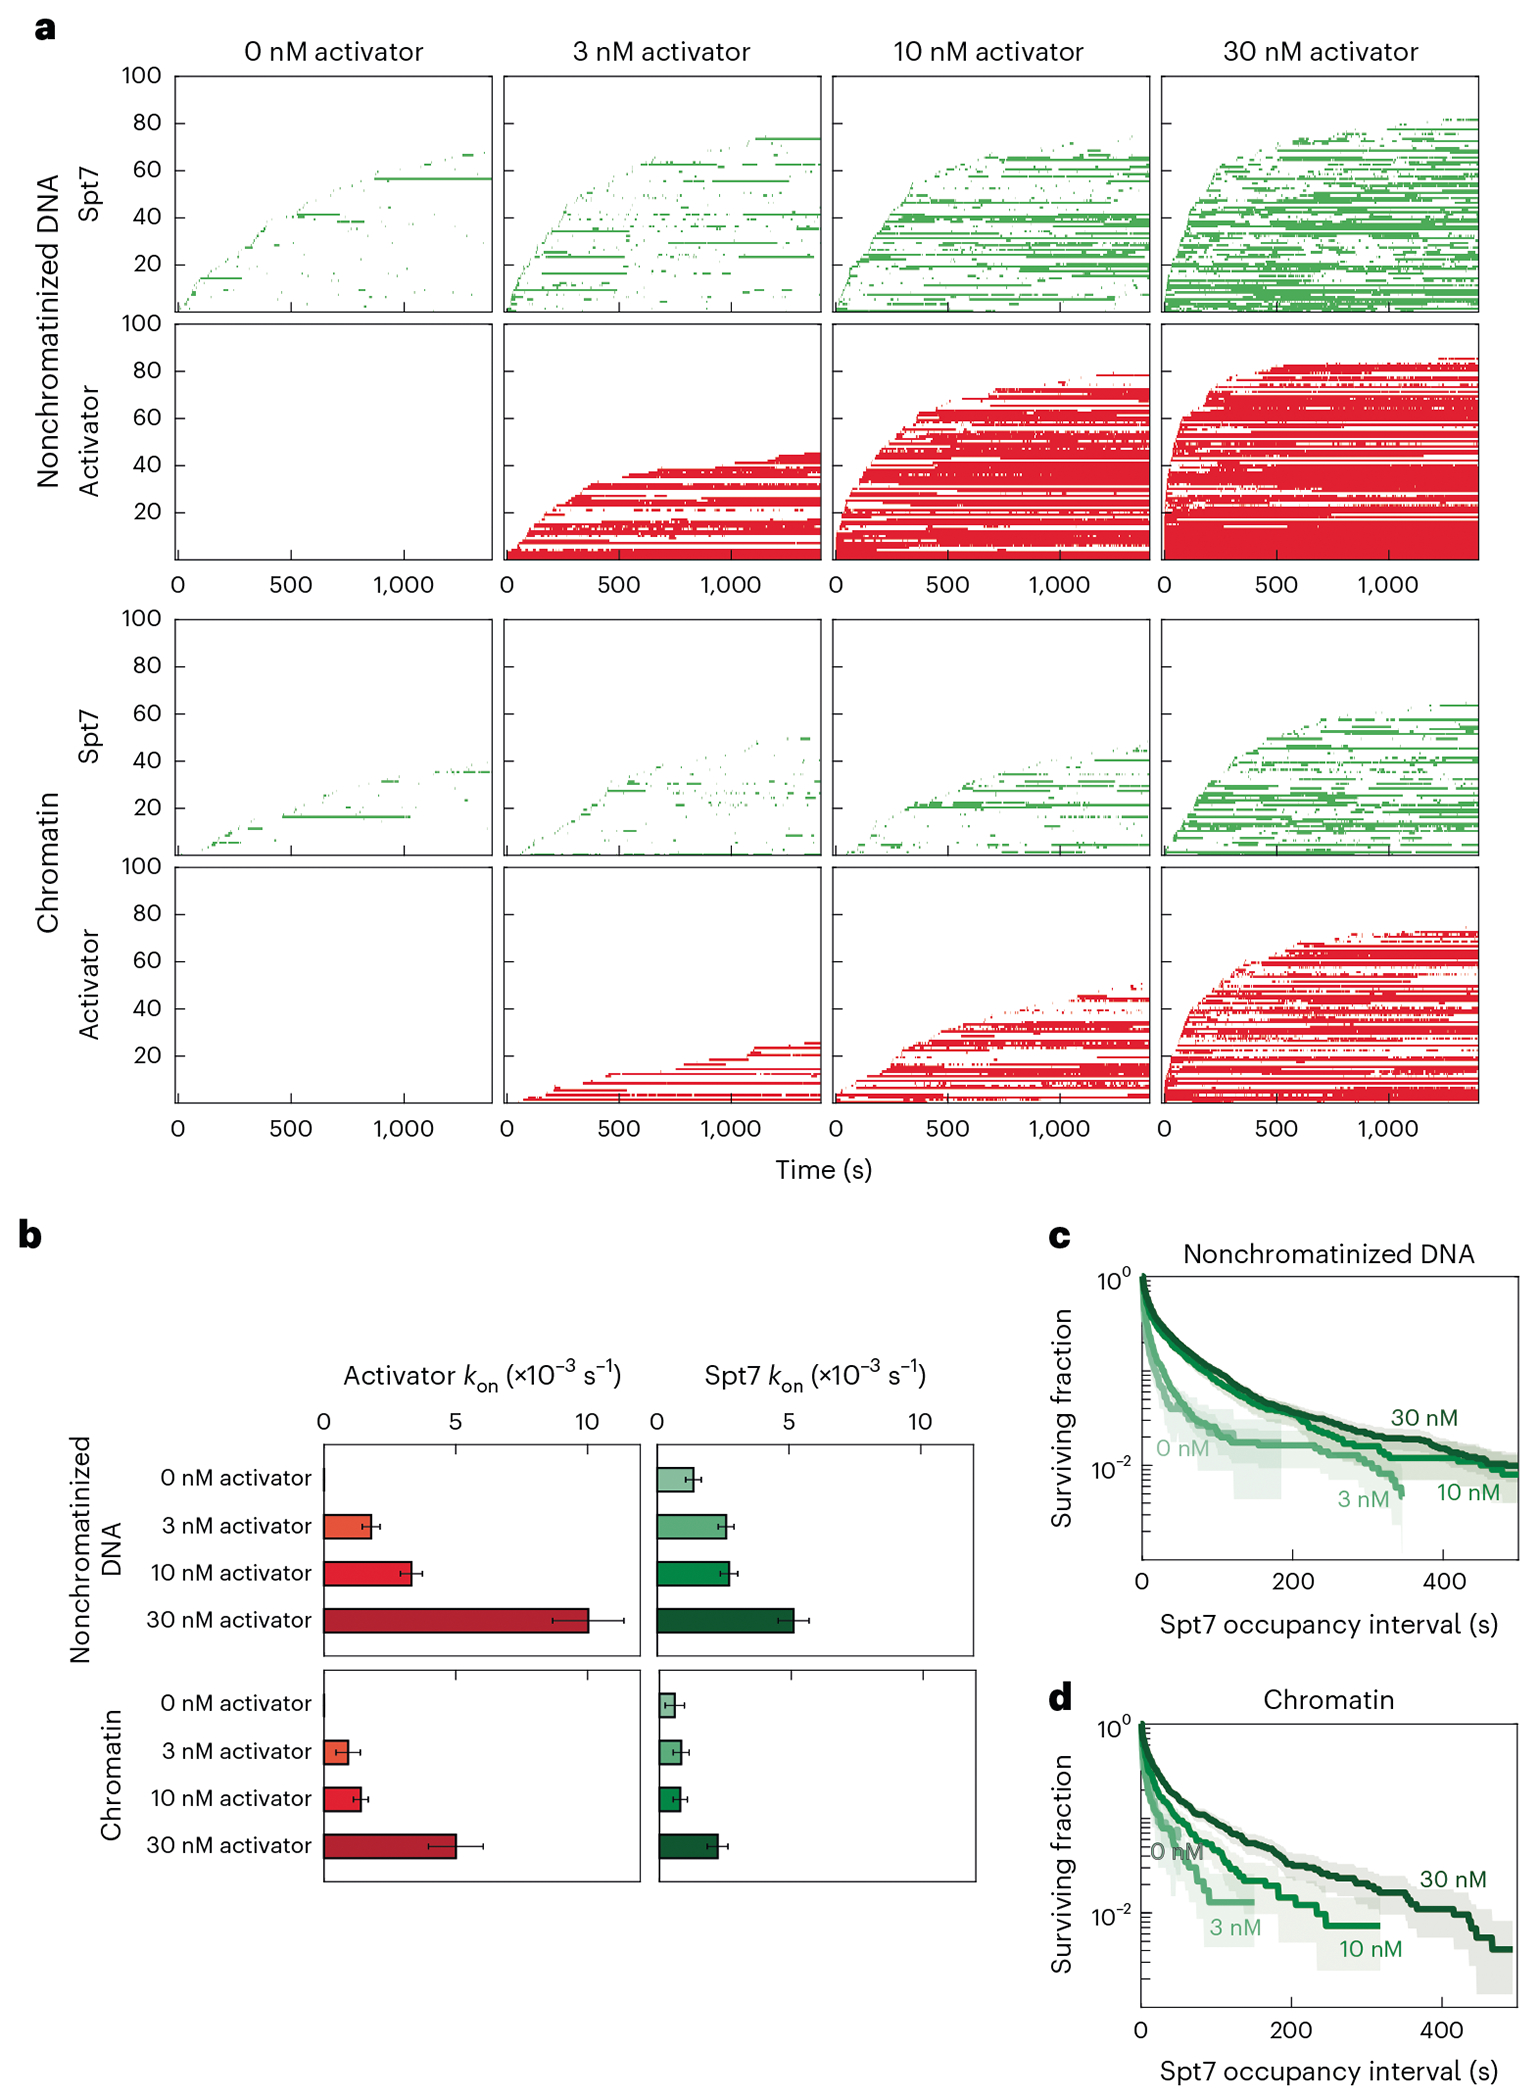
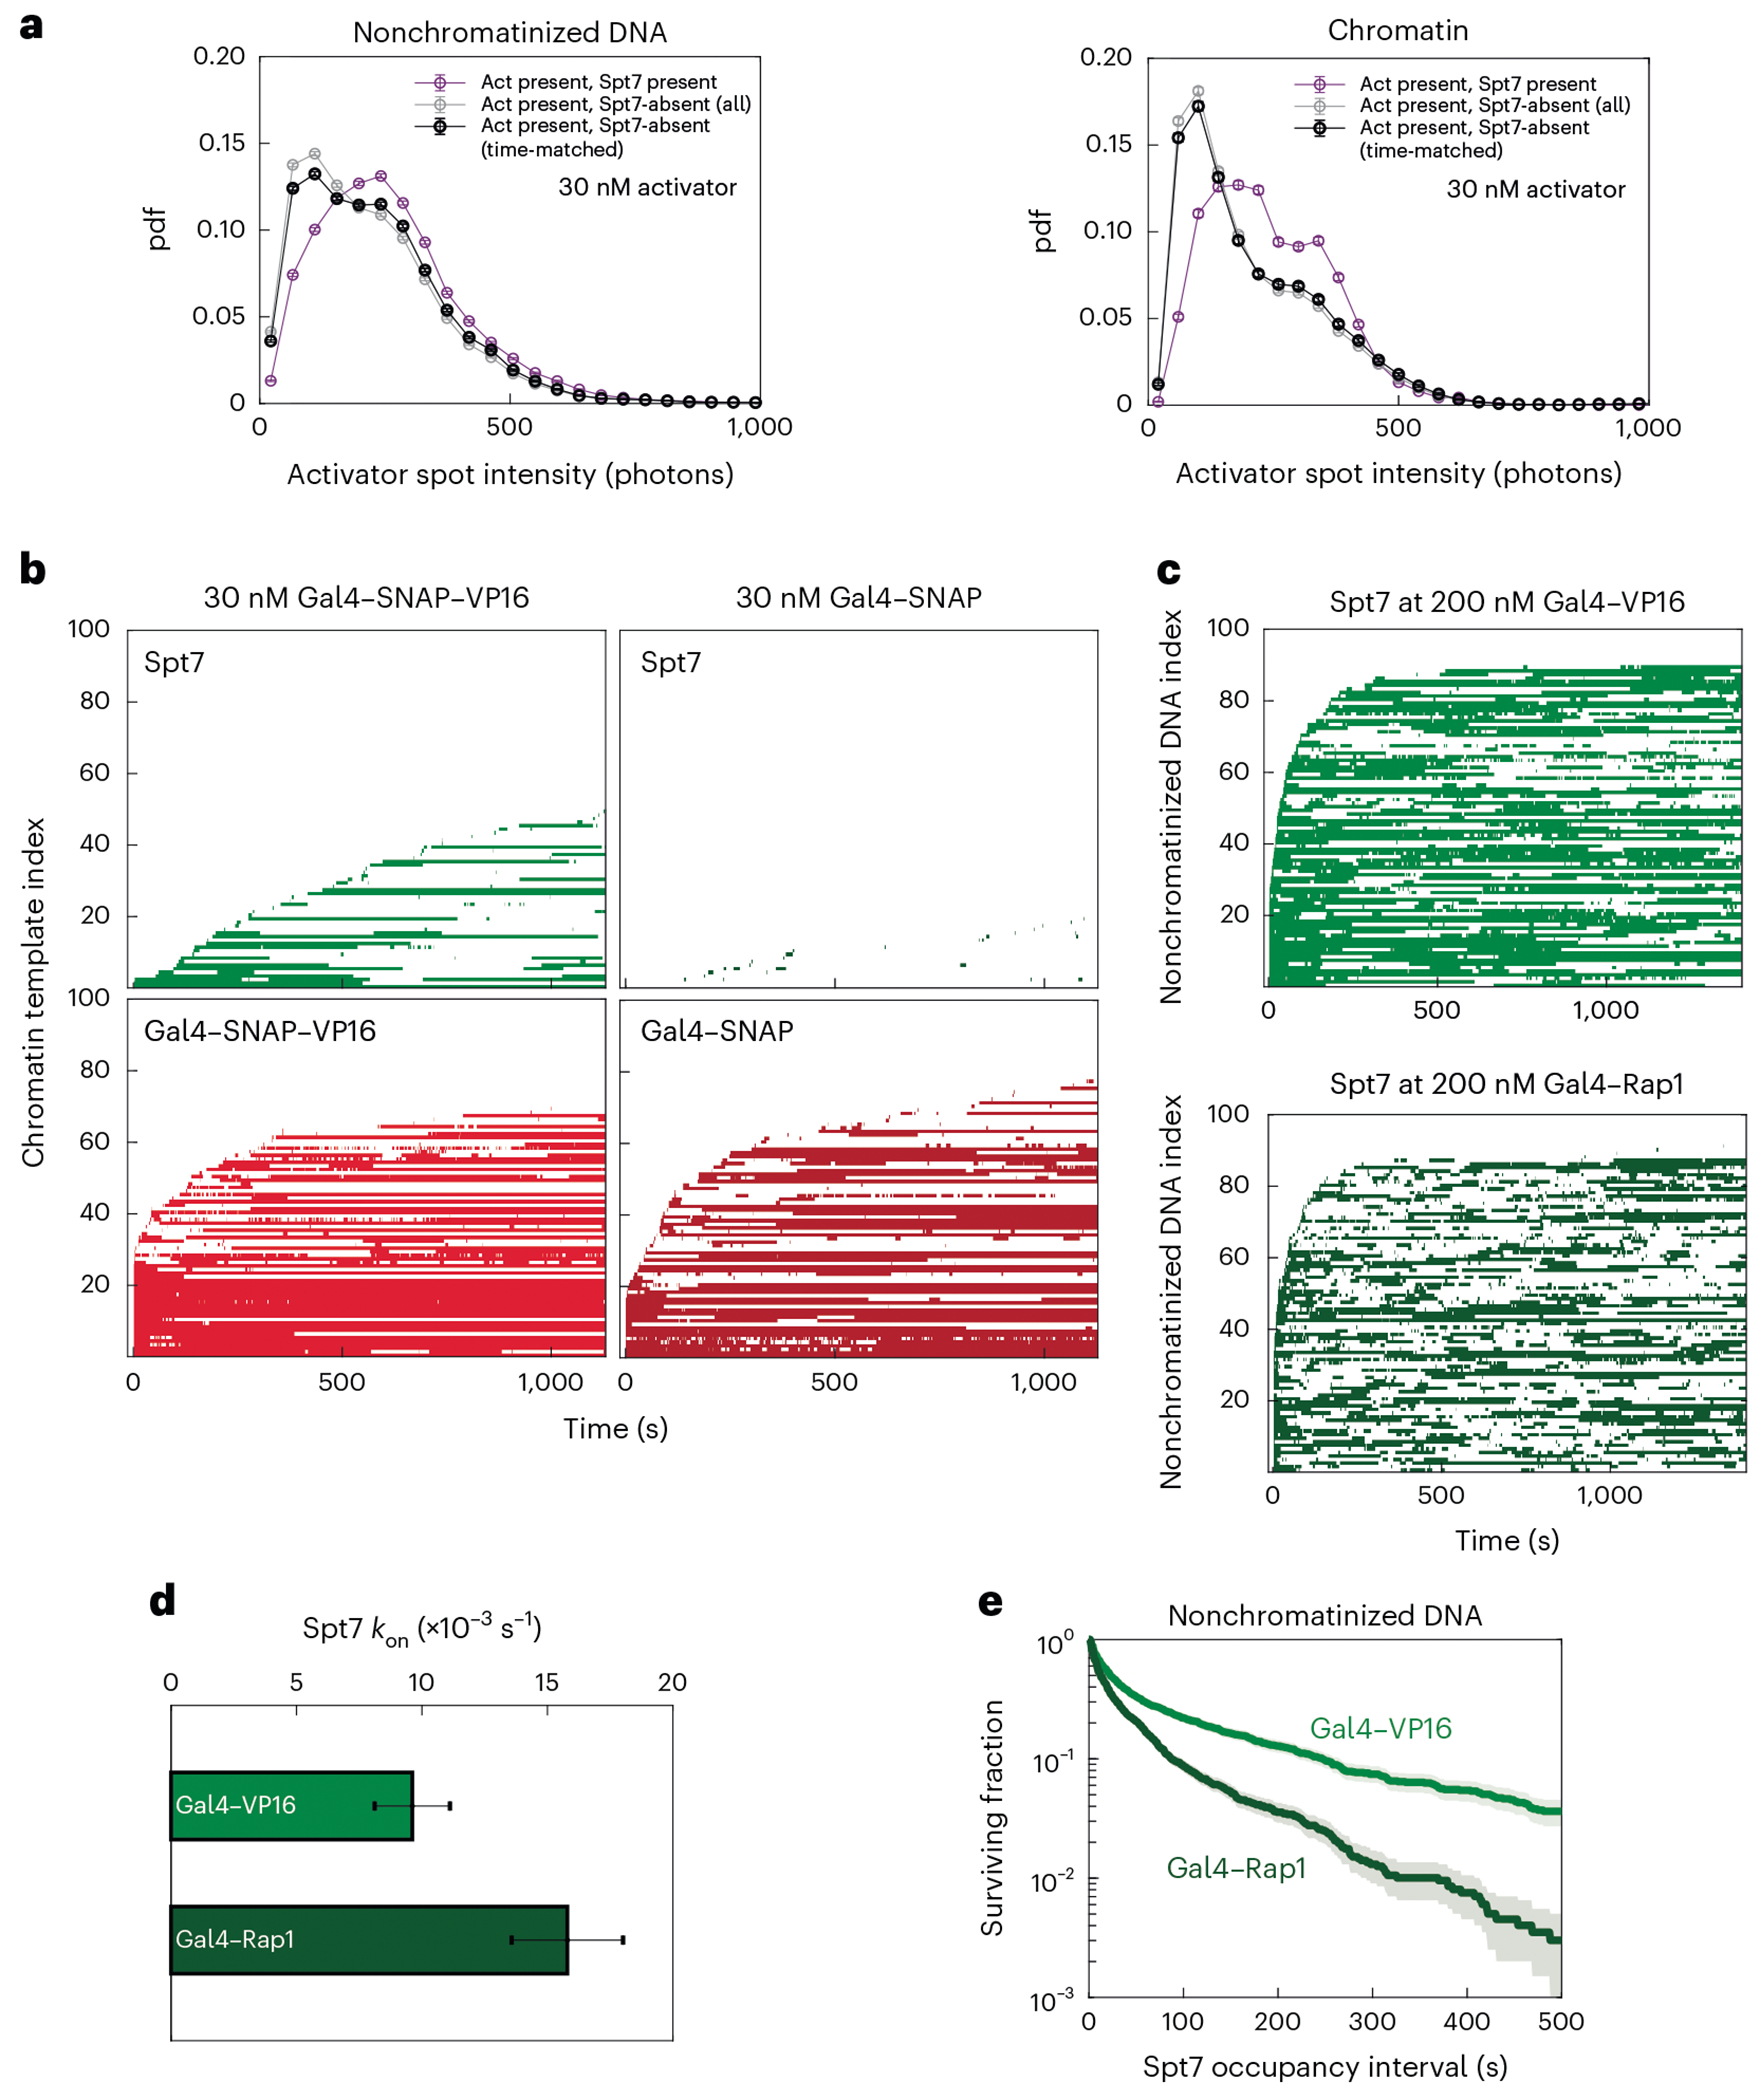
Transcription activators are said to stimulate gene expression by 'recruiting' coactivators, yet this vague term fits multiple kinetic models. To directly analyze the dynamics of activator-coactivator interactions, single-molecule microscopy was used to image promoter DNA, a transcription activator and the Spt-Ada-Gcn5 acetyltransferase (SAGA) complex within yeast nuclear extract. SAGA readily but transiently binds nucleosome-free DNA without an activator, while chromatin association occurs primarily when an activator is present. On both templates, an activator increases SAGA association rates by an order of magnitude and dramatically extends occupancy time. These effects reflect sustained interactions with the transactivation domain, as VP16 or Rap1 activation domains produce different SAGA dynamics. SAGA preferentially associates with templates carrying more than one activator. Unexpectedly, SAGA binding is substantially improved by nucleoside triphosphates but not histone H3 or H4 tail tetra-acetylations. Thus, we observe two modes of SAGA-template interaction: short-lived activator-independent binding to non-nucleosomal DNA and tethering to promoter-bound transcription activators for up to several minutes.


Conflict of interest statement

Competing interests: O.A.A., B.G. and E.F.P. are employees of EpiCypher, Inc., a commercial developer and supplier of nucleosomes with defined modifications similar to those used in this study. The other authors declare no competing interests.

Figures

Extended Data Fig. 1 |
Extended Data Fig. 1 |. Validation of Spt7-tagged yeast strains.
a. Spotting assay for cell growth. Four-fold serial dilutions of the untagged parent strain (YF702) and strains carrying the indicated fusions (YSB3337, YSB3573, and YSB3686) were grown on a YPD plate at 30 °C. No significant differences in cell growth were seen. b. Coomassie staining and fluorescence imaging of an SDS-PAGE gel resolving nuclear extract from strain YSB3686 (Spt7-SNAPDY549/Rpb1-HALO). c. Bulk in vitro transcription assay with yeast nuclear extracts, transcription activator Gal4-VP16, and plasmid template. Reverse transcribed DNA from RNA transcripts of an in vitro bulk transcription assay was separated on an 8 M urea- 6% polyacrylamide gel and analyzed by a Typhoon fluorescence imager. Nuclear extracts from labeled fusion strains (lanes 2 and 3) were slightly less active than untagged YF702 cells (lane 1), at least in part due to the extra time and manipulations needed for fusion protein labeling and removal of free dye. Transcription activation by Gal4-VP16 was not affected by insertion of the SNAPf tag between the Gal4 DNA binding domain and VP16 activation domain (compare lanes 5 and 6 to lane 4).
Extended Data Fig. 2 |
Extended Data Fig. 2 |. Dynamics of Spt7, Gcn5, and activator binding.
a. Three representative time records of SAGA and activator fluorescence intensity on non-chromatinized templates in the presence of 10 nM Gal4-SNAPDY649-VP16. Periods of fluorescent protein colocalization with the DNA template are colored (Spt7-SNAPDY549 in green; activator Gal4-SNAPDY649-VP16 in red). b. Three representative time records of fluorescence intensity for Spt7-SNAPDY549 and Gcn5-DHFRCy5TMP (extract from strain YSB3670), imaged in the presence of saturating, unlabeled Gal4-VP16 activator. c. Cumulative time-to-initial-binding distributions for Spt7-SNAPDY549 (left panel, green) and Gcn5-DHFRCy5TMP (right panel, orange). Gray curves show corresponding background binding to off-target sites on slide surface. Dashed lines show fits to a single-exponential specific binding model, with association rates and active fraction (Af) listed. d. Dual-color rastergram of Spt7-SNAPDY549 and Gcn5-DHFRCy5TMP binding events on DNA template. Binding records from 100 randomly selected template locations were binary-coded (color indicates colocalization with DNA) and sorted by time to first Spt7 binding, from bottom to top. Binding of Spt7 (green), Gcn5 (red), or both (blue) are overlaid. e. Dual color rastergrams for Spt7-HALOJF646 (green) and TBP (Spt15-SNAPDY549, red), sorted by time of initial Spt7 binding. Two DNA templates were analyzed on the same slide, with the standard 5xGal4bs-CYC1 construct (Fig. 1b) in left panel and a 5xGal4bs-RPS5 construct in right panel. f. Probability density of Spt7 binding survival intervals fit to a bi-exponential decay model. Dark green points (± S.E.) show SAGA binding with 10 nM activator, light blue points with no activator. Red and pink lines show fits to a bi-exponential decay model for both. Numbers of observations for statistics and fit parameters are given in Supplementary Table 6.
Extended Data Fig. 3 |
Effects of different activator concentrations on SAGA dynamics. a. Representative time records of Gal4-SNAPDY649-VP16 activator on non-chromatinized and chromatinized templates at 10 nM and 30 nM activator concentrations. Note the intensity jumps indicating that multiple activator molecules can bind simultaneously to the five Gal4 binding site UAS. b. Rastergrams of SAGA (Spt7-SNAPDY549, green) and Activator (Gal4-SNAPDY649-VP16, red) binding to ‘off-target’ areas of the slide where no template DNA is visible. 100 randomly chosen off-target locations show only sparse activator and Spt7 binding events at various activator concentrations (0, 3, 10 and 30 nM). c. Cumulative time-to-initial-binding distributions for Spt7-SNAPDY549 (upper panels) and Gal4-SNAPDY649-VP16 (lower panels) on non-chromatinized (light colors) versus chromatin (dark colors) templates at various activator concentrations (0, 3, and 10 nM). Gray curves show off-target background binding to slide surface, and dashed lines indicate curve fits. The corresponding data for 30 nM activator appears in Fig. 4c. Fit parameters are reported in Supplementary Table 5. d. Template-specific SAGA arrival frequencies (± S.E.) on chromatinized (left panel) and non-chromatinized (right panel) templates when activator is present or absent, calculated as in Fig. 2e. Four different activator concentrations (0, 3, 10 and 30 nM as indicated in key) were tested. Error bars show standard error, and n represents the number of Spt7 arrival events. Note that at 0 nM activator there is no ‘activator presence’, so the total frequency of Spt7 binding is all ‘during activator absence’. e. Cumulative survival plots of the time difference between Gal4-SNAPDY649-VP16 arrival (tActarr) and the first subsequent Spt7-SNAPDY549 arrival (tSpt7arr) on chromatin (left panel) and non-chromatin DNA (right panel). Three different activator concentrations (3, 10, and 30 nM) were examined. Shaded regions indicate 90% confidence intervals obtained by bootstrapping. n represents the number of time intervals in each condition.
Extended Data Fig. 4 |
Extended Data Fig. 4 |. Probability density (pdf) of fluorescence intensities measured for individual activator (red) or SAGA (green) spots.
Histograms graph the individual spot fluorescence intensities from the micrograph images taken for experiments shown in Fig. 3. Upper rows show binding events on non-chromatin templates and the bottom rows on chromatin templates. The correlation between spot intensity and number of molecules bound can be seen in the rightward shift as activator concentration increases.
Extended Data Fig. 5 |
Extended Data Fig. 5 |. Long duration activator binding correlates with long duration SAGA binding.
a. Dual color rastergrams of Gal4-SNAPDY649-VP16 and Spt7-SNAPDY549 binding events on template with five Gal4 binding sites. Activator binding records from 100 randomly chosen non-chromatinized (upper panels) and chromatinized (lower panel) template locations were binary-coded (red color indicates colocalization with DNA) and sorted by time to first activator binding, from bottom to top. Next, corresponding binary-coded SAGA binding records (green) from the same template were overlaid. Simultaneous binding of SAGA and activator was colored as blue. Increasing activator concentrations (3, 10, and 30 nM Gal4-SNAPDY649-VP16) are shown from left to right. b. Gal4-SNAPDY649-VP16 (10 nM) binding to non-chromatinized DNA templates containing a single Gal4 binding site (1xG4bs), in the absence of NTPs. Left panel shows cumulative time-to-initial-binding distribution of Gal4-SNAPDY649-VP16 on the template (red) or off-target (gray) locations. Dashed lines are curve fits (parameters in Supplementary Table 5). Right panel displays dual color rastergram of Gal4-SNAPDY649-VP16 activator (red) and Spt7-SNAPDY549 (green) binding records from 100 randomly chosen templates. Intervals when both are bound are colored in blue. c. Long duration activator occupancy can occur on DNA with a single Gal4 binding site. Survival plots of Gal4-SNAPDY649-VP16 occupancy intervals at locations of single Gal4 UAS containing template (red) or at off-target locations (gray). Bi-exponential fit parameters and numbers of events are listed in Supplementary Table 6.
Extended Data Fig. 6 |
Extended Data Fig. 6 |. SAGA binding responds to the number and character of activation domains.
a. Gal4-SNAPDY649-VP16 fluorescence intensity, a correlate of activator number, was measured for each spot within all micrograph images of the 3 and 10 nM activator experiments in Fig. 3. The probability density function (pdf) of intensities was plotted for all spots when SAGA was absent (gray) or present (purple). Because SAGA binding tended to occur at later times, a time-matched subset of SAGA-absent intensities was also plotted (black). b. Cumulative time-to-initial-binding distributions for Spt7-SNAPDY549 on non-chromatinized DNA templates. Gal4 DNA binding domain derivatives fused to either the VP16 (light green, top panel) or Rap1 (dark green, bottom panel) activation domains were used. Gray curves illustrate off-target background binding to slide surface, and dashed lines indicate curve fits. Note that these plots are derived from the full data set represented by the 100 randomly chosen DNAs used for the rastergrams in Fig. 6c. c. Three models for how activators may ‘recruit’ SAGA HAT activity to promoters. In all cases, SAGA is initially tethered to the UAS/enhancer via interactions with the activation domain. In Model 1, SAGA transfers to nearby naked DNA and is released from the activator. Acetylation occurs at nucleosomes flanking the naked DNA. In Model 2, SAGA remains tethered to the activator while the HAT activity targets nearby nucleosomes without any DNA contact. In Model 3, SAGA remains tethered to the activator, but also contacts nearby naked DNA to target the flanking nucleosomes. See Discussion for details.
Extended Data Fig. 7 |
Extended Data Fig. 7 |. Effects of histone acetylation and NTPs on SAGA and activator binding.
a. Spt7-SNAPDY549 (green) and Gal4-SNAPDY649-VP16 (red) bindings were simultaneously imaged on transcription templates chromatinized with human histone octamers containing either unmodified (light colors) or tetra-acetylated (dark colors) histone H3. Left and middle panels show cumulative time-to-initial-binding curves. Right panel shows the apparent association rates kon (± S.E) of Spt7-SNAPDY549 and Gal4-SNAPDY649-VP16 activator derived from the fits shown in the left and middle panels (dashed lines). This experiment was conducted in the absence of NTPs and acetyl-CoA. The number of sites for statistics and fit parameters are given in Supplementary Table 5. b. Survival plots for Spt7-SNAPDY549 and Gal4-SNAPDY649-VP16 dwell intervals on unmodified versus H3 tetra-acetylated chromatin templates in the absence of NTPs and acetyl-CoA. Shaded regions indicate 90% confidence intervals determined by bootstrapping. c. Rastergrams of Gal4-SNAPDY649-VP16 (red) and Spt7-SNAPDY549 (green) binding on non-chromatinized DNA and chromatinized template locations at 25 nM activator in the presence or absence of NTPs. d. Spt7-SNAPDY549 binding frequencies (± S.E) on non-chromatinized (top panel) and chromatinized (bottom panel) templates when activator is present (colors) or absent (grays). Both −NTPs and +NTPs conditions were tested. Error bars (standard error) were determined using the binomial distribution. n represents the number of arrival events.
Fig. 1 |
Fig. 1 |. Single-molecule analysis of TF association with the DNA template.
a, Schematic diagram of CoSMoS system. DNA template molecules labeled with blue dye (AF488, blue star) are attached to the microscope slide by biotin–streptavidin–biotin linkage. After recording the DNA locations, red-labeled TA (Gal4–SNAPDY649–VP16) and nuclear extract containing green-labeled SAGA (Spt7–SNAPDY549) are flowed into the reaction chamber. When imaging the reaction with TIRF microscopy, colocalizations of protein fluorescent spots with DNA locations are interpreted as binding events. b, Schematic of transcription template, with a UAS consisting of five Gal4-binding sites (G4bs) upstream of the CYC1 core promoter (CYC1pro) and a G-less cassette. Templates have biotin on one end for slide immobilization and blue dye AF488 on the other for visualization by TIRF microscopy. c, Microscope field of view showing DNA locations before incubation with proteins (t < 0). Note that many experiments in this paper simultaneously assayed binding to two DNA templates. One DNA (in this case, nonchromatinized transcription template; cyan boxes) is attached and imaged first to record its position, followed by attachment and imaging of the second template (here, chromatinized transcription template; blue boxes). The yellow box shows the area magnified in the inset and d. d, Selected frames from time course. Top: activator binding (red); bottom: SAGA binding (green). Numbers underneath (t) correspond to the image time and colored arrows indicate the presence of bound protein.
Fig. 2 |
Fig. 2 |. Activator-independent and activator-stimulated binding of SAGA to nonchromatinized DNA templates.
a, Intensity traces of Spt7–SNAPDY549 binding to nonchromatinized DNA. Top: binding at three individual DNAs in the presence of 10 nM Gal4–SNAP–VP16. Green color denotes the presence of an Spt7–SNAPDY549 fluorescent spot and brackets indicate multiple molecules present (seen at 46 of 202 DNAs at this activator concentration). Bottom: binding at three individual DNAs in the absence of activator. AU, arbitrary units. b, Cumulative time-to-initial-binding curves for SAGA in the presence (top; dark green) and absence (bottom; light green) of activator. Binding to off-target slide locations lacking DNA is shown in gray. Dashed lines are fitted to a model with first-order specific DNA template and nonspecific slide surface binding. The numbers of locations and fit parameters are given in Supplementary Table 5. c, Rastergrams showing SAGA binding to 100 randomly chosen DNAs, ordered from bottom to top by the time of first SAGA binding. Colored bars indicate intervals when one or more Spt7–SNAPDY549 molecules colocalized with the DNA molecule. d, DNA-specific SAGA association rate constants kon ± s.e. from fits in b. The s.e. was calculated using bootstrapping as described in the Supplementary Methods. The number of template locations used in the statistics is listed in Supplementary Table 5. e, Frequencies ± s.e. of template-specific Spt7–SNAPDY549 arrival to DNAs lacking bound Spt7 during intervals when activator was absent (gray; 1.3 ± 0.1 × 10⁻³ s−1) or present (purple; 9.2 ± 0.3 × 10⁻³ s−1) on the DNA molecule; n represents the number of arrival events. f, Survival plots for the duration of time intervals in which DNAs were occupied by one or more Spt7–SNAPDY549 molecules. Data are corrected for nonspecific surface binding measured at off-target control locations. Note that a single-exponential decay rate produces a straight line on this semilogarithmic plot; thus, an inflection indicates two components with distinct decay characteristics. Probability density functions with biexponential fits are shown in Extended Data Fig. 2f, with parameters in Supplementary Table 6. Shaded areas represent the 90% confidence intervals determined by bootstrapping simulations, as described in the Supplementary Methods.
Fig. 3 |
Fig. 3 |. Effect of increasing activator concentration on SAGA binding to nonchromatinized and chromatinized templates.
a, Rastergrams of SAGA (Spt7–SNAPDY549, green) and activator (Gal4–SNAP–VP16DY649, red) binding. Nonchromatinized and chromatinized templates were serially bound and their locations were recorded. Nuclear extract and the indicated concentration of activator were then flowed into the chamber and imaging of the green and red channels was initiated (t = 0). Binding rastergrams were constructed as in Fig. 2c. b, Apparent association rates (kon ± s.e.) calculated as in Fig. 2d. Data and curve fits are shown in Extended Data Fig. 3c. The number of locations for statistics and fit parameters is given in Supplementary Table 5. c, Survival plot (as in Fig. 2f) for SAGA occupancy intervals during which one or more Spt7–SNAPDY549 molecules were bound to nonchromatinized DNA at various activator concentrations, corrected for nonspecific surface binding measured at off-target control locations. Shaded areas show the 90% confidence intervals as determined by bootstrapping. The numbers of locations and biexponential fit parameters are given in Supplementary Table 6. d, Same as c, except for SAGA occupancy on chromatinized DNA templates.
Fig. 4 |
Fig. 4 |. Analysis of SAGA binding to chromatinized DNA templates.
a, Schematic of chromatin assembly process. DNA template was incubated with histone chaperone Nap1, the chromatin remodeler Isw1a purified from yeast and yeast histone octamers expressed in E. coli. b, Micrococcal nuclease digestion of chromatinized templates, followed by deproteinization and resolution of DNA by agarose gel electrophoresis. Limiting cleavage in linker regions revealed that each DNA carries up to four nucleosomes. c, Cumulative time-to-initial-binding distributions for SAGA (top; Spt7–SNAPDY549) and activator (bottom; Gal4–SNAPDY649–VP16, 30 nM) on nonchromatinized (light colors) versus chromatin (dark colors) templates. Gray curves show off-target background binding to slide surface. Dashed lines show fits to a single-exponential specific binding model as in Fig. 2b; fit parameters are given in Fig. 3b and Supplementary Table 5. d, Frequencies ± s.e. of Spt7–SNAPDY549 arrival on chromatinized templates during times when the activator was present (purple) or absent (gray). Error bars show the s.e. and n represents the number of arrival events used in the calculation. e, Survival plots for the duration of template-specific occupancy of one or more SAGA (left; Spt7–SNAPDY549) or activator (right; Gal4–SNAPDY649–VP16, 30 nM) molecules on nonchromatinized versus chromatin templates. Colors are as in c. Shaded areas indicate the 90% confidence intervals as determined by bootstrapping. The numbers of locations and biexponential fit parameters are given in Supplementary Table 6.
Fig. 5 |
Fig. 5 |. Chromatin suppresses activator-independent binding of SAGA to the template.
a, Dual-color rastergrams show initial arrivals of Gal4–SNAPDY649–VP16 (red color marks the first five frames of initial activator binding on that DNA) and Spt7–SNAPDY549 (green shows entire SAGA-bound interval) to nonchromatinized DNA templates (top) or chromatinized templates (bottom). Note that the activator concentrations for each type of DNA were chosen so that ~50% of DNAs bound activator by the end of the experiment (Fig. 3a). b, Intensity traces from two representative chromatinized templates illustrating how time intervals between SAGA (green) binding (tSpt7arr) and nearest activator (red) binding (tActarr) were determined. c, Histogram showing the probability density ± s.e. of the distribution of time intervals between SAGA and activator arrivals (tActarrtSpt7arr) in the formation of complexes that contain both factors. Blue shows actual data, while pink is a ‘scrambled’ control simulation where binding records for the two proteins on different DNAs were randomly paired. Error bars show the s.e.
Fig. 6 |
Fig. 6 |. SAGA binding responds to the number and character of ADs.
a, Gal4–SNAPDY649–VP16 fluorescence intensity, a correlate of activator number, was measured for each spot within all micrograph images of the 30 nM activator experiment in Fig. 3. The probability density function (pdf) of intensities was plotted for all spots when SAGA was absent (gray) or present (purple). Because SAGA binding tended to occur at later times, a time-matched subset of SAGA-absent intensities was also plotted (black). b, The Gal4 DBD is insufficient for SAGA recruitment. Rastergrams show binding data for SAGA (top; green) and the Gal4 derivative (bottom; red), when an AD was present (left; Gal4–SNAPDY649–VP16) or absent (right; Gal4–SNAPDY649). c, Rastergrams comparing SAGA binding on nonchromatinized templates in the presence of saturating (200 nM), unlabeled Gal4 DBD derivatives fused to either the VP16 (top; light green) or Rap1 (bottom; dark green) ADs, measured in the absence of NTPs. d, Association rates ± s.e. of Spt7–SNAPDY549 were calculated by curve fitting to the initial binding events of the experiment shown in c (fits in Extended Data Fig. 6b). Error bars show the s.e. as determined by bootstrapping. The number of locations for statistics and fit parameters is listed in Supplementary Table 5. e, Spt7 occupancy interval survival curve of the full dataset from the experiment in c. Shaded areas show the 90% confidence intervals as determined by bootstrapping.
Fig. 7 |
Fig. 7 |. Effects of histone acetylation and NTPs on SAGA and activator binding.
a, Cumulative time-to-initial-binding curves for activator (left; Gal4–SNAPDY649–VP16, red) and SAGA (middle; Spt7–SNAPDY549, green) binding to templates assembled with unmodified (light colors) or H4 tetra-acetylated (dark colors) chromatin templates or to slide areas with no visible DNA spots (off-target, gray). Right: association rates (kon) of Spt7–SNAPDY549 and Gal4–SNAPDY649–VP16 derived by model fitting (dashed lines show fits; fit parameters and the number of locations for statistics are listed in Supplementary Table 5). Bars show the s.e. as determined by bootstrapping. Note that no NTPs were added to this reaction. b, Occupancy interval survival curves for the first 500 s of data from the experiment in a are shown. Shaded areas show the 90% confidence intervals. c, Cumulative time-to-initial-binding curves are shown for the activator (bottom; Gal4–SNAPDY649–VP16, red) and SAGA (top; Spt7–SNAPDY549, green) to nonchromatinized DNA templates (light colors), DNA templates assembled with unmodified recombinant yeast histones (dark colors) or slide areas without DNA (off-target, gray). Left: results without NTPs; right: results in the presence of 400 μM NTPs. Rastergrams for this experiment are shown in Extended Data Fig. 7c. d, Association rates (kon ± s.e.) of Spt7–SNAPDY549 and Gal4–SNAPDY649–VP16 were derived by curve fitting to data in c (dashed lines). The number of locations used in the statistics and additional parameters are listed in Supplementary Table 5. Bars show the s.e. as determined by bootstrapping.

Update of

References

    1. Hahn S & Young ET Transcriptional regulation in Saccharomyces cerevisiae: transcription factor regulation and function, mechanisms of initiation, and roles of activators and coactivators. Genetics 189, 705–736 (2011). - PMC - PubMed
    1. Cairns BR The logic of chromatin architecture and remodelling at promoters. Nature 461, 193–198 (2009). - PubMed
    1. Li B, Carey M, & Workman JL The role of chromatin during transcription. Cell 128, 707–719 (2007). - PubMed
    1. Patel AB, Greber BJ & Nogales E Recent insights into the structure of TFIID, its assembly, and its binding to core promoter. Curr. Opin. Struct. Biol 61, 17–24 (2020). - PMC - PubMed
    1. Malik S & Roeder RG Mediator: a drawbridge across the enhancer–promoter divide. Mol. Cell 64, 433–434 (2016). - PMC - PubMed

MeSH terms

LinkOut - more resources