. 2025 Jan;6(1):105-116.
doi: 10.1038/s43016-024-01109-4. Epub 2025 Jan 14.

Governance and resilience as entry points for transforming food systems in the countdown to 2030

Kate R Schneider  1 Roseline Remans  2   3   4 Tesfaye Hailu Bekele  2   5 Destan Aytekin  6 Piero Conforti  7 Shouro Dasgupta  8   9 Fabrice DeClerck  3   4   10 Deviana Dewi  11 Carola Fabi  7 Jessica A Gephart  12 Yuta J Masuda  13 Rebecca McLaren  14 Michaela Saisana  15 Nancy Aburto  7 Ramya Ambikapathi  16   17 Mariana Arellano Rodriguez  18 Simon Barquera  18 Jane Battersby  19 Ty Beal  14 Christophe Béné  3   4   20 Carlo Cafiero  7 Christine Campeau  21 Patrick Caron  22   23   24 Andrea Cattaneo  7 Jeroen Candel  5 Namukolo Covic  25   26 Inmaculada Del Pino Alvarez  7 Ana Paula Dominguez Barreto  18 Ismahane Elouafi  27 Tyler J Frazier  28 Alexander Fremier  29 Pat Foley  30 Christopher D Golden  31 Carlos Gonzalez Fischer  16   17 Alejandro Guarin  32 Sheryl Hendriks  33   34 Anna Herforth  5   31 Maddalena Honorati  35 Jikun Huang  36 Yonas Getaneh  3   4 Gina Kennedy  3   4 Amos Laar  37 Rattan Lal  38 Preetmoninder Lidder  7 Getachew Legese Feye  25 Brent Loken  39 Hazel Malapit  25 Quinn Marshall  25 Kalkidan A Mulatu  3   4 Ana Munguia  18 Stella Nordhagen  40 Danielle Resnick  25 Diana Suhardiman  41   42 U Rashid Sumaila  43 Bangyao Sun  11 Belay Terefe Mengesha  3   4 Maximo Torero Cullen  7 Francesco N Tubiello  7 Corné van Dooren  5   44 Isabel Valero Morales  18 Jose-Luis Vivero-Pol  45 Patrick Webb  46 Keith Wiebe  25 Lawrence Haddad  40 Mario Herrero  16   17 Jose Rosero Moncayo  7 Jessica Fanzo  47
Affiliations

Governance and resilience as entry points for transforming food systems in the countdown to 2030

Kate R Schneider et al. Nat Food. 2025 Jan.

Erratum in

  • Author Correction: Governance and resilience as entry points for transforming food systems in the countdown to 2030.
    Schneider KR, Remans R, Bekele TH, Aytekin D, Conforti P, Dasgupta S, DeClerck F, Dewi D, Fabi C, Gephart JA, Masuda YJ, McLaren R, Saisana M, Aburto N, Ambikapathi R, Arellano Rodriguez M, Barquera S, Battersby J, Beal T, Béné C, Cafiero C, Campeau C, Caron P, Cattaneo A, Candel J, Covic N, Del Pino Alvarez I, Dominguez Barreto AP, Elouafi I, Frazier TJ, Fremier A, Foley P, Golden CD, Gonzalez Fischer C, Guarin A, Hendriks S, Herforth A, Honorati M, Huang J, Getaneh Y, Kennedy G, Laar A, Lal R, Lidder P, Feye GL, Loken B, Malapit H, Marshall Q, Mulatu KA, Munguia A, Nordhagen S, Resnick D, Suhardiman D, Sumaila UR, Sun B, Mengesha BT, Torero Cullen M, Tubiello FN, Dooren CV, Valero Morales I, Vivero-Pol JL, Webb P, Wiebe K, Haddad L, Herrero M, Rosero Moncayo J, Fanzo J. Schneider KR, et al. Nat Food. 2025 Apr;6(4):410-411. doi: 10.1038/s43016-025-01143-w. Nat Food. 2025. PMID: 39972188 Free PMC article. No abstract available.

Abstract

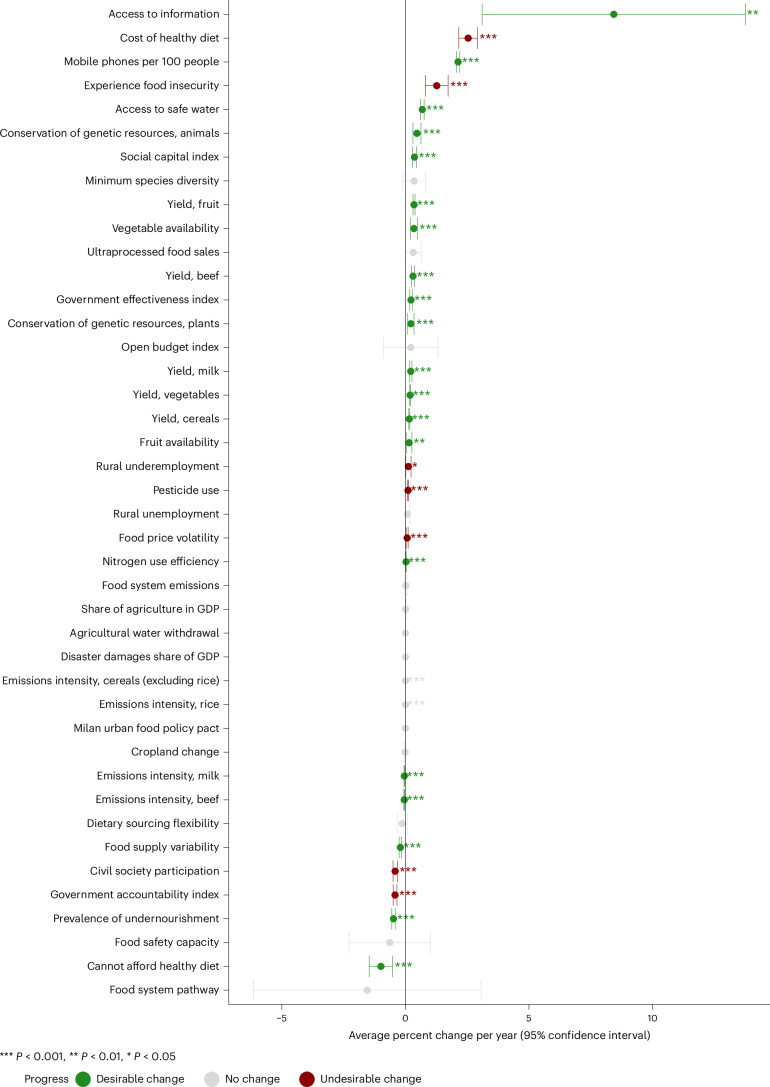
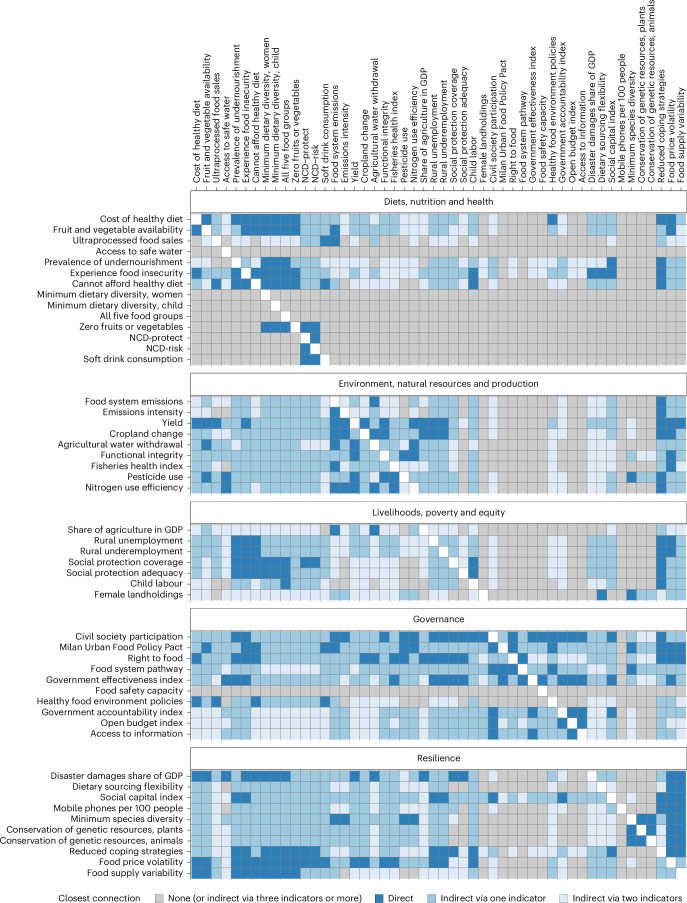
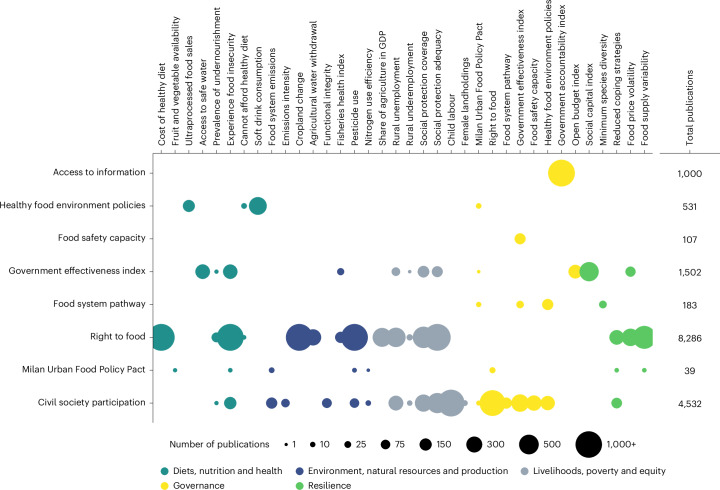
Due to complex interactions, changes in any one area of food systems are likely to impact-and possibly depend on-changes in other areas. Here we present the first annual monitoring update of the indicator framework proposed by the Food Systems Countdown Initiative, with new qualitative analysis elucidating interactions across indicators. Since 2000, we find that 20 of 42 indicators with time series have been trending in a desirable direction, indicating modest positive change. Qualitative expert elicitation assessed governance and resilience indicators to be most connected to other indicators across themes, highlighting entry points for action-particularly governance action. Literature review and country case studies add context to the assessed interactions across diets, environment, livelihoods, governance and resilience indicators, helping different actors understand and navigate food systems towards desirable change.


Conflict of interest statement

Competing interests: L.H., M.H., J.R.M. and J.F. are cochairs of the FSCI, coled by the Global Alliance for Improved Nutrition, the Food and Agriculture Organization of the United Nations, Cornell University and Columbia Climate School. The findings, ideas and conclusions presented here are those of the authors and do not necessarily reflect the positions or policies of any of GAIN’s funding partners or of United Nations member states. The other authors declare no competing interests.

Figures

Fig. 1
Fig. 1. Global linear trends over time, 2000–2022.
Coefficients of a linear (least squares) regression of the indicator on time (year) for all indicators with data from more than 1 year. Indicator data (response variable) are normalized by minimum–maximum scaling and multipled by 100 before regressing on the variable year with country fixed effects; the original units are defined in Supplementary Table 1. The results are interpreted as average percentage change in the indicator per year over the period analysed. Note the number of country-years differs per indicator. Change defined as desirable if the results per indicator meet the following criteria: (1) the trend line is statistically significantly different from zero, (2) the coefficient estimate is >0 when rounded to the nearest tenth and (3) the sign agrees with the desirable direction of change (defined in Supplementary Table 1). Conversely, the estimates were labelled as changing in the undesirable direction if they were statistically significant with a non-zero coefficient when rounded to the nearest tenth and a sign opposite the desirable direction of change. Coefficients that round to zero, even if statistically significant, are classified as no change, since the magnitude of the coefficient is not practically meaningful. The regressions are weighted by the weighting variables defined in Supplementary Table 1. The sample size (number of countries and years) per indicator included in the analysis is provided in Supplementary Table 4. Excluded indicators do not have time series data and include All-5, minimum dietary diversity (women and children), soft drink consumption, zero fruits or vegetabls (adult and children), NCD-protect, NCD-risk, functional integrity, fisheries health index, social protection coverage, social protection adequacy, child labour, female landholdings and reduced coping strategies.
Fig. 2
Fig. 2. Health-related food environment policies.
The presence of national health-related food environment policies classified into economic (taxes and subsidies) and mandatory regulatory (for example, front-of-pack labelling), both or none. The countries in grey have no national health-related food environment policies (see Supplementary Table 6 for further information on the classification of policies to construct this indicator).
Fig. 3
Fig. 3. Closest assessed connection between each pair of indicators.
The proposed causal relationships between pairs of indicators as assessed by expert assessment, directed from row to column. The darkest cells show a direct causal relationship. The medium blue cells reflect an indirect relationship via one connecting indicator, and the lightest blue cells are indirect via two connecting indicators. The grey cells indicate an indirect relationship could exist via more than two indicators, or there may be no relationship. The identity cells are white. Network data underlying the figure are provided in Supplementary Table 5.
Fig. 4
Fig. 4. Volume of literature on direct relationships involving governance indicators.
The figure illustrates the number of citations returned from a literature search of titles and abstracts including both indicators for all pairs of indicators where a direct causal relationship was identified and which includes at least one governance indicator. The white space reflects the pairs without an identified causal relationship. Seven indicator pairs have >1,000 returned results (maximum of 10,166) and have been winsorized to 1,000 for visual clarity. The specific counts are shown in Supplementary Table 5.
Fig. 5
Fig. 5. Relevance and trend over time of governance interactions in Ethiopia and Mexico.
A summary of qualitative variables elicited through expert consultation. The figure synthesizes the number of interactions qualitatively plotted according to relevance to transformation towards sustainable food systems (y axis) and whether the strength of the interaction has been increasing, remained the same or been decreasing over the last 10 years (x axis). A total of 63 interactions with governance indicators, identified at global level, was plotted through national expert elicitation considering the country context. A detailed figure plotting all 63 interactions is available in Supplementary Fig. 24.

References

    1. Herrero, M. et al. Articulating the effect of food systems innovation on the Sustainable Development Goals. Lancet Planet. Health5, e50–e62 (2021). - PubMed
    1. Morrison, T. H. et al. Radical interventions for climate-impacted systems. Nat. Clim. Chang.12, 1100–1106 (2022).
    1. Schneider, K. R. et al. The state of food systems worldwide in the countdown to 2030. Nat. Food4, 1090–1110 (2023). - PMC - PubMed
    1. Fanzo, J. C. et al. Viewpoint: rigorous monitoring is necessary to guide food system transformation in the countdown to the 2030 global goals. Food Policy104, 102163 (2021).
    1. Pingali, P. Agricultural policy and nutrition outcomes—getting beyond the preoccupation with staple grains. Food Secur.7, 583–591 (2015).

LinkOut - more resources