. 2025 Jan 14;25(1):56.
doi: 10.1186/s12870-024-06028-x.

The members of zinc finger-homeodomain (ZF-HD) transcription factors are associated with abiotic stresses in soybean: insights from genomics and expression analysis

Affiliations

The members of zinc finger-homeodomain (ZF-HD) transcription factors are associated with abiotic stresses in soybean: insights from genomics and expression analysis

Hafiz Muhammad Rizwan et al. BMC Plant Biol. .

Abstract

Background: Zinc finger homeodomain (ZF-HD) belongs to the plant-specific transcription factor (TF) family and is widely involved in plant growth, development and stress responses. Despite their importance, a comprehensive identification and analysis of ZF-HD genes in the soybean (Glycine max) genome and their possible roles under abiotic stress remain unexplored.

Results: In this study, 51 ZF-HD genes were identified in the soybean genome that were unevenly distributed on 17 chromosomes. All GmZF-HD genes contained a conserved ZF-HD_dimer domain and had diverse physicochemical features. Furthermore, the GmZF-HD gene structures exhibited 3 to 10 conserved motifs, and most of them showed intronless gene structures. Phylogenetic analysis categorized them into eight major groups with the highest closeness to dicots including Brassica rapa and Malus domestica. The cis-element analysis recognized plant growth and development (10%), phytohormones (31%) and stress-responsive (59%) elements. Synteny analysis identified 73 segmental and 1 tandem duplicated genes that underwent purifying selection. The collinearity analysis revealed that GmZF-HD genes showed higher homology with dicot species, indicating common ancestors with close evolutionary relationships. A total of 94 gma-miRNAs from 41 diverse miRNA families were identified, targeting 40 GmZF-HD genes, with GmZF-HD6 being most targeted by 7 miRNAs, and gma-miR4993 emerging as the dominant miRNA family. Different TFs including ERF, LBD, BBR-BPC and MYB, etc., were predicted in all 51 GmZF-HD genes upstream regions and visualized in the network. Expression profiling through RNA-Seq showed diverse expressions of GmZF-HD genes in different tissues including seeds, roots, shoots and leaves under diverse conditions. Further, the qRT-PCR analysis demonstrated that all tested GmZF-HD genes were significantly induced in soybean leaves, mainly the GmZF-HD5/6/13/39 and GmZF-HD45 genes were significantly upregulated (2.5 to 8.8 folds) under the tested stress treatments compared to control, highlighting their potential roles in response to stresses in soybean.

Conclusion: Overall, this study reveals comprehensive insights into the ZF-HD genes in soybeans and provides a valuable contribution towards functional studies for soybean improvement under stress conditions.

Keywords: Abiotic stress; Gene expressions; Micro-RNA; Soybean; Synteny; ZF-HD.


Conflict of interest statement

Declarations. Ethics approval and consent to participate: All experimental research on plants, including the collection of plant materials has been used by following the relevant institutional, national, and international guidelines and legislation. Competing interests: The authors declare no competing interests.

Figures
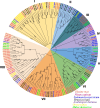
Fig. 1
Fig. 1
Neighbor-joining (NJ) phylogenetic tree based on the amino acid sequences alignment among Arabidopsis thaliana (AtZF-HD), Glycine max (GmZF-HD), Oryza sativa (OsZF-HD), and Solanum lycopersicum (SlZF-HD), Malus domestica (MdZF-HD), Brassica rapa (BrZF-HD) and Pisum sativum (PsZF-HD) sequences with 1000 bootstraps. All the ZF-HD members were divided into 8 groups and presented in different colors
Fig. 2
Fig. 2
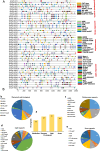
The gene structure, domain, and motif analysis of GmZF-HD genes. A Unrooted neighbor-joining phylogenetic tree among GmZF-HD proteins and clustered into VI clades, B Ten conserved motifs were represented via boxes, and different colors represent different motifs, C Conserved domain in GmZF-HD, D GmZF-HD gene structures; yellow color represent the exons (CDS), green color represents the untranslated 5′ and 3′-regions, and gray color indicates the introns
Fig. 3
Fig. 3
The cis-regulatory element analysis in GmZF-HD genes (A-B), sum number of GmZF-HD genes involved in four categories of cis-elements (Ba), percentage (%) ratio of the numerous cis-elements from each category is presented in pie charts including plant growth and development (Bb), phytohormones-responsive (Bc), light-responsive (Bd) and stress-responsive (Be)
Fig. 4
Fig. 4
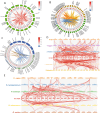
Circos illustrations of GmZF-HD gene duplication and multicollinearity analysis. A Gene duplication of ZF-HD genes in G. max (GmZF-HD). B Orthologous of GmZF-HD genes with AtZF-HD genes (A. thaliana) and MdZF-HD genes (M. domestica) and BrZF-HD genes (B. rapa). C Orthologous of GmZF-HD genes with OsZF-HD genes (O. sativa), SlZF-HD genes (S. lycopersicum) and PsZF-HD genes (P. sativum). The background gray lines show all the syntenic blocks among genomes and different colored connected lines show duplication link regions among the ZF-HD genes. The first ring from outside indicates the approximate location of ZF-HD genes and are labeled with a short gray line outside with gene names. The second and third rings from the outside represent the density of genes on the chromosomes. The blue-to-red scale bar indicates the number of SNPs within 1 Mb window size. D-E Multicollinearity analysis of GmZF-HD genes with the genomes of the different plant species including A. thaliana, B. rapa, P. vulgaris, M. domestica, P. sativum, C. cajan, S. tuberosum, O. sativa, S. lycopersicum and V. unguiculata species. The red lines represent the GmZF-HD syntenic genes between other species genomes and the gray lines in the background represent all of the orthologous genes from the above species genomes. The detailed results information can be found in Table S5-6
Fig. 5
Fig. 5
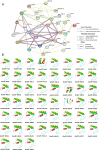
Protein–protein interaction and predicted 3D models of GmZF-HD proteins. A The network was constructed using online STRING software. The proteins are displayed at network nodes with 3D structure of the proteins within nodes and the colors of the lines indicate different data sources. The higher the interaction coefficient, the thicker the network lines between proteins and vice versa. B Predicted 3D models of GmZF-HD proteins by homology modeling using the online Phyre2 server with default mode
Fig. 6
Fig. 6
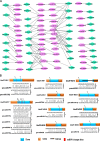
The putative miRNA targeted GmZF-HD genes. A Network illustration of predicted miRNA targeting GmZF-HD genes. Green color boxes represent GmZF-HD genes and lavender color boxes represent miRNAs. B The schematic diagram indicates the GmZF-HD genes targeted by miRNAs
Fig. 7
Fig. 7
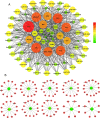
Putative transcription factor in GmZF-HD genes and regulatory network analysis. A Green to dark red color shows (low to high) enrichment, lines represent the co-expression network between genes and TFs and node size represents the degree of interaction and enrichment between genes and TFs. B Top 10 highly enriched and targeted GmZF-HD genes with TFs, green nodes represent the TFs and red colors show the GmZF-HD genes
Fig. 8
Fig. 8
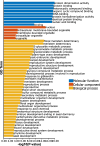
GO annotation analyses of GmZF-HD genes. A Highly enriched GO terms in GmZF-HD genes including molecular (blue color), biological (red–orange color) and cellular (yellow-orange). Further detailed annotation results and numerous significantly enriched terms can be found in Table S11
Fig. 9
Fig. 9
FPKM-based expression profiles of GmZF-HD genes in different tissues including seeds, roots, leaves and shoots under different conditions. FPKM values were transformed by log2FC, and heatmaps were constructed using TBtools software. The side scale bar represents the expression profile from lowest (blue) to highest (red)
Fig. 10
Fig. 10
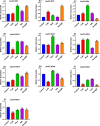
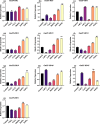
qRT-PCR-based relative expressions of GmZF-HD genes in soybean leave tissues under control, cold, heat, salt and drought treatments. The relative gene expression levels were calculated using the 2–ΔΔct. Vertical bars represent means ± SD (n = 3). The asterisks *, **, and *** show significance levels at p ≤ 0.05, p ≤ 0.01, and p ≤ 0.001 and ns means non-significant among treatment and control samples according to the Students t-test
Fig. 11
Fig. 11
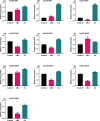
qRT-PCR-based relative expressions of GmZF-HD genes in soybean leave tissues under control, ABA and SA treatments. The relative gene expression levels were calculated using the 2–ΔΔct. Vertical bars represent means ± SD (n = 3). The asterisks *, **, and *** show significance levels at p ≤ 0.05, p ≤ 0.01, and p ≤ 0.001 and ns means non-significant among treatment and control samples according to the Students t-test
Fig. 12
Fig. 12
qRT-PCR-based relative expressions of GmZF-HD genes in soybean leave tissues under control, CdCl2, CoCl2, FeSO4, MnSO4, and ZnSO4 treatments. The relative gene expression levels were calculated using the 2–ΔΔct. Vertical bars represent means ± SD (n = 3). The asterisks *, **, and *** show significance levels at p ≤ 0.05, p ≤ 0.01, and p ≤ 0.001 and ns means non-significant among treatment and control samples according to the Students t-test

Similar articles

References

    1. Goettel W, Zhang H, Li Y, Qiao Z, Jiang H, Hou D, Song Q, Pantalone VR, Song B-H, Yu D. POWR1 is a domestication gene pleiotropically regulating seed quality and yield in soybean. Nat Commun. 2022;13(1):3051. - PMC - PubMed
    1. Gavili E, Moosavi AA, Haghighi AAK. Does biochar mitigate the adverse effects of drought on the agronomic traits and yield components of soybean? Ind Crops Prod. 2019;128:445–54.
    1. Shaffique S, Hussain S, Kang S-M, Imran M, Kwon E-H, Khan MA, Lee I-J. Recent progress on the microbial mitigation of heavy metal stress in soybean: overview and implications. Front Plant Sci. 2023;14:1188856. - PMC - PubMed
    1. Deshmukh R, Sonah H, Patil G, Chen W, Prince S, Mutava R, Vuong T, Valliyodan B, Nguyen HT. Integrating omic approaches for abiotic stress tolerance in soybean. Front Plant Sci. 2014;5:244. - PMC - PubMed
    1. Raza A, Bashir S, Khare T, Karikari B, Copeland RG, Jamla M, Abbas S, Charagh S, Nayak SN, Djalovic I. Temperature-smart plants: A new horizon with omics-driven plant breeding. Physiol Plant. 2024;176(1):e14188.

LinkOut - more resources