. 2025 Jan 15;25(1):57.
doi: 10.1186/s12870-025-06053-4.

Genome-wide identification and functional roles relating to anthocyanin biosynthesis analysis in maize

Affiliations

Genome-wide identification and functional roles relating to anthocyanin biosynthesis analysis in maize

Xiaofang Wang et al. BMC Plant Biol. .

Abstract

Background: Anthocyanin is an important class of water-soluble pigments that are widely distributed in various tissues of plants, and it not only facilitates diverse color changes but also plays important roles in various biological processes. Maize silk, serving as an important reproductive organ and displaying a diverse range of colors, plays an indispensable role in biotic resistance through its possession of anthocyanin. However, the copy numbers, characteristics, and expression patterns of genes involved in maize anthocyanin biosynthesis are not fully understood. In this study, gene numbers, distribution, structure, cis-elements of the anthocyanin synthetic gene family were identified, and then the potential transcriptional factors were predicted by two analyzed methods. Finally, genes involved in maize silk pigment were screened by un-targeted metabolism analysis.

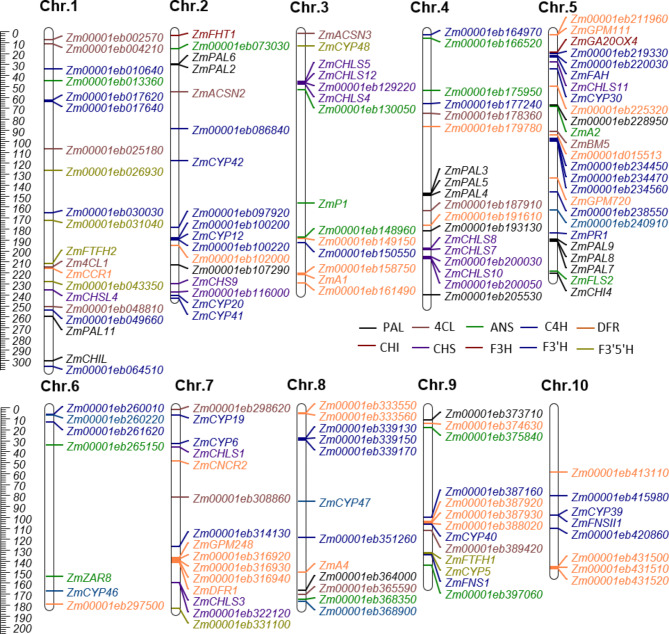
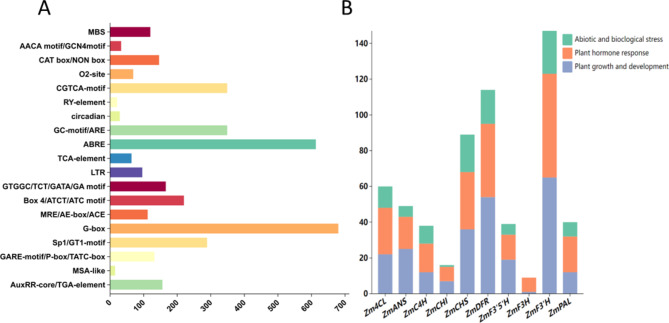
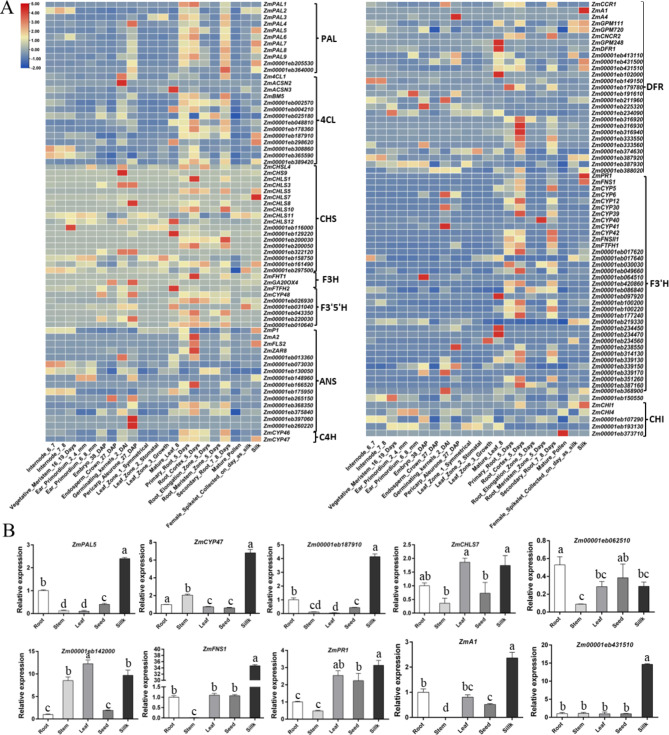
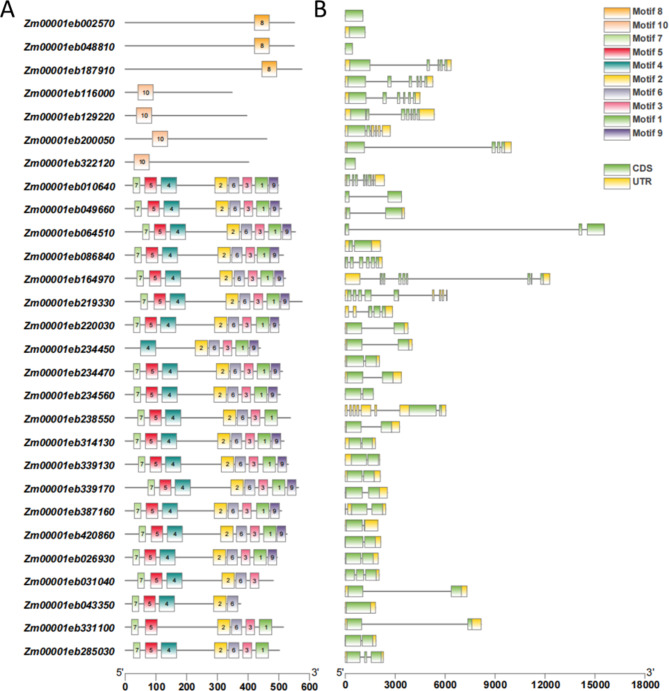
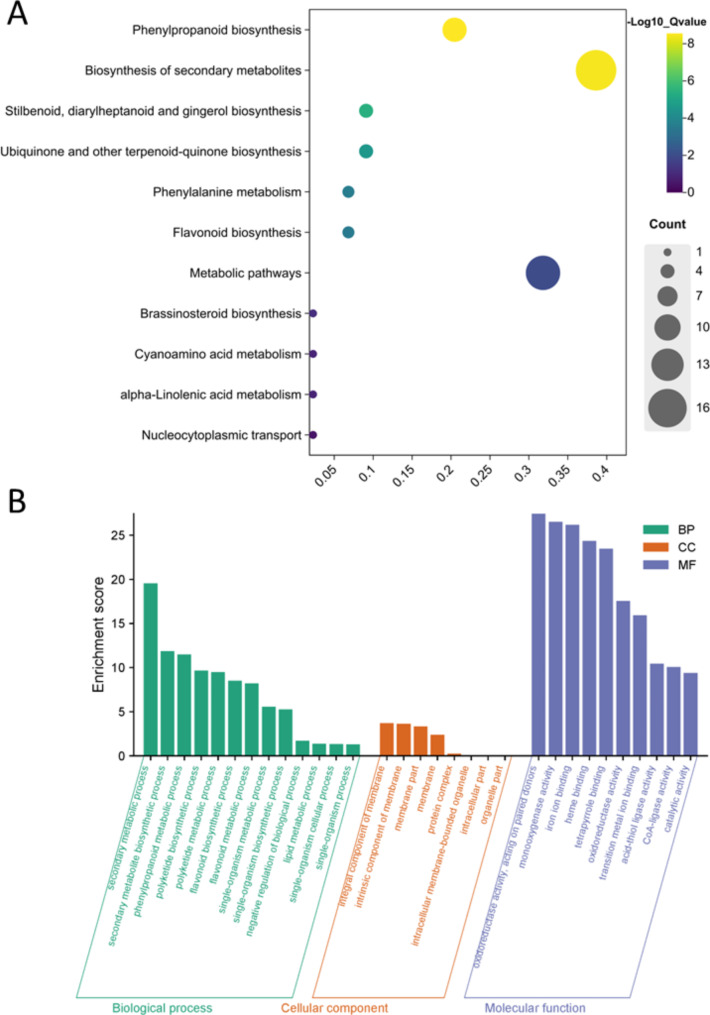
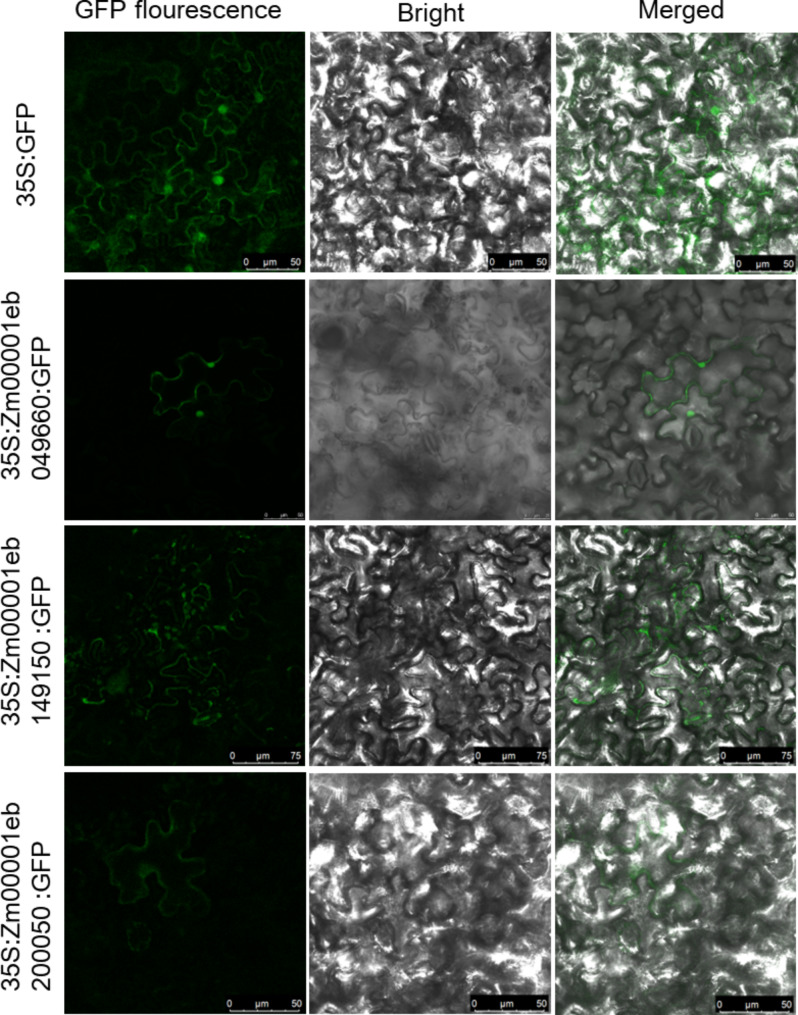
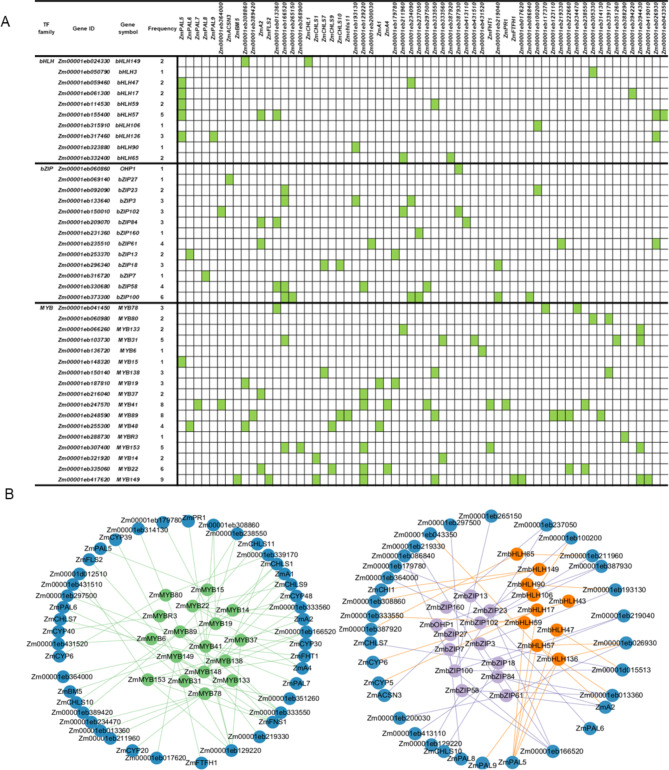
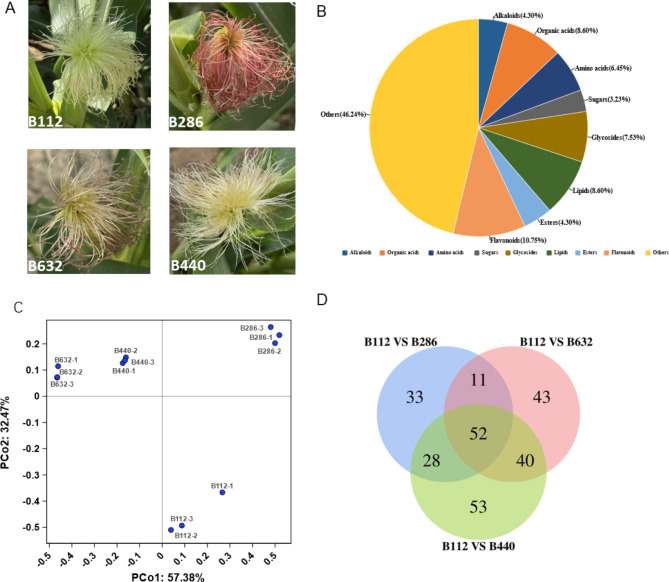
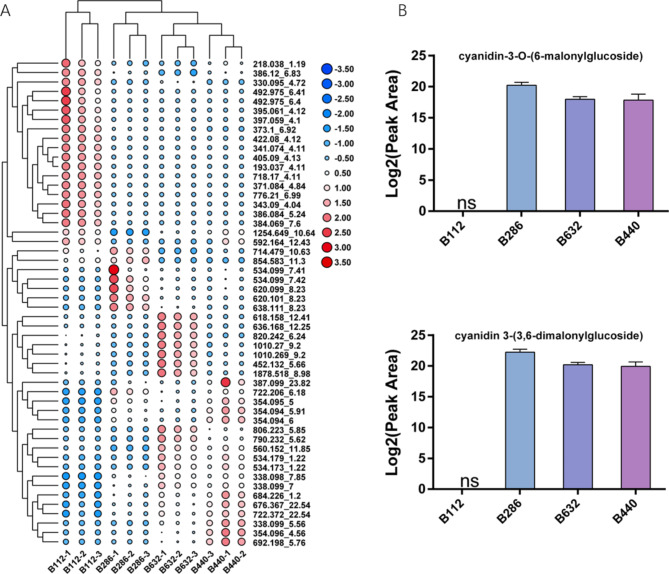
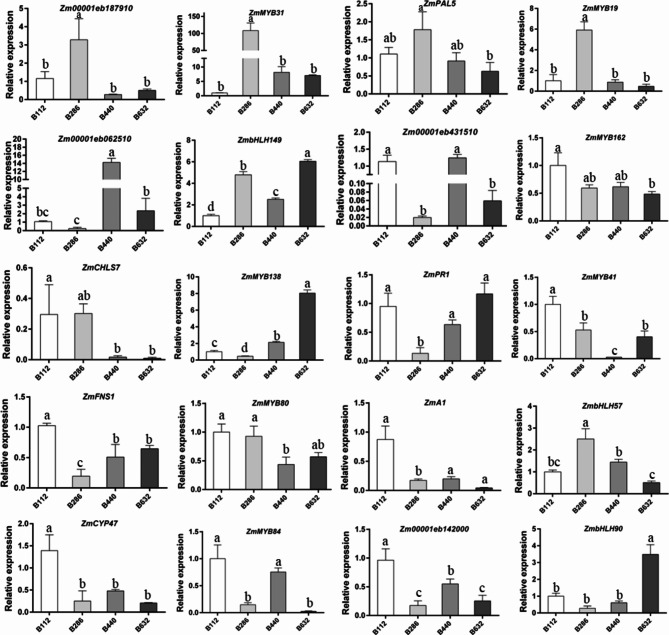
Results: Ten gene families involved in the maize anthocyanin biosynthesis pathway were identified, and 142 synthetic genes were obtained. These anthocyanin biosynthetic genes have high copy numbers and are normally clustered on chromosomes. The promoters of these synthetic genes contain various cis-elements and the gene expression patterns and transcriptional regulatory networks were analyzed. These genes are distributed on different chromosomes and gene expression patterns vary across different tissues in maize. Specifically, these genes often exhibit higher expression in the stem, leaves, and seeds. Ten highly expressed genes in silks were identified. Based on un-targeted metabolites detection in the silks of four maize representative inbred lines with different colors, two main differential anthocyanin components were identified. Furthermore, the gene expression patterns of the ten highly expressed genes and their potential interacting transcriptional factors were analyzed across the four inbred lines.

Conclusions: The results in this study show a through picture of maize anthocyanin synthetic genes, and the structure and function of genes related to anthocyanin biosynthesis in maize could be further investigated.

Keywords: Anthocyanin; Biosynthetic genes; Gene expression; Maize; Silk.


Conflict of interest statement

Declarations. Ethics approval and consent to participate: Not applicable. Consent for publication: Not applicable. Competing interests: The authors declare no competing interests. Clinical trial number: Not applicable.

Figures

Fig. 1
Fig. 1
The genes’ distribution in the anthocyanin biosynthesis pathway in the maize genome. Chromosome numbers are shown on the left side of each chromosome. Genes are labeled on the right side of the chromosome. Characters with different colors represent ten types of anthocyanin biosynthetic genes. The leftmost scale bar represents the chromosome length (Mb)
Fig. 2
Fig. 2
The cis-elements identified within 2.0 kb promoter regions of anthocyanin biosynthetic genes using Plant CARE. (A) The number of cis-elements identified by Plant CARE. (B) Three most frequent categories of cis-acting elements in biosynthetic genes
Fig. 3
Fig. 3
Gene expression in the anthocyanin biosynthesis pathway in different tissue types. (A) Heat map representation of biosynthetic genes across various tissues and developmental stages. The FPKM values were transformed in log2, and a heat map was generated using TB tool software. The bar at the side represents log2 transformed values. (B) The qRT-PCR analysis of genes in five tissues. The error bars indicate the mean ± SD (n = 3)
Fig. 4
Fig. 4
Analysis of conserved motifs and gene structure in anthocyanin biosynthetic genes in maize. (A) The motif composition of anthocyanin biosynthesis-related genes was analyzed and depicted using colored boxes to represent ten distinct conserved motifs. (B) The gene structures were examined, highlighting the arrangement of introns and exons in these genes. The representation provides insight into the structural features associated with anthocyanin synthesis
Fig. 5
Fig. 5
KEGG pathway and GO functional enrichment analysis. (A) KEGG pathway enrichment analysis of the relevant genes. The paths are represented by points on the vertical axis, with the enrichment factor shown on the horizontal axis and point sizes indicating the number of genes involved. The top 20 enriched pathways are displayed, with p-values < 0.05. (B) GO functional analysis of genes, showing enrichment in biological processes, cellular components, and molecular functions
Fig. 6
Fig. 6
Subcellular localization of GFP fusion proteins. The GFP fusion proteins 35 S-GFP, Zm00001eb049660, Zm00001eb149150, and Zm00001eb200050 were transiently expressed in Nicotiana benthamiana epidermal cells. Fluorescence microscopy images are shown with a scale bar of 50 μm
Fig. 7
Fig. 7
Prediction of transcriptional regulatory networks between the anthocyanin biosynthetic genes and TFs using RNA-Seq data. (A) Regulatory relationship of the three main types of the TF and all the corresponding monolignol biosynthetic genes generated. Green blocks represent statistically significant interactions. (B) Regulatory network of the three main types of the TFs and the corresponding specific monolignol biosynthetic genes. The dark blue nodes represent monolignol biosynthetic genes. Green, purple, and orange nodes are TFs
Fig. 8
Fig. 8
Detection of un-targeted metabolites in the silks with different colors in the four representative maize inbred lines. (A) The silk color phenotype of the four inbred lines. (B) The classification of all the identified metabolites. (C) PCA analysis result of all the identified metabolites. (D) The Venn Diagram of the differential metabolites’ numbers after comparing the detecting results of the four inbred lines
Fig. 9
Fig. 9
Analysis of the differential metabolites in silks of the four inbred lines. (A) Heatmap of the 52 Identified differential metabolites in silks of the four inbred lines. (B) The content of the two main differential anthocyanin components in the four inbred lines
Fig. 10
Fig. 10
Gene expression patterns of ten biosynthetic genes and predicted TFs in silks of the four inbred lines. The expression values were presented in fold change

Similar articles

Cited by

References

    1. Wang Z, Nelson DR, Zhang J, Wan X, Peters RJ. Plant (di)terpenoid evolution: from pigments to hormones and beyond. Nat Prod Rep. 2023;40(2):452–69. - PMC - PubMed
    1. Wang LS, Stoner GD. Anthocyanins and their role in cancer prevention. Cancer Lett. 2008;269(2):281–90. - PMC - PubMed
    1. Khoo HE, Azlan A, Tang ST, Lim SM. Anthocyanidins and anthocyanins: colored pigments as food, pharmaceutical ingredients, and the potential health benefits. Food Nutr Res. 2017;61(1):1361779. - PMC - PubMed
    1. Dixon RA. Stress-lnduced Phenylpropanoid Metabolism. Plant Cell. 1995;7(7):1085–97. - PMC - PubMed
    1. Winkel-Shirley B. Biosynthesis of flavonoids and effects of stress Brenda Winkel-Shirley. Curr Opin Plant Biol. 2002;5(3):218–23. - PubMed

LinkOut - more resources