

Creatinine production rate is an integrative indicator to monitor muscle status in critically ill patients
- PMID: 39810218
- PMCID: PMC11731194
- DOI: 10.1186/s13054-024-05222-5
Creatinine production rate is an integrative indicator to monitor muscle status in critically ill patients
Abstract
Background: Both quantitative and qualitative aspects of muscle status significantly impact clinical outcomes in critically ill patients. Comprehensive monitoring of baseline muscle status and its changes is crucial for risk stratification and management optimization. However, repeatable and accessible indicators are lacking. We hypothesized that creatinine production rate (CPR) could serve as an integrative indicator of skeletal muscle status.
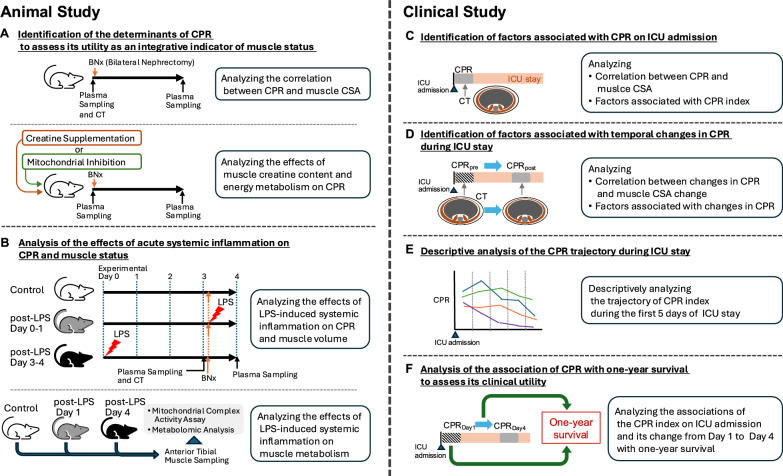
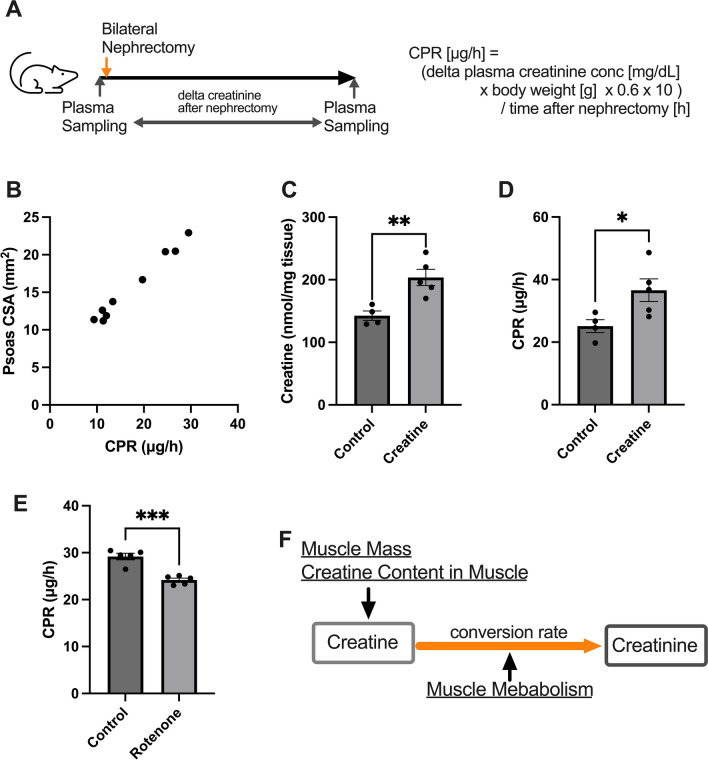
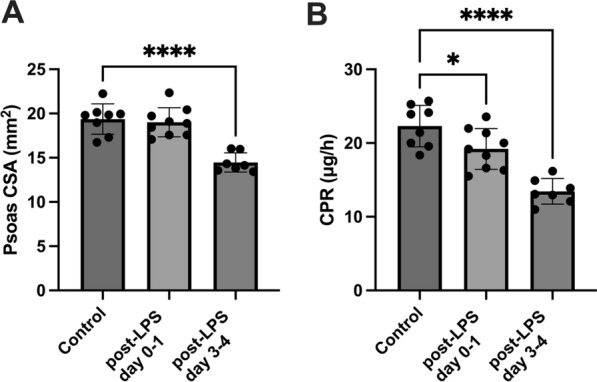
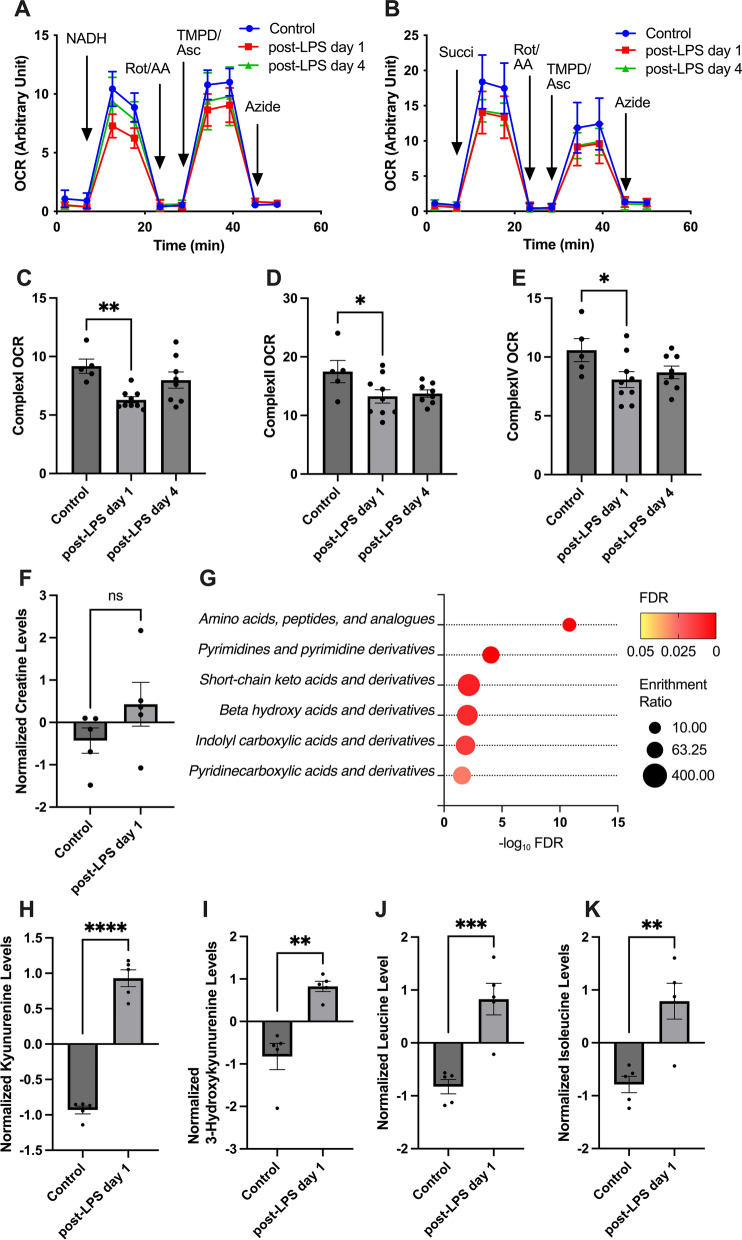
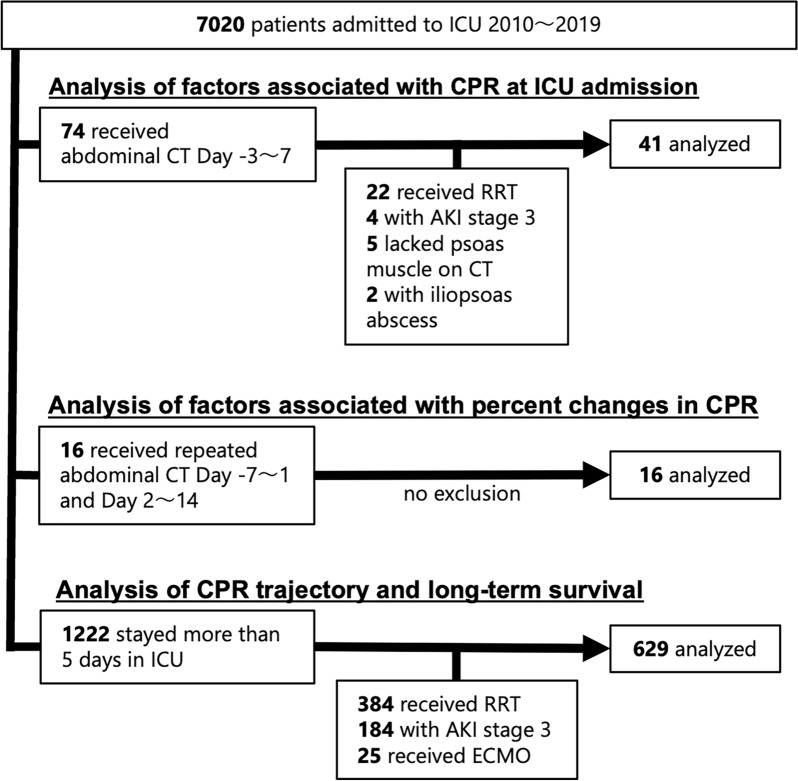
Methods: We conducted a series of animal and clinical studies. First, animal experiments were performed to determine whether CPR reflects not only muscle volume, but also qualitative muscle properties. We also evaluated the effects of acute systemic inflammation, a common feature of critical illness, on CPR, as well as its impact on muscle volume and metabolism. In clinical studies, we analyzed CPR, calculated based on urinary creatinine excretion and changes in serum creatinine, of critically ill patients. We assessed the factors affecting CPR on ICU admission and its temporal changes. Finally, we evaluated the clinical utility of CPR by examining the associations of the CPR index (CPR divided by height squared) on ICU admission and its changes with one-year survival.
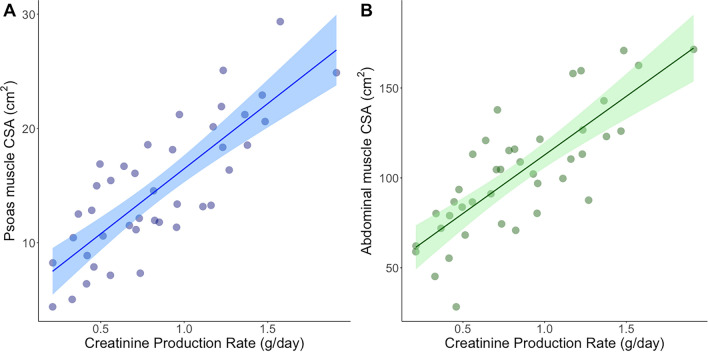
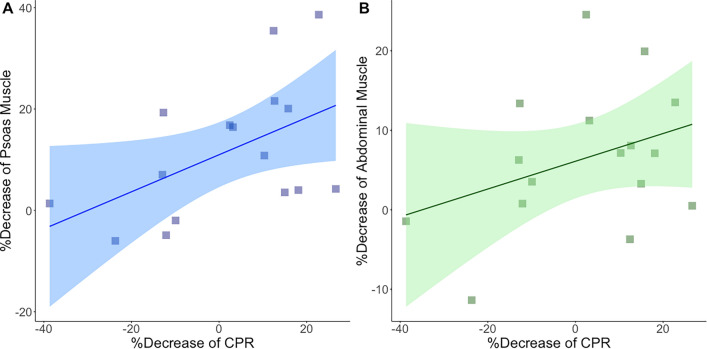
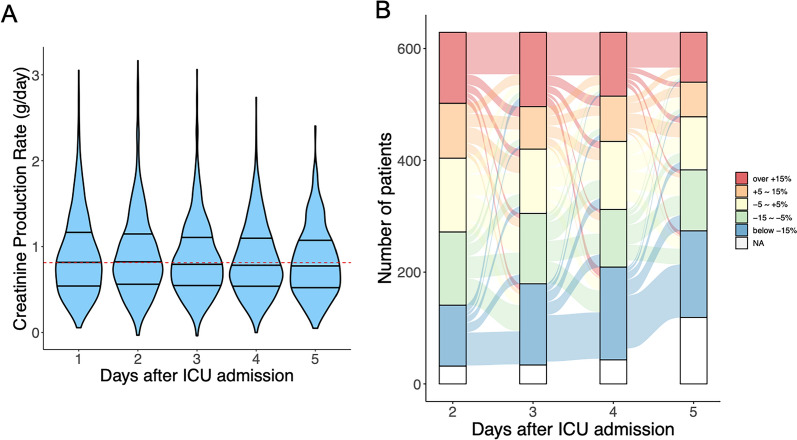
Results: Animal studies revealed that CPR is determined by muscle volume, creatine content, and metabolic status. Systemic inflammation accompanied by muscle loss led to reduced CPR. Moreover, even without muscle loss, systemic inflammation decreased CPR, likely due to metabolic derangements. In ICU patients, CPR on admission strongly correlated with muscle cross-sectional area (CSA), with age and sex as additional significant factors. In contrast, the percent change in CPR showed a weak correlation with muscle CSA changes. Additionally, the acute-phase CPR trajectories did not show a consistent decline, suggesting multifactorial influences. In a cohort of 629 ICU patients, lower baseline CPR index (hazard ratio [HR] 1.125 per 0.1 g/day/m2 less, P < .001) and a decrease in CPR over the first three days (HR 1.028 per 5%, P = 0.032) were independently associated with higher one-year mortality.
Conclusions: CPR represents an integrative indicator of skeletal muscle status in critically ill patients, reflecting both quantitative and qualitative aspects. Monitoring CPR in the ICU may facilitate risk stratification and optimization of patient care.
Keywords: Creatinine; Critical care; Mitochondrial dysfunction; Sarcopenia.
© 2025. The Author(s).
Conflict of interest statement
Declarations. Ethics approval and consent to participate: The clinical study protocol received ethical approval from the Yokohama City University Ethics Research Committee (B201200066 and B210100043; Detailed information is provided in Supplemental Text 1). Ethical approval for the animal experiments (F-A-22-031) was obtained from the Institutional Animal Care and Use Committee of Yokohama City University. All experiments were performed according to ARRIVE guidelines [43]. Consent for publication: The review board waived the need for informed consent due to the retrospective observational study design. Competing interests: The authors declare that they have no competing interests.
Figures
Similar articles
-
Time course of plasma urea and urinary urea excretion in patients with a prolonged ICU stay.Sci Rep. 2024 Oct 28;14(1):25779. doi: 10.1038/s41598-024-74579-y. Sci Rep. 2024. PMID: 39468058 Free PMC article.
-
[Dynamic changes of diaphragm and limb skeletal muscle in patients with sepsis assessed by bedside ultrasound and their correlation with blood urea/creatinine ratio].Zhonghua Wei Zhong Bing Ji Jiu Yi Xue. 2024 Jun;36(6):643-648. doi: 10.3760/cma.j.cn121430-20230803-00577. Zhonghua Wei Zhong Bing Ji Jiu Yi Xue. 2024. PMID: 38991965 Chinese.
-
The urea-to-creatinine ratio as an emerging biomarker in critical care: a scoping review and meta-analysis.Crit Care. 2025 May 2;29(1):175. doi: 10.1186/s13054-025-05396-6. Crit Care. 2025. PMID: 40317012 Free PMC article.
-
Evaluation of clinically available renal biomarkers in critically ill adults: a prospective multicenter observational study.Crit Care. 2017 Mar 7;21(1):46. doi: 10.1186/s13054-017-1626-0. Crit Care. 2017. PMID: 28264714 Free PMC article.
-
Muscle Mass Loss in the Older Critically Ill Population: Potential Therapeutic Strategies.Nutr Clin Pract. 2020 Aug;35(4):607-616. doi: 10.1002/ncp.10540. Epub 2020 Jun 24. Nutr Clin Pract. 2020. PMID: 32578900 Review.
Cited by
-
Lipidomics and biochemical profiling of adult Yili horses in a 26 km endurance race: exploring metabolic adaptations.Front Vet Sci. 2025 Apr 22;12:1597739. doi: 10.3389/fvets.2025.1597739. eCollection 2025. Front Vet Sci. 2025. PMID: 40331217 Free PMC article.
-
Albumin-To-Creatinine Ratio Underestimates True 24-Hour Albuminuria in Obesity: Clinical Relevance for Vascular Risk Stratification.Diabetes Metab Res Rev. 2025 Jul;41(5):e70064. doi: 10.1002/dmrr.70064. Diabetes Metab Res Rev. 2025. PMID: 40557880 Free PMC article.
References
-
- Brealey D, et al. Association between mitochondrial dysfunction and severity and outcome of septic shock. Lancet. 2002;360:219–23. - PubMed
MeSH terms
Substances
Grants and funding
LinkOut - more resources
Full Text Sources
