. 2025 Feb;16(1):e13668.
doi: 10.1002/jcsm.13668.

Local Inflammation Precedes Diaphragm Wasting and Fibrotic Remodelling in a Mouse Model of Pancreatic Cancer

Affiliations

Local Inflammation Precedes Diaphragm Wasting and Fibrotic Remodelling in a Mouse Model of Pancreatic Cancer

Daria Neyroud et al. J Cachexia Sarcopenia Muscle. 2025 Feb.

Abstract

Background: Cancer cachexia represents a debilitating muscle wasting condition that is highly prevalent in gastrointestinal cancers, including pancreatic ductal adenocarcinoma (PDAC). Cachexia is estimated to contribute to ~30% of cancer-related deaths, with deterioration of respiratory muscles suspected to be a key contributor to cachexia-associated morbidity and mortality. In recent studies, we identified fibrotic remodelling of respiratory accessory muscles as a key feature of human PDAC cachexia.

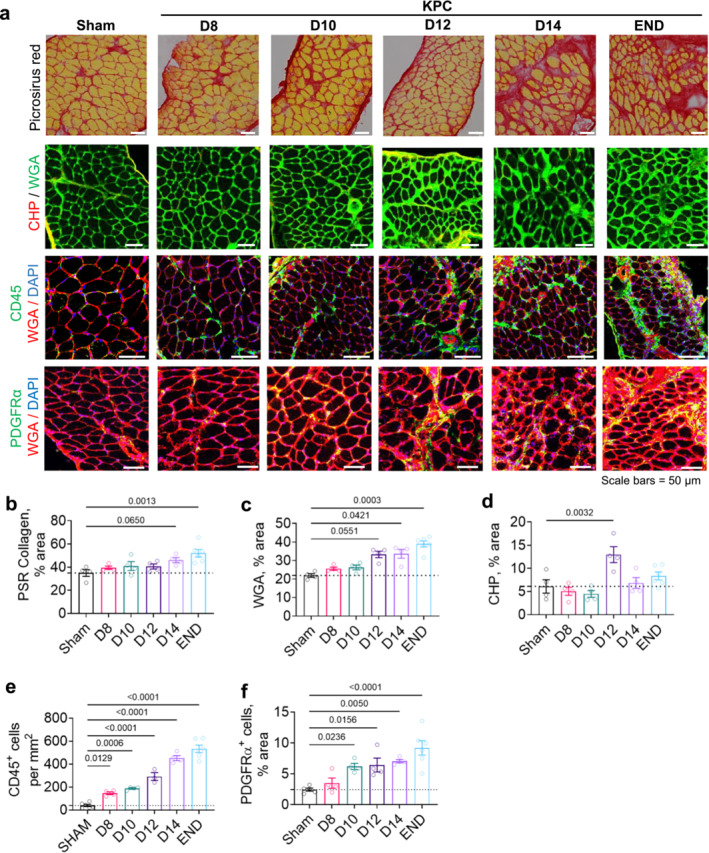
Methods: To gain insight into mechanisms driving respiratory muscle wasting and fibrotic remodelling in response to PDAC, we conducted temporal histological and transcriptomic analyses on diaphragm muscles harvested from mice-bearing orthotopic murine pancreatic (KPC) tumours at time points reflective of precachexia (D8 and D10), mild-moderate cachexia (D12 and D14) and advanced cachexia (endpoint).

Results: During the precachexia phase, diaphragms showed significant leukocyte infiltration (+3-fold to +13-fold; D8-endpoint vs. Sham, p < 0.05) and transcriptomic enrichment of inflammatory processes associated with tissue injury that remained increased through endpoint. Diaphragm inflammation was followed by increases in PDGFR-ɑ+ fibroadipogenic progenitors (+2.5 to +3.8-fold; D10-endpoint vs. Sham, p < 0.05), fibre atrophy (-16% to -24%, D12 to endpoint vs. Sham, p < 0.05), ECM expansion (+1.5 to +1.8-fold; D14-endpoint vs. Sham, p < 0.05), collagen accumulation (+3.8-fold; endpoint vs. Sham, p = 0.0013) and reductions in breathing frequency (-55%, p = 0.0074) and diaphragm excursion (-43%, p = 0.0006). These biological processes were supported by changes in the diaphragm transcriptome. Ingenuity pathway analysis predicted factors involved in inflammatory responses to tissue injury, including TGF-β1, angiotensin and PDGF BB, as top upstream regulators activated in diaphragms prior to and throughout cachexia progression, while PGC-1α and the insulin receptor were among the top upstream regulators predicted to be suppressed. The transcriptomic dataset further revealed progressive disturbances to networks involved in lipid, glucose and oxidative metabolism, activation of the unfolded protein response and neuromuscular junction remodelling associated with denervation.

Conclusions: In summary, our data support leukocyte infiltration and expansion of PDGFRα mesenchymal progenitors as early events that precede wasting and fibrotic remodelling of the diaphragm in response to PDAC that may also underlie metabolic disturbances, weakness and respiratory complications.

Keywords: cancer cachexia; inflammatory response; muscle atrophy; muscle fibrosis; pancreatic cancer.


Conflict of interest statement

The authors declare no conflicts of interest.

Figures

FIGURE 1
FIGURE 1
Orthotopic KPC tumours induce progressive body wasting associated with declines in skeletal muscle, heart and fat mass. Orthotopic injection of murine pancreatic cancer (KPC) cells induces exponential growth of KPC tumours (a) and causes progressive declines in body mass (b) associated with wasting of skeletal muscles (c–e) and fat (f). Cachexia, based on significant wasting of skeletal muscle tissues and reduced body mass, was first observed on D12. All p‐values < 0.1 are included, symbols represent individual data and bars represent mean ± SE.
FIGURE 2
FIGURE 2
Reductions in breathing frequency and diaphragm excursion are associated with progressive diaphragm myofiber atrophy and alterations in fibre‐type composition. (a) Representative ultrasonographic traces depicting diaphragm movements recorded in a nontumour bearing Sham mouse and a mouse bearing a pancreatic (KPC) tumour at humane endpoint. (b‐d) KPC tumour burden leads to reductions in respiratory rate (b), diaphragm excursion (c) and estimated minute ventilation (d). (e) Representative images of diaphragm cross‐sections stained with haematoxylin and eosin (H&E) or with antibodies against wheat germ agglutinin (WGA) to label muscle fibre borders and myosin heavy chain I (MyHCI) and myosin heavy chain IIA (MyHCIIA) to distinguish between Type I (green), Type IIA (blue) and Type IIX/B (black) myofibers. (f) Quantification of diaphragm minimum Feret diameter (MFD) reveals KPC‐induced diaphragm fibre atrophy beginning at the time of cachexia onset (D12). All p‐values < 0.1 are included, symbols represent individual data and bars represent mean ± SE.
FIGURE 3
FIGURE 3
Immune cell infiltration and expansion of FAPs precede KPC‐induced diaphragm atrophy and fibrotic remodelling. (a) Representative images of diaphragm cross‐sections from Sham and KPC mice (D8, D10, D12, D14, END) stained with Picrosirius red to label collagen (red), a collagen hybridising peptide (CHP) to label unfolded/degraded collagen, an anti‐CD45 antibody to label leukocytes and an anti‐PDGFRɑ antibody to label fibroadipogenic progenitors (FAPs). Note that some cross‐sections were co‐stained with DAPI to label nuclei and wheat germ agglutinin (WGA), which labels glycosylated proteins abundant in myofiber membranes and in the extracellular matrix. (b) KPC tumours induce significant deposition of collagen at endpoint (END) that is preceded by extracellular matrix expansion (% WGA+ area) (c) and collagen damage/remodelling (% CHP+ area) (d). (e) Increased numbers of CD45+ leukocytes are observed in diaphragm muscles of KPC mice as early as D8, prior to cachexia development and extracellular matrix remodelling, and show an exponential (r 2 = 0.9126) increase thereafter. (f) Expansion of PDGFR+ FAPs in diaphragm muscles of KPC mice is observed during the precachectic stage on D10, following leukocyte infiltration, and progressively increases through endpoint. All p‐values < 0.1 are included, symbols represent individual data and bars represent mean ± SE.
FIGURE 4
FIGURE 4
Biological processes and pathways enriched in the diaphragm throughout the development and progression of KPC‐induced cachexia. RNA sequencing was conducted on diaphragm from Sham mice and KPC mice at time points reflective of precachexia (D8, D10) and cachexia (D12, D14, END). Bioinformatic enrichment analyses using the DAVID platform were performed on genes demonstrating a significant (padj. < 0.01) twofold upregulation (a) or downregulation (b) in diaphragms of KPC mice (vs. Sham) at each time point.
FIGURE 5
FIGURE 5
Ingenuity Pathway Analysis (IPA) of diaphragm RNAseq data identifies top upstream regulators predicted to drive transcriptional changes throughout the progression of PDAC cachexia. Top 15 upstream regulators predicted by IPA to be suppressed (a) or activated (b) in diaphragm muscles of KPC mice (vs. Sham) at the time point when cachexia and diaphragm atrophy are first observed (D12). Z‐scores are shown for upstream regulators at all time points, including those reflective of precachexia (D8 and D10) and cachexia (D12, D14 and END).
FIGURE 6
FIGURE 6
Hierarchical clustering of diaphragm RNAseq data reveals gene clusters with unique biological functions and temporal dynamics throughout PDAC cachexia progression. Hierarchical clustering analysis performed on genes differentially expressed (DEG, padj. <0.01) in the diaphragm of KPC mice (vs. Sham) at one time point or more revealed eight major gene clusters with unique temporal profiles. Bioinformatic enrichment analyses using DAVID and Enrichr were performed on each gene cluster to identify top nonredundant enriched biological processes (DAVID), KEGG pathways (DAVID) and ChEA signature profiles (Enrichr) on clusters showing an overall upregulation (a) or downregulation (b) throughout the cachexia trajectory. Insets depict the average gene expression in diaphragm of KPC mice vs. Sham (red lines) for each cluster on D8, D10, D12, D14 and END.
FIGURE 7
FIGURE 7
Heatmaps depicting gene expression changes for pathways linked to diaphragm wasting and pathological remodelling prior to and throughout KPC‐induced cachexia. Manually curated genes of interest from the RNAseq dataset showing differential expression of genes involved in glucose uptake, glycolysis and oxidative metabolism (a), lipid storage and breakdown (b), cholesterol/steroid biosynthesis (c), inflammation (d), endothelial dysfunction and ECM remodelling (e) and muscle atrophy‐related pathways (f), including autophagy, neuromuscular junction (NMJ) remodelling associated with denervation, ubiquitin‐dependent protein degradation, endoplasmic reticulum stress and the unfolded protein response (UPR). All data represent Log2FC vs. Sham.
FIGURE 8
FIGURE 8
Schematic summary depicting the sequence of events linked to muscle wasting and pathological remodelling of the diaphragm in response to pancreatic cancer. The events depicted are based upon transcriptomic or histological analyses of the mouse diaphragm at various time points throughout cachexia progression in an orthotopic model of PDAC that utilises murine KPC cells. D0–18 = 0–18 days after surgery, ECM = extracellular matrix, ER = endoplasmic reticulum, NMJ = neuromuscular junction.

References

    1. Fearon K., Arends J., and Baracos V., “Understanding the Mechanisms and Treatment Options in Cancer Cachexia,” Nature Reviews Clinical Oncology 10 (2013): 90–99. - PubMed
    1. Bachmann J., Heiligensetzer M., Krakowski‐Roosen H., Buchler M. W., Friess H., and Martignoni M. E., “Cachexia Worsens Prognosis in Patients With Resectable Pancreatic Cancer,” Journal of Gastrointestinal Surgery 12 (2008): 1193–1201. - PubMed
    1. Argiles J. M., Stemmler B., Lopez‐Soriano F. J., and Busquets S., “Inter‐Tissue Communication in Cancer Cachexia,” Nature Reviews. Endocrinology 15 (2018): 9–20. - PubMed
    1. Baracos V. E., Martin L., Korc M., Guttridge D. C., and Fearon K. C. H., “Cancer‐Associated Cachexia,” Nature Reviews Disease Primers 4 (2018): 17105. - PubMed
    1. Nemer L., Krishna S. G., Shah Z. K., et al., “Predictors of Pancreatic Cancer‐Associated Weight Loss and Nutritional Interventions,” Pancreas 46 (2017): 1152–1157. - PMC - PubMed