. 2024 Aug 14:2:1-18.
doi: 10.1162/imag_a_00270. eCollection 2024 Aug 1.

Evaluating the effect of denoising submillimeter auditory fMRI data with NORDIC

Affiliations

Evaluating the effect of denoising submillimeter auditory fMRI data with NORDIC

Lonike K Faes et al. Imaging Neurosci (Camb). .

Abstract

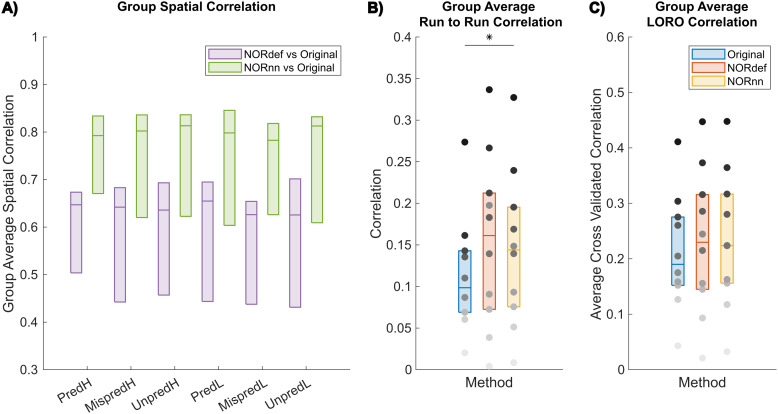
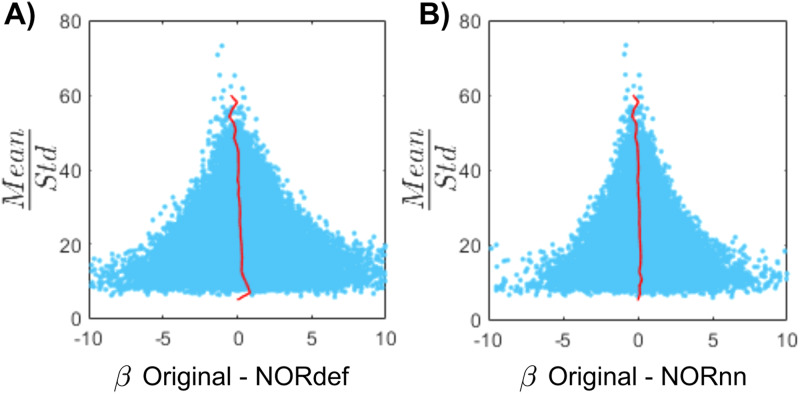
Functional magnetic resonance imaging (fMRI) has emerged as an essential tool for exploring human brain function. Submillimeter fMRI, in particular, has emerged as a tool to study mesoscopic computations. The inherently low signal-to-noise ratio (SNR) at submillimeter resolutions warrants the use of denoising approaches tailored at reducing thermal noise-the dominant contributing noise component in high-resolution fMRI. NOise Reduction with DIstribution Corrected Principal Component Analysis (NORDIC PCA) is one of such approaches, and has been benchmarked against other approaches in several applications. Here, we investigate the effects that two versions of NORDIC denoising have on auditory submillimeter data. While investigating auditory functional responses poses unique challenges, we anticipated NORDIC to have a positive impact on the data on the basis of previous applications. Our results show that NORDIC denoising improves the detection sensitivity and the reliability of estimates in submillimeter auditory fMRI data. These effects can be explained by the reduction of the noise-induced signal variability. However, we did observe a reduction in the average response amplitude (percent signal change) within regions of interest, which may suggest that a portion of the signal of interest, which could not be distinguished from general i.i.d. noise, was also removed. We conclude that, while evaluating the effects of the signal reduction induced by NORDIC may be necessary for each application, using NORDIC in high-resolution auditory fMRI studies may be advantageous because of the large reduction in variability of the estimated responses.

Keywords: NORDIC; auditory neuroscience; denoising; fMRI; high-resolution.


Conflict of interest statement

NORDIC and NIFTI_NORDIC are copyrighted by Regents of the University of Minnesota and covered by issued US patent #10,768,260, and S.M. has a relationship with this patent. S.M. did not evaluate or analyze any of the data in this work.

Figures

Fig. 1.
Fig. 1.
Experimental conditions. The first three tones are contextual eliciting a strong or weak prediction. The three contextual tones of each condition are presented at the same frequencies, albeit in different orders. The fourth tone could be a high or low target frequency. The fourth tone can either consecutively follow the ascending or descending order (PredH and PredL), it could be deviant (MispredH and MispredL) or the contextual tones could be scrambled before presenting the target frequency (UnpredH and UnpredL). The two predictable sequences were presented ten times per run, whereas the other four conditions were presented four times per run. Please note that the precise timing of these conditions is illustrated for the data collected at CMRR. Data collected at NYU used a 50 ms longer TR, while stimuli were always presented time locked to the TR number.
Fig. 2.
Fig. 2.
Single-subject overall response to sounds (qFDR<0.01). From left to right, we show the t-maps resulting from a GLM with single trials as predictors of the Original, NORdef, and NORnn data on a transversal slice. NORdef: default setting, including a noise scan to estimate noise threshold, NORnn: same settings except for the use of noise scan.
Fig. 3.
Fig. 3.
Group average correlation analyses. (A) NORnn is more similar to the Original data than NORdef. However, across conditions, there is no evidence of a difference between correlation values between the NORDIC denoised datasets and the Original data (two-way repeated-measures ANOVA showed no main effect of condition). This indicates that the number of repetitions of each condition do not affect the effect of NORDIC denoising. (B) The run-to-run stability of beta estimates increases significantly with the use of NORnn, that is, across subjects, beta estimates are more similar across runs after NORnn. (C) Average cross-validated correlation values of single runs to the average of the Original data for the PredH condition. Grayscale dots indicate mean correlation values of individual participants ordered according to their correlation value in the Original data (participants have the same color in each of the three datasets). * indicates p < 0.05.
Fig. 4.
Fig. 4.
Example tonotopic maps. Frequency preference maps are computed for each dataset and for one example participant we display these maps on an inflated mid-GM surface. Denoising does not seem to alter the frequency preference as the high-low-high gradient is visible in all three datasets. The maps computed from the denoised datasets are less noisy. The black line delineates HG.
Fig. 5.
Fig. 5.
Beta- and t-value estimates and their reliability. (A) Average reduction of beta values across participants. (B) At the group level, in increase in t-values is visible. (C) On average, denoising results in a better estimate of beta values calculated with split half correlations in ROIs where there is more signal in the data. (D) t-value reliability is generally higher after NORDIC than in the Original data. * indicates p < 0.05.
Fig. 6.
Fig. 6.
Beta difference in relation to tSNR for one representative subject. (A) Mean/standard deviation (tSNRpr) is displayed as a function of the Original data and betas after NORDIC. For low tSNRprvalues, the betas change in both directions. However, at high tSNRpr, the betas remain relatively similar after NORDIC. The red line indicates the mean beta difference per bin. (B) Same as (A) but for the beta difference between Original and NORnn betas.
Fig. 7.
Fig. 7.
Group analysis of the variance explained by the stimulation design. (A) Box charts show the interquartile percentile range of variance explained by the design in the data across participants. After NORDIC denoising, an increased proportion of the variance is explained by the experimental design. NORnn shows an increase in explained variance compared to the Original data, but a slightly lower increase than NORdef. (B) The proportion of variance explained by the design that is removed from the Original data after NORDIC. NORdef removed a larger proportion of the signal compared to NORnn. Grayscale dots indicate mean values of individual participants ordered according to their mean value in the Original data (participants have the same color in each of the three datasets). ** indicates p < 0.01.
Fig. 8.
Fig. 8.
Average effect of NORDIC across depth. Group average laminar plot for the PredH (A) and PredL condition (B). We can easily identify the draining vein effect in both conditions. However, a gradual decrease in slope is visible for NORnn and NORdef, indicating that NORDIC denoising has a differential effect across depths.

Update of

References

    1. Ahveninen , J. , Chang , W.-T. , Huang , S. , Keil , B. , Kopco , N. , Rossi , S. , Bonmassar , G. , Witzel , T. , & Polimeni , J. R. ( 2016. ). Intracortical depth analyses of frequency-sensitive regions of human auditory cortex using 7T fMRI . NeuroImage , 143 , 116 – 127 . 10.1016/j.neuroimage.2016.09.010 - DOI - PMC - PubMed
    1. Allen , E. J. , St-Yves , G. , Wu , Y. , Breedlove , J. L. , Prince , J. S. , Dowdle , L. T. , Nau , M. , Caron , B. , Pestilli , F. , Charest , I. , Hutchinson , J. B. , Naselaris , T. , & Kay , K. ( 2022. ). A massive 7T fMRI dataset to bridge cognitive neuroscience and artificial intelligence . Nature Neuroscience , 25 ( 1 ), 116 – 126 . 10.1038/s41593-021-00962-x - DOI - PubMed
    1. Behzadi , Y. , Restom , K. , Liau , J. , & Liu , T. T. ( 2007. ). A component based noise correction method (CompCor) for BOLD and perfusion based fMRI . NeuroImage , 37 ( 1 ), 90 – 101 . 10.1016/j.neuroimage.2007.04.042 - DOI - PMC - PubMed
    1. Berlot , E. , Formisano , E. , & De Martino , F. ( 2018. ). Mapping frequency-specific tone predictions in the human auditory cortex at high spatial resolution . The Journal of Neuroscience , 38 ( 21 ), 4934 – 4942 . 10.1523/JNEUROSCI.2205-17.2018 - DOI - PMC - PubMed
    1. Cordero-Grande , L. , Christiaens , D. , Hutter , J. , Price , A. N. , & Hajnal , J. V. ( 2019. ). Complex diffusion-weighted image estimation via matrix recovery under general noise models . NeuroImage , 200 , 391 – 404 . 10.1016/j.neuroimage.2019.06.039 - DOI - PMC - PubMed

LinkOut - more resources