

T cell receptor signaling pathway subgroups and construction of a novel prognostic model in osteosarcoma
- PMID: 39811323
- PMCID: PMC11732464
- DOI: 10.1016/j.heliyon.2024.e41191
T cell receptor signaling pathway subgroups and construction of a novel prognostic model in osteosarcoma
Abstract
Background: T cell receptor (TCR) signaling pathway is closely related to tumor progress and immunotherapy. This study aimed to explore the clinical significance, prognosis, immune infiltration and chemotherapy sensitivity of TCR in osteosarcoma (OS).
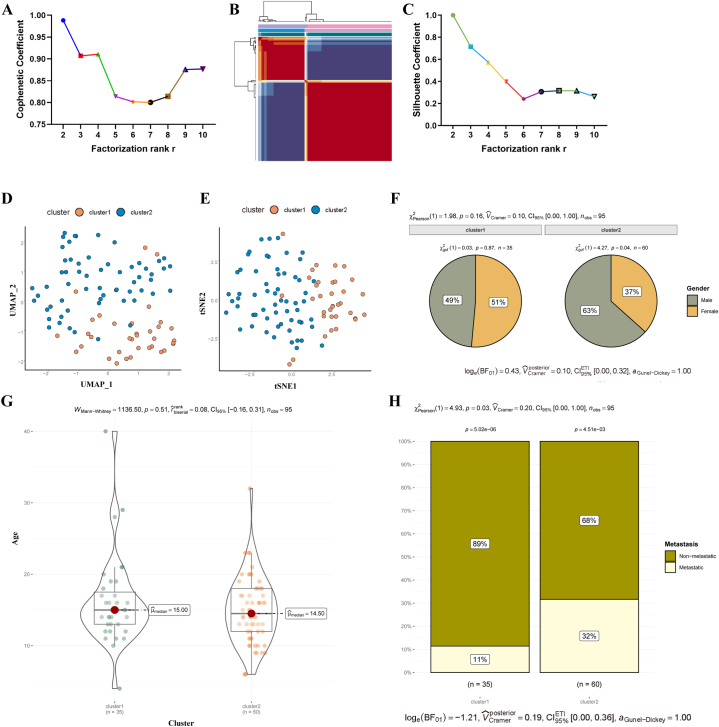
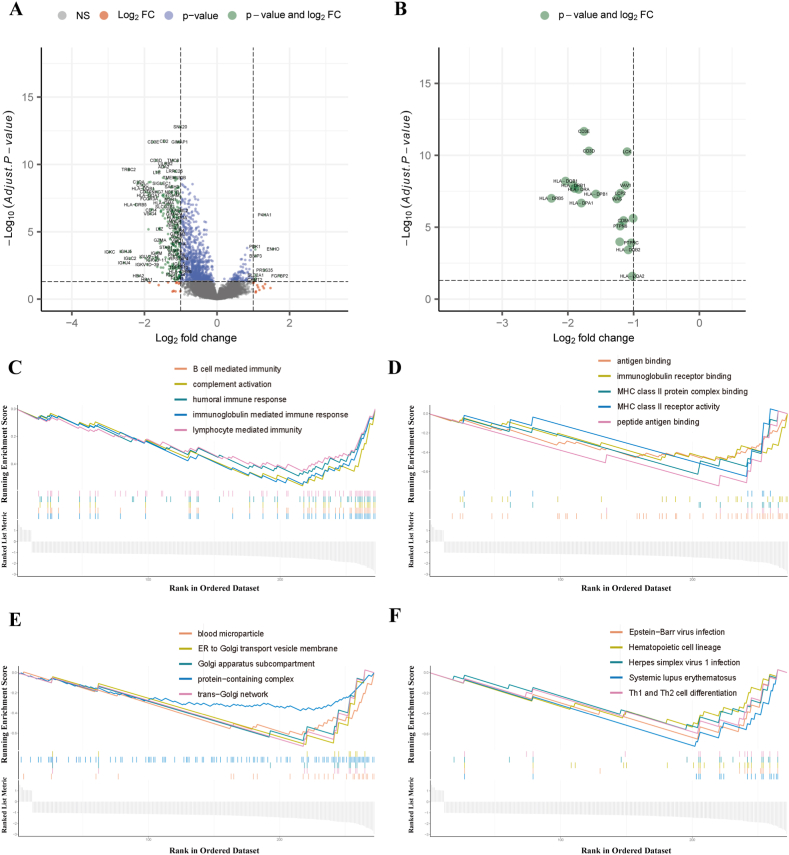
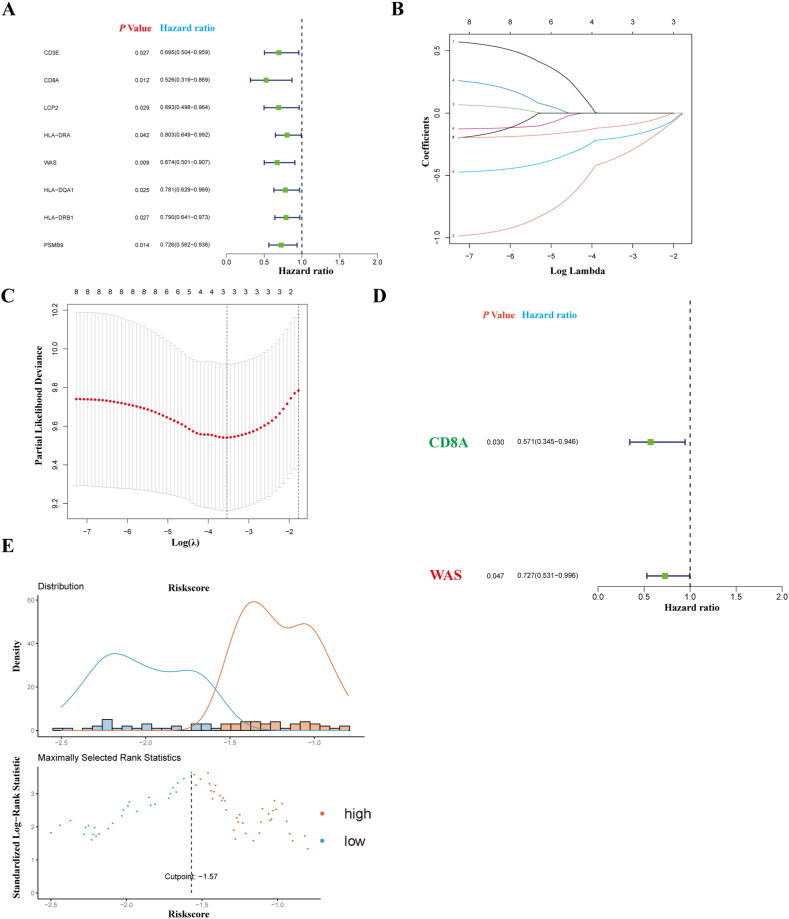
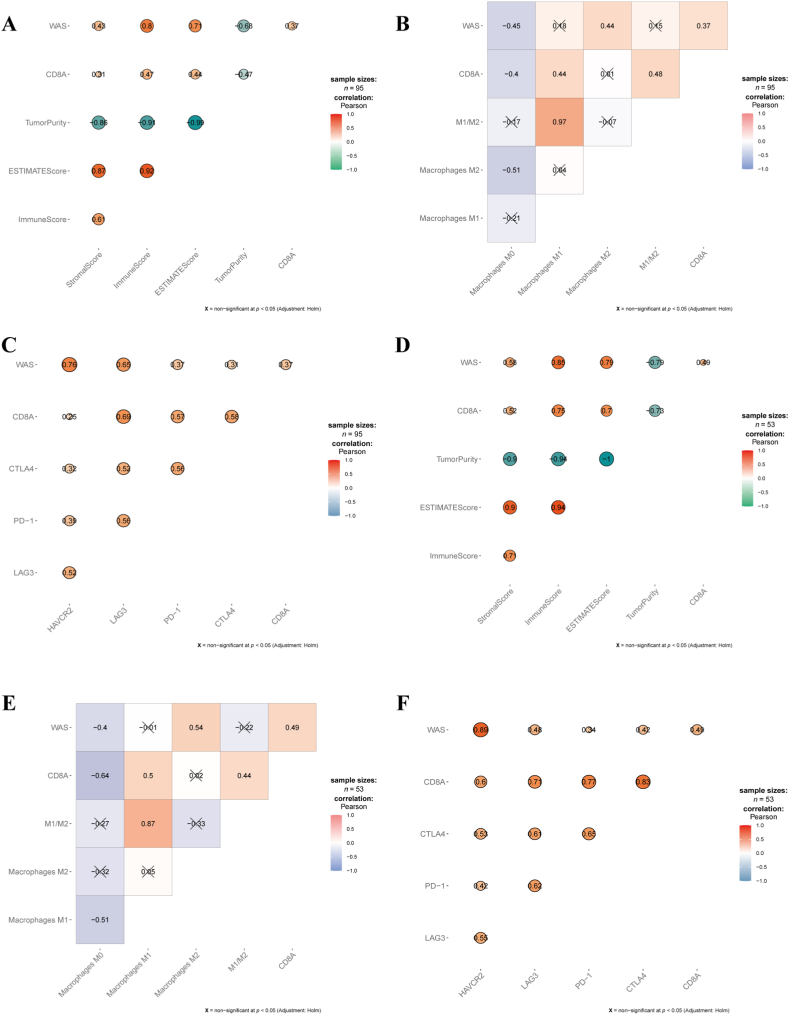
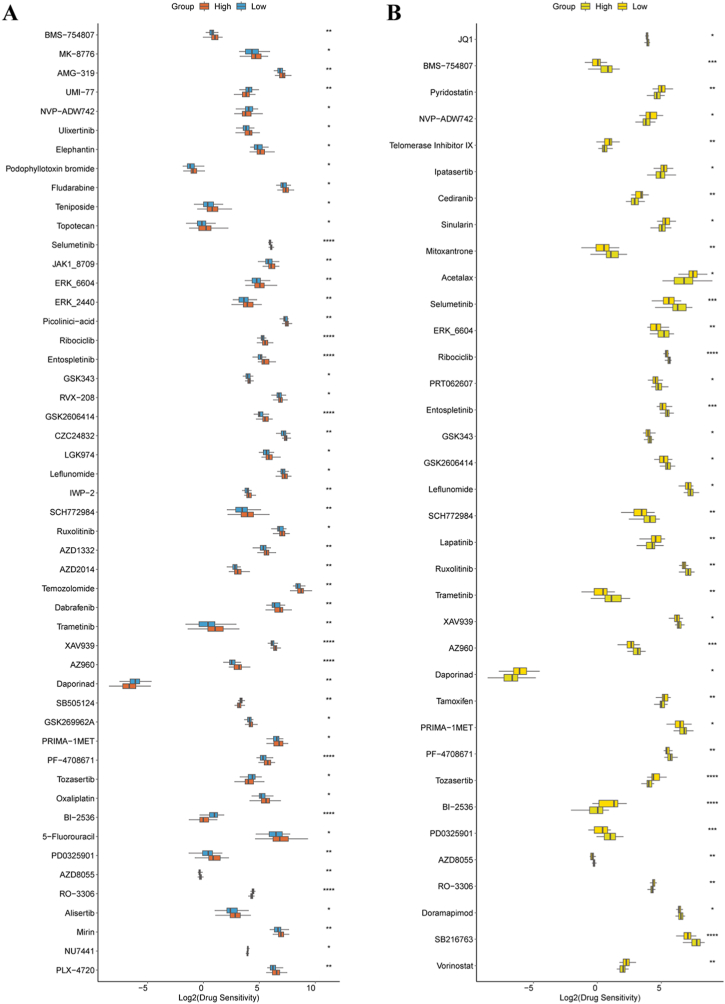
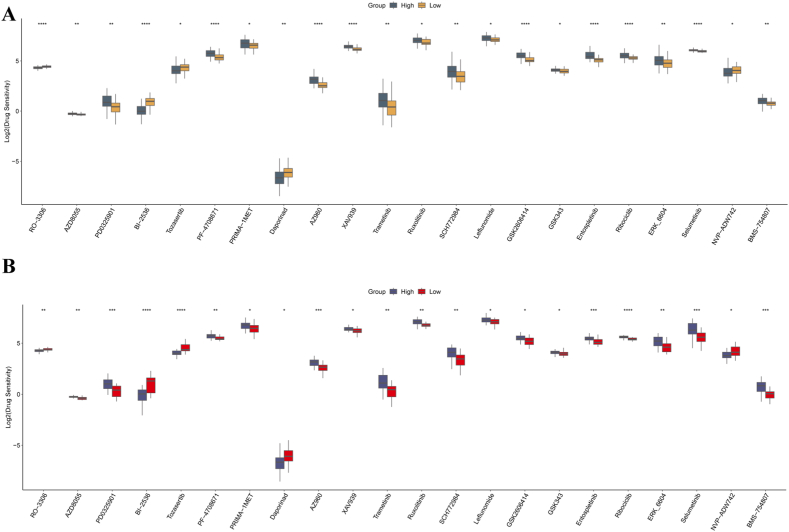
Material and methods: OS data were obtained from TARGET and GEO database. TCR signaling pathway-related genes (TCRGs) were extracted from Molecular Signatures Database. Unsupervised non-negative matrix factorization clustering analysis was used to identify OS molecular subtypes. Differential expressed TCRGs between molecular subtypes were screened with univariate Cox regression, LASSO regression and multivariate Cox regression. Subsequently, an OS-associated prognostic model was constructed and validated. Nomogram was established and verified. Immune landscape analysis including immune infiltration analysis, ESTIMATE algorithm and immune checkpoints expression levels of molecular subtypes and different risk groups were analyzed. Finally, chemotherapy sensitivity and potential therapeutic agents between different risk groups was identified.
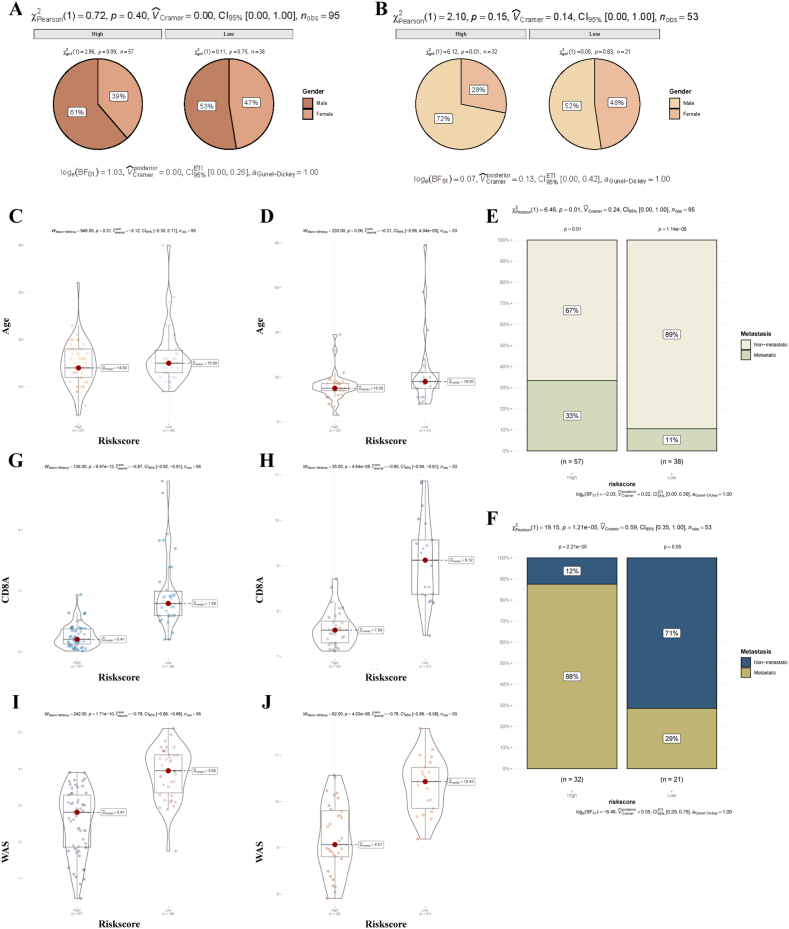
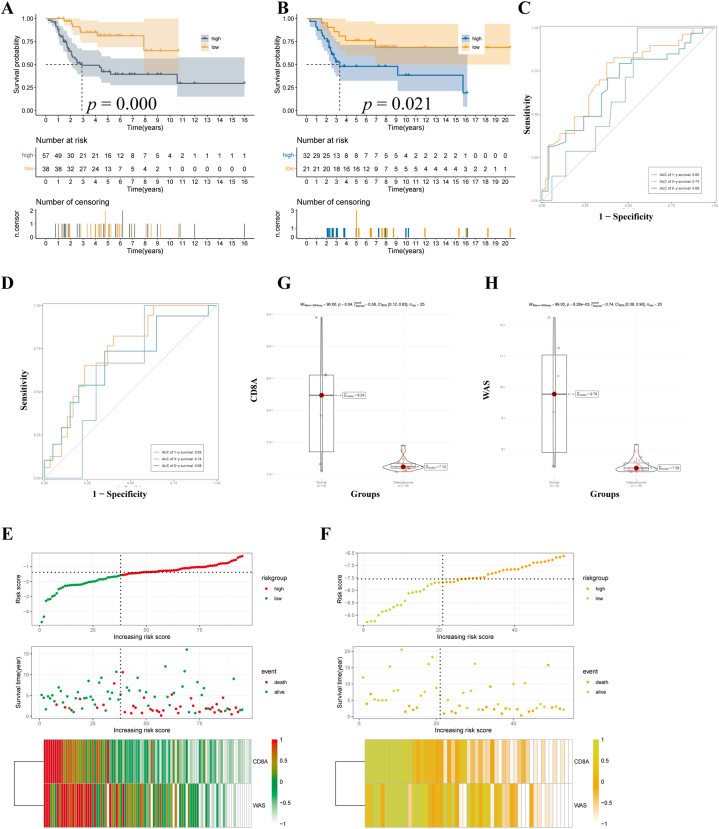
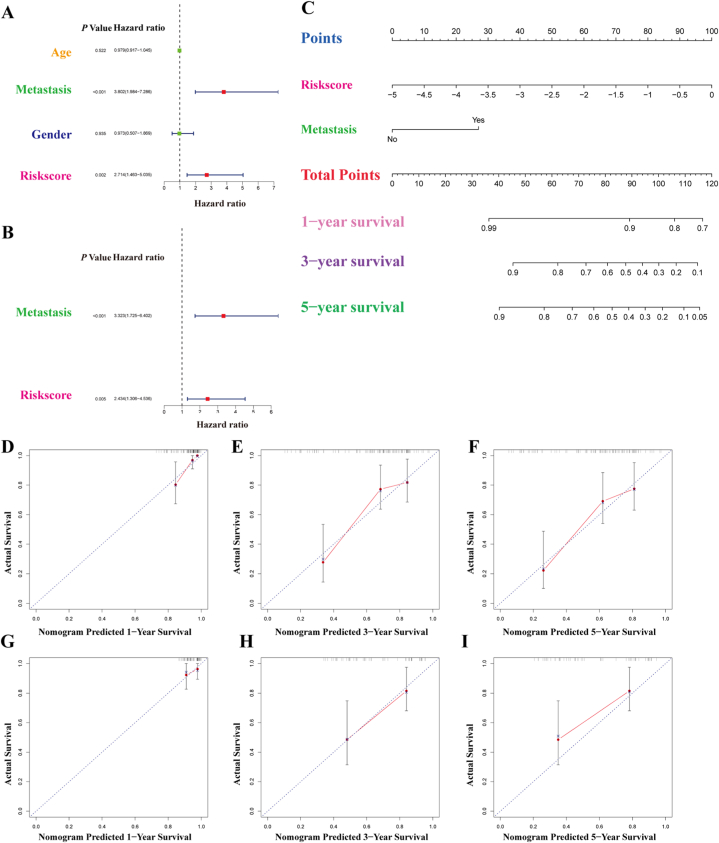
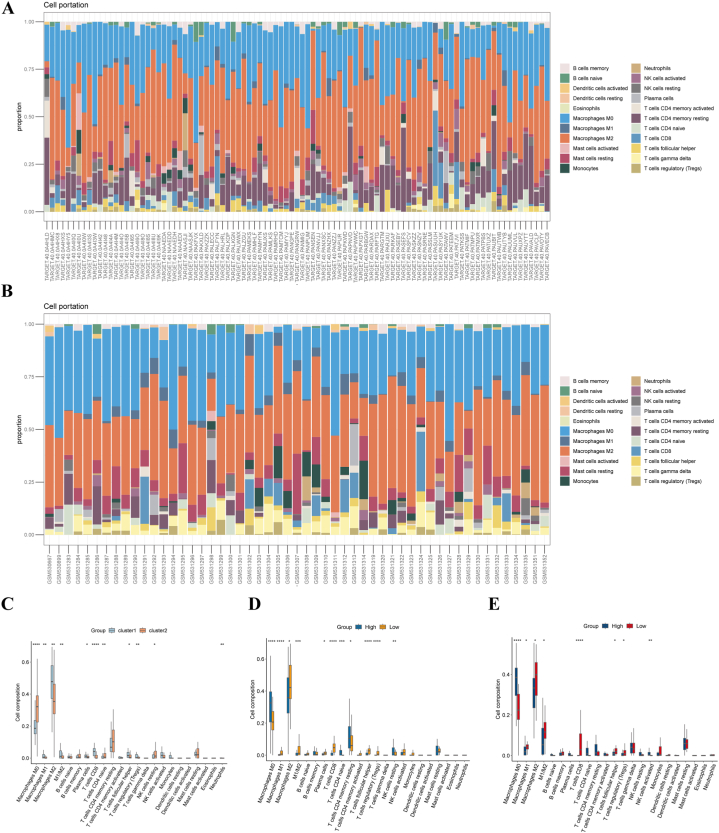
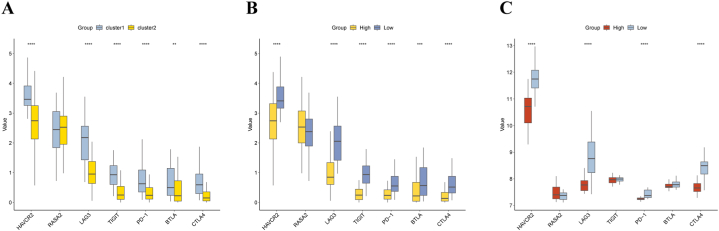
Results: Two TCRGs related subclusters were identified. Two hundred and seventy-two Differential expressed TCRGs were screened between two subclusters. A robust prognostic model were constructed. High and low risk groups were stratified. Low risk group showed higher ESTIMATE, immune and stromal scores, while high risk group exhibited higher tumor purity and the lower expression levels of immune checkpoints. A nomogram comprising metastasis and risk score was successfully built. The sensitivity to chemotherapy agents were different across high and low risk groups.
Conclusions: Our study proposed TCR related molecular subtypes and provided a prognostic model for OS. Our findings may bring a new insight into the immunotherapy for OS patients.
Keywords: Osteosarcoma; Prognosis; Signal Transduction.
© 2024 Published by Elsevier Ltd.
Conflict of interest statement
The authors declare that they have no known competing financial interests or personal relationships that could have appeared to influence the work reported in this paper.
Figures


Similar articles
-
Integrated immunogenomic analyses of single-cell and bulk profiling construct a T cell-related signature for predicting prognosis and treatment response in osteosarcoma.Discov Oncol. 2024 Oct 22;15(1):579. doi: 10.1007/s12672-024-01461-8. Discov Oncol. 2024. PMID: 39436466 Free PMC article.
-
Identification of cuproptosis-related subtypes, construction of a prognosis model, and tumor microenvironment landscape in gastric cancer.Front Immunol. 2022 Nov 21;13:1056932. doi: 10.3389/fimmu.2022.1056932. eCollection 2022. Front Immunol. 2022. PMID: 36479114 Free PMC article.
-
Identification of Hypoxia-Related Subtypes, Establishment of Prognostic Models, and Characteristics of Tumor Microenvironment Infiltration in Colon Cancer.Front Genet. 2022 Jun 17;13:919389. doi: 10.3389/fgene.2022.919389. eCollection 2022. Front Genet. 2022. PMID: 35783281 Free PMC article.
-
A novel signature incorporating lipid metabolism- and immune-related genes to predict the prognosis and immune landscape in hepatocellular carcinoma.Front Oncol. 2023 Jun 6;13:1182434. doi: 10.3389/fonc.2023.1182434. eCollection 2023. Front Oncol. 2023. PMID: 37346073 Free PMC article.
-
Develop a Novel Signature to Predict the Survival and Affect the Immune Microenvironment of Osteosarcoma Patients: Anoikis-Related Genes.J Immunol Res. 2024 Mar 27;2024:6595252. doi: 10.1155/2024/6595252. eCollection 2024. J Immunol Res. 2024. PMID: 39431237 Free PMC article.
References
-
- Bielack S.S., Kempf-Bielack B., Zoubek A., et al. Prognostic factors in high-grade Osteosarcoma of the extremities or trunk: an analysis of 1,702 patients treated on neoadjuvant Cooperative Osteosarcoma Study Group protocols. J. Clin. Oncol. 2002;20(3):776–790. doi: 10.1200/jco.2002.20.3.776. - DOI - PubMed
LinkOut - more resources
Full Text Sources
