. 2023 Jan 11;12(4):199-210.
doi: 10.4103/jmau.jmau_62_22. eCollection 2024 Oct-Dec.

The Possible Ameliorative Effect of Echinacea, Ginger, and Their Combination on Experimentally Induced Diabetic Nephropathy in a Rat Model: Histological and Immunohistochemical Study

Affiliations

The Possible Ameliorative Effect of Echinacea, Ginger, and Their Combination on Experimentally Induced Diabetic Nephropathy in a Rat Model: Histological and Immunohistochemical Study

Hoda M Elsayed et al. J Microsc Ultrastruct. .

Abstract

Background: Diabetes represents a chronic disease characterized by hyperglycemia. Several changes in the renal functions had been detected in diabetic patients.

Aim of the work: This study was conducted to compare the possible ameliorative role of both ginger and Echinacea either alone or in combination upon experimentally induced diabetic nephropathy.

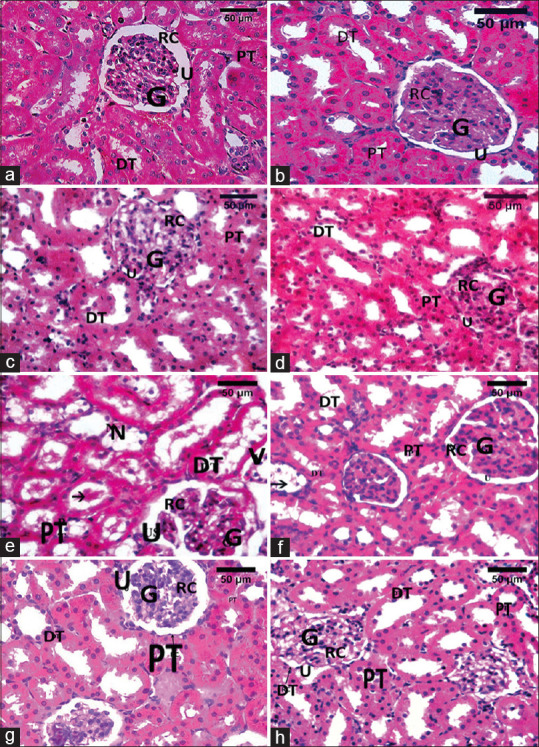
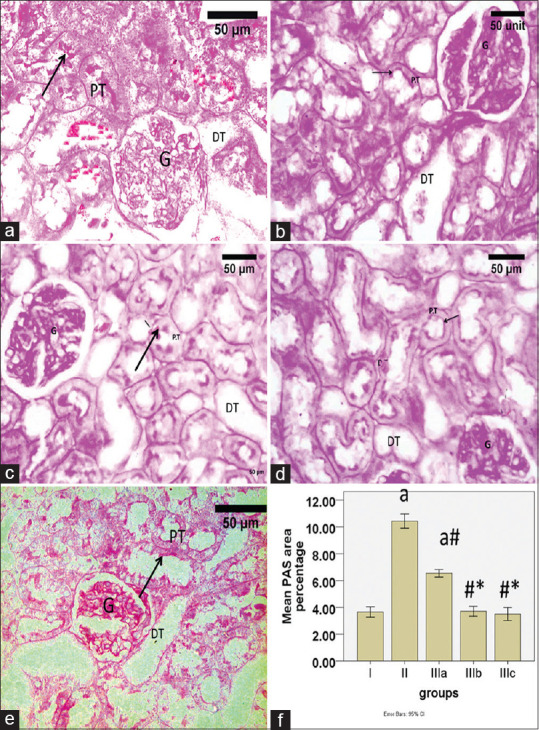
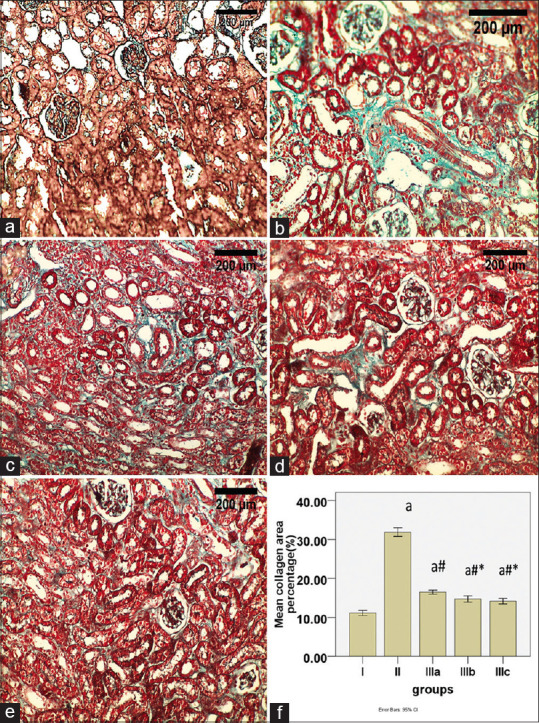
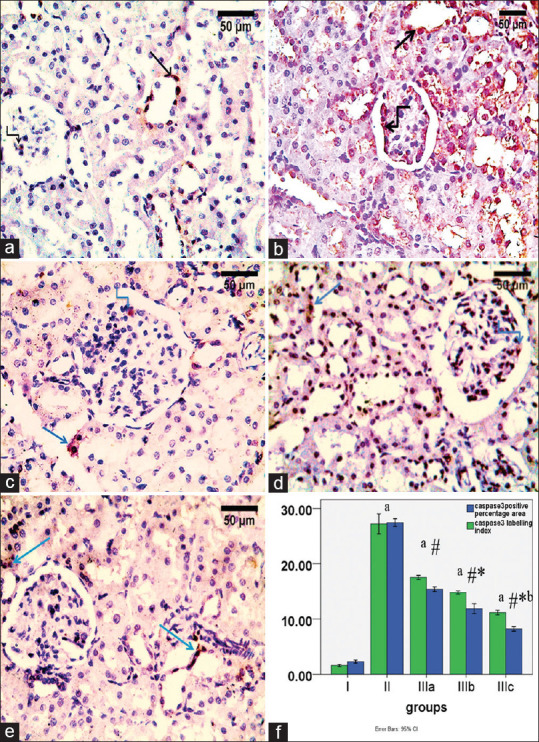
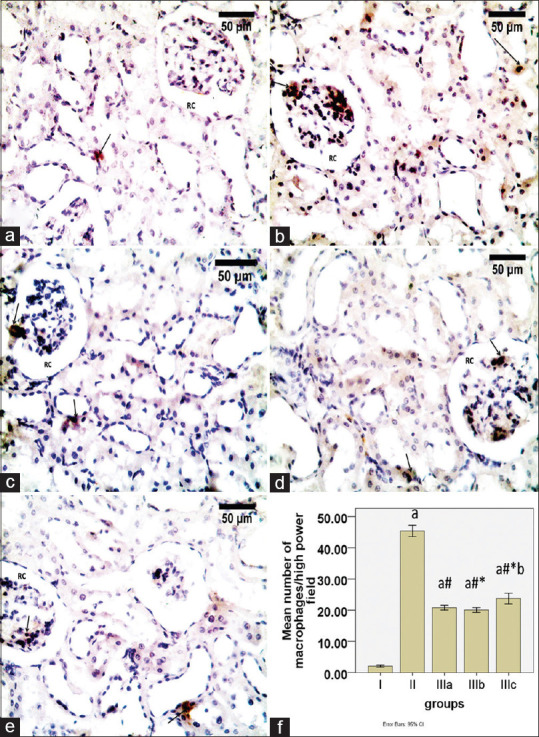
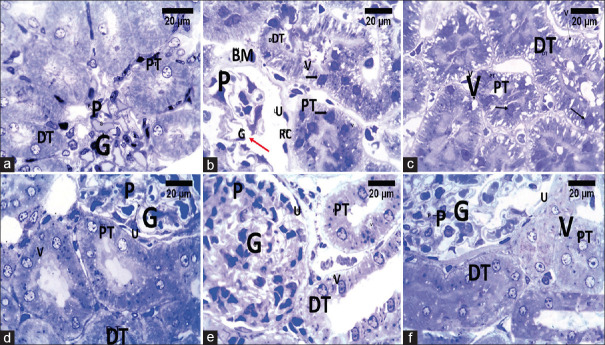
Materials and methods: Sixty adult male albino rats were used in this study. Rats were divided into three groups. Control (group I) included 20 rats. Diabetic group (group II) included 10 rats. Group III included 30 rats subdivided into three subgroups 10 animals each: Subgroup IIIa diabetic treated with 100 mg/kg Echinacea for 30 days. Subgroup IIIb diabetic treated with 400 mg/kg ginger for 30 days orally. Subgroup IIIc diabetic treated with both 100 mg/kg Echinacea and 400 mg/kg ginger for 30 days orally. Hemotoxylin and eosin staining, Periodic acid Schiff and Masson trichrome were done. Ultrastructural examination was done. Immunohistochemical markers used were caspase-3 for apoptosis and CD68 for macrophages. Morphometric and statistical analyses were done.

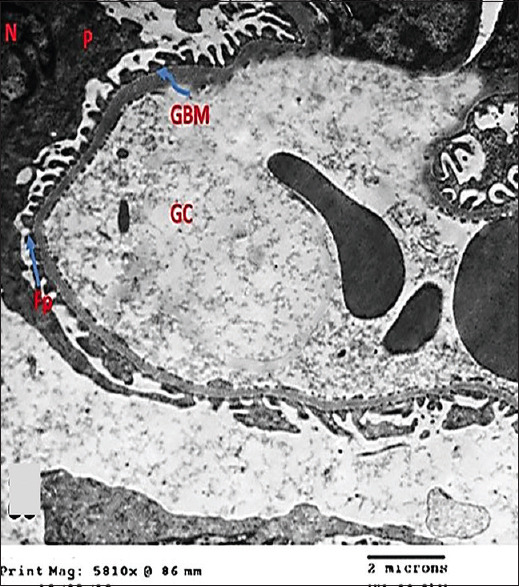
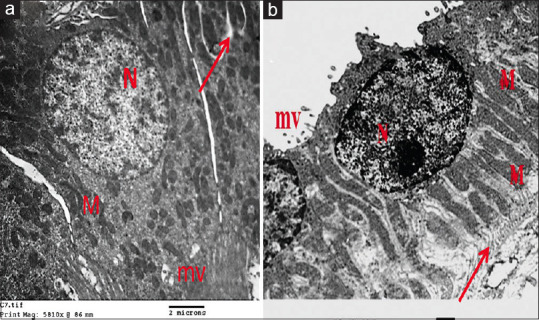
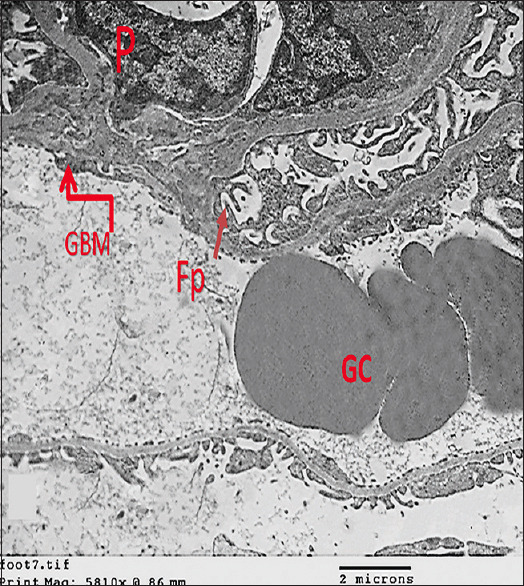
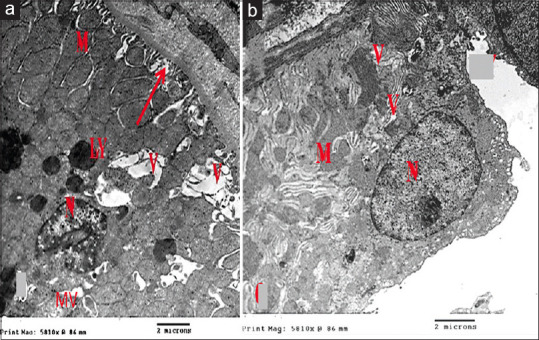
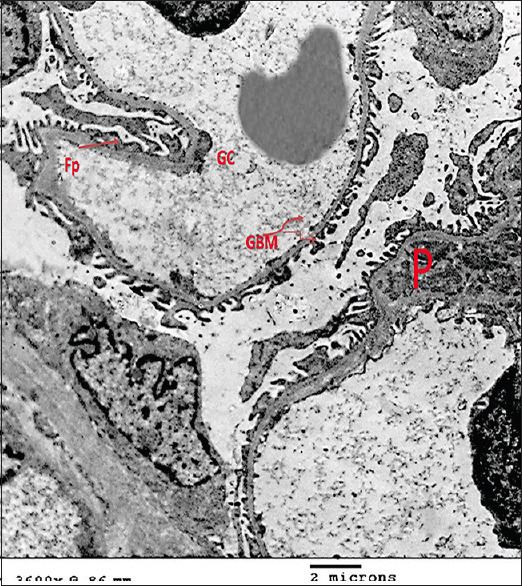
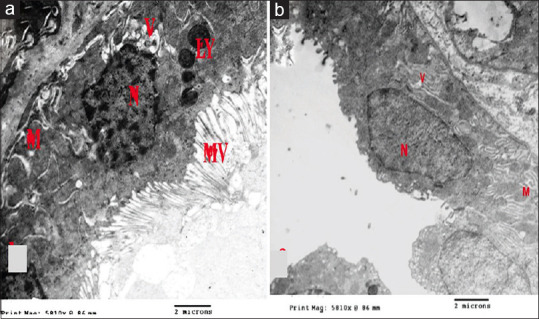
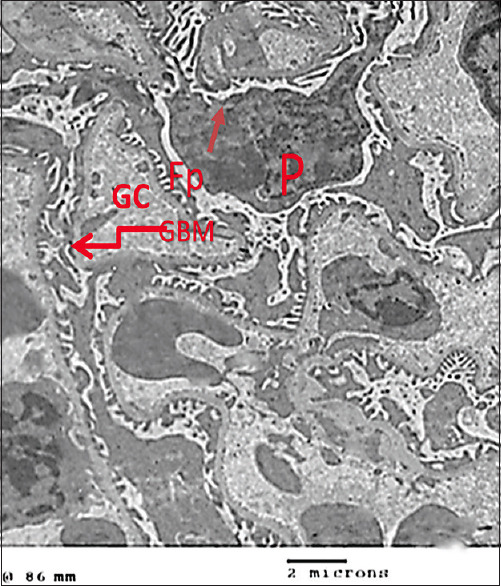
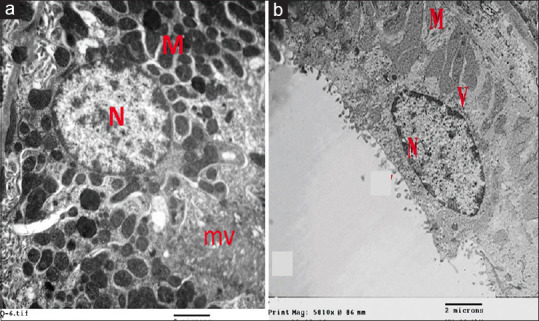
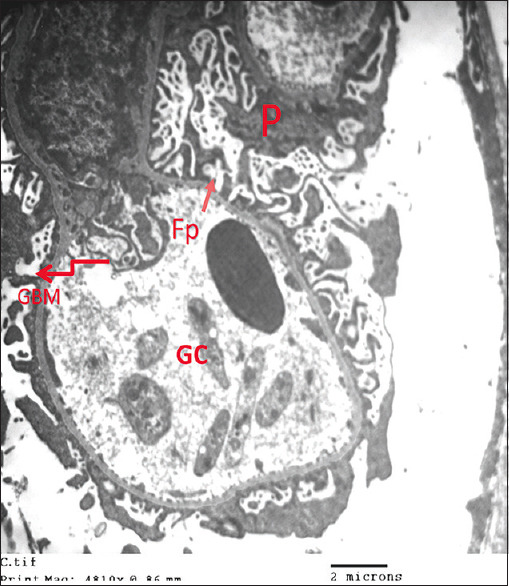
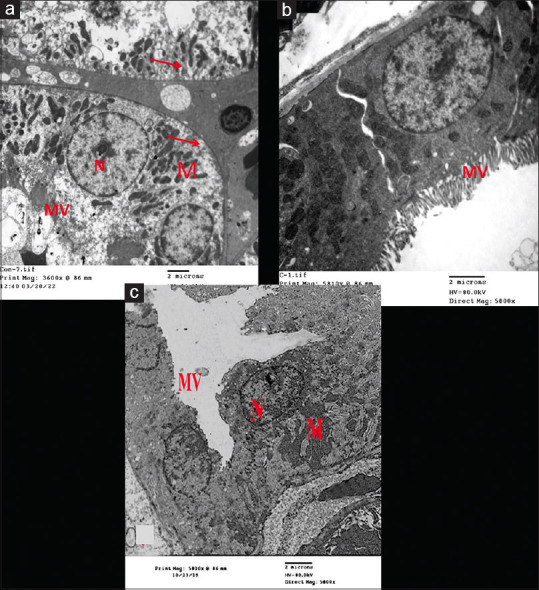
Results: Diabetes caused a significant increase in collagen fibers in the renal cortex, the caspase-3 expression as well as the number of macrophages. Ultrastructurally, there was an irregularly thickened glomerular basement membrane and effacement of podocytes. Ginger treatment alone or in combination with Echinacea exhibited more pronounced improvement of diabetes-induced degenerative changes and a significant decrease in collagen fibers, the caspase-3 expression as well as the number of macrophages compared to Echinacea alone.

Conclusion: Ginger treatment alone or in combination with Echinacea exhibited more pronounced improvement in diabetes nephropathy.

Keywords: Caspase-3; DC68; Diabetic nephropathy; Echinacea; ginger.


Conflict of interest statement

There are no conflicts of interest.

Figures

Figure 1
Figure 1
Photomicrographs of kidney sections (a-d) The control subgroups Ia, Ib, Ic, and Id respectively showing the RC glomerular capillaries (G), urinary space (U), PT with narrow lumen and lined with cuboidal cells having apical brush border with vesicular nuclei and acidophilic cytoplasm. DT with a wide lumen and lined with cuboidal cells with vesicular nuclei and acidophilic cytoplasm (e) (group II) showing, the RC glomerular capillaries (G) with mesangial expansion and widening of urinary space (U), vacuoles (V), loss of brush border of PT and pyknotic nuclei (N), DT. Luminal acidophilic debris (arrow). (f) Subgroup IIIa and (g) Subgroup IIIb: Showing decreased degenerative changes (h) Subgroup IIIc is more or less similar to the control; the RC glomerular capillaries (G), urinary space (U), PT DT scale bar = 50 µm (H and E, ×400). RC: Renal corpuscle, PT: Proximal tubule, DT: Distal tubule, U: Urinary space, V: Vacuoles, G: Glomerular capillaries
Figure 2
Figure 2
Photomicrographs of kidney sections. (a) Control showing a positive reaction in basement membranes of renal corpuscles, glomerular capillaries (G), renal tubules (PT, DT) and the brush border of PT (arrow). (b) Diabetic rats showing increased intensity of PAS reaction with interrupted brush border (arrow) and thickened Basement membranes of the renal corpuscles, glomerular capillaries (G), renal tubules (PT, DT). (c) Subgroup IIIa and d: Subgroup IIIb: Showing decreased intensity of PAS with partially destructed brush border e: Subgroup IIIc is more or less similar to the control. Renal corpuscles (G), PT, DT, brush border (arrow). Scale bar = 50 µm (PAS, ×400) (f) Histogram showing the mean of PAS basement membranes positive area percentage in all groups. aSignificant compared to control, #Significant compared to group II, *Significant compared to group IIIa. PT: Proximal tubule, DT: Distal tubule, G: Glomerular capillaries, PAS: Periodic acid–Schiff, G: Glomerular capillaries
Figure 3
Figure 3
Photomicrographs of kidney sections. (a) Control showing few collagen fibers around the glomeruli and renal tubule (b) Group II showing increased collagen fibers around the glomeruli and tubules and in renal interstitium. (c) Subgroup IIIa, (d) Subgroup IIIb) and (e) Subgroup IIIc: Showing decreased collagen fibers. Scale bar = 50 µm (Masson trichrome, ×400) (f) Histogram showing the mean of collagen area percentage in all groups. aSignificant compared to control, #Significant compared to group II, *Significant compared to group IIIa
Figure 4
Figure 4
Photomicrographs of kidney sections. (a) The control showing few positive cells in renal tubules and renal corpuscles (b) Group II showing increased positive cells in renal tubules and corpuscles compared to control. (c) Subgroup IIIa, (d) Subgroup IIIb and (e) Subgroup IIIc showing decreased positive cells compared to diabetic rats. Positive cells in renal tubules (arrow) and renal corpuscles (stepwise arrow) (Caspase-3 immunostain, ×400, Scale bar = 50 µm) (f) Histogram showing the mean of caspase-3 positive percentage area and labeling index in all groups. aSignificant compared to control, #Significant compared to group II, *Significant compared to group IIIa, b: Significant compared to group IIIb
Figure 5
Figure 5
Photomicrographs of kidney sections. (a) Control showing few positive cells in between renal tubules and renal corpuscles (b) Group II showing increased positive cells in between renal tubules and renal corpuscles compared to control. (c) Subgroup IIIa, (d) Subgroup IIIb and (e) Subgroup IIIc: Showing decreased positive cells compared to diabetic rats. RC, positive cells in (arrow) (CD68 immunostain, ×400, Scale bar = 50 µm). (f) Histogram showing the mean number of CD68 positive cells in all groups. aSignificant compared to control, #Significant compared to group II, *Significant compared to group IIIa, b: Significant compared to group IIIb. RC: Renal corpuscle
Figure 6
Figure 6
Photomicrographs of kidney semithin sections. (a) Control. showing glomeruli (G) lined with endothelial cells and podocyte (P) in renal corpuscle. PT lining cells are cuboidal with vesicular nuclei and apical brush border. DT lining cells are cuboidal with vesicular nuclei and wide lumen. (b) Diabetic rats showing; thickened (BM) widely spaced glomeruli (red arrow), congested glomerular capillaries (G) irregular and deeply stained nuclei (black arrow) of podocyte (P), widening of urinary space (U), PT loss of brush border. DTs vacuoles (V). (c) Diabetic rats showing; PT and DTs cells with irregular and deeply stained nuclei (black arrow) and numerous vacuoles (V). (d) Subgroup IIIa, (e) Subgroup IIIb and (f) Subgroup IIIc: Showing decreased degenerative changes; decreased congestion in glomerular capillaries (G) and narrower urinary space (U) with more regular nucleus of podocyte (P) compared to diabetic rats. PT appear with regular lumen and partially regular brush border and in f more or less similar to control. DT appear more or less similar to the control apart from few vacuoles (V) (Toluidine blue, ×1000, scale bar = 20 μm). PT: Proximal tubules, DT: Distal tubules, P: Podocyte, V: Vacuoles, G: Glomerular capillaries, U: Urinary space, RC: Renal corpuscle
Figure 7
Figure 7
Electronmicrograph of ultrathin section in control group showing: GC with regular GBM (arrow curved) and podocyte (P) with Fp (arrow) surrounding GBM. Nucleus (N) of podocyte (TEM, ×5800, Scale bar = 2 μm). GC: Glomerular capillary, GBM: Glomerular basement membrane, Fp: Foot processes, N: Nucleus, P: Podocyte
Figure 8
Figure 8
Electronmicrographs of ultrathin sections in the control group showing: (a) Proximal tubular cells with numerous apical MV, basal infoldings (arrow) in which the elongated mitochondria (M) arranged with large rounded and euchromatic nucleus (N). (b) Distal tubular cells with a euchromatic nucleus (N), basal infoldings (arrow) and elongated mitochondria (M) (TEM, ×5800, Scale bar = 2 µm). MV: Microvilli, M: Mitochondria, N: Nucleus
Figure 9
Figure 9
Electronmicrograph of ultrathin section of diabetic rats showing GC with irregular thickening of GBM (arrow curved) and effacement of Fp (arrow) of podocytes (P) (TEM, ×5800, Scale bar = 2 μm). GC: Glomerular capillaries, GBM: Glomerular basement membrane, Fp: foot processes, P: Podocytes
Figure 10
Figure 10
Electronmicrographs of ultrathin sections of diabetic rats showing: (a) Proximal tubular cells with heterochromatic nucleus and nuclear indentation (N) and ill-defined basal infoldings (arrow) with mitochondria of different sizes and shapes (M). Destructed MV. The cytoplasm shows LY and numerous vacuoles (V). (b) Distal tubular cell with vacuoles (V), Mitochondria with mitochondria of different sizes and shapes (M), nucleus (N) (TEM, ×5800, Scale bar = 2 μm). MV: Microvilli, LY: Lysosomes, M: Mitochondria, N: Nucleus, V: Vacuoles
Figure 11
Figure 11
Electron micrograph of ultrathin section of subgroup IIIa showing: GC with less thickened glomerular basement membrane (GBM curved arrow) and less effacement of Fp (arrow) of podocytes (P) compared to diabetic rats (TEM, ×5800, Scale bar = 2 μm). GC: Glomerular capillary, Fp: Foot processes, P: Podocytes, GBM: Glomerular basement membrane
Figure 12
Figure 12
Electron micrographs of ultrathin sections of subgroup IIIa showing: (a) proximal tubular cell with partially regular apical microvilli (MV) and basal mitochondria of different sizes and shapes(M) in between irregular infoldings. The nucleus (N) appears more regular and the cytoplasm shows less vacuoles (V) and lysosomes (Ly) compared to diabetic rats. (b) distal tubular cells with less vacuoles (V) compared to diabetic rats. Note regular nucleus (N), basal mitochondria (M). (TEM x5800, Scale bar=2µm)
Figure 13
Figure 13
electron micrograph of ultrathin section in subgroup IIIb showing: glomerular capillaries (GC) with less thickened glomerular basement membrane (GBM curved arrow) compared to group IIIa with footprocesses (Fp arrow) of podocytes (P). (TEM x5800, Scale bar=2μm)
Figure 14
Figure 14
Electron micrographs of ultrathin sections of subgroup IIIb (a) proximal tubular cell with partially regular apical microvilli (mv), euchromatic nucleus (N) with basal mitochondria (M) of different shapes in between well defined basal infoldings. The cytoplasm shows less vacuoles compared to diabetic rats. (b) distal tubular cell with euchromatic nucleus (N), basal mitochondria (M) and few vacuoles (V). (TEM x5800, Scale bar=2μm)
Figure 15
Figure 15
Electron micrograph of ultrathin section in subgroup IIIc showing regular glomerular basement membrane (GBM curved arrow) and foot processes (Fp arrow) of podocytes (P) that are more or less similar to control group, glomerular capillaries (GC). (TEM x5800. Scale bar=2μm)
Figure 16
Figure 16
Electron micrographs of ultrathin sections in subgroup IIIc showing (a): Proximal tubular cell with euchromatic nucleus (N) with longitudinally arranged mitochondria (M) with regular well-defined basal infolding (arrow) MV (TEM, ×3600). (b) Proximal tubular cell with regular well-defined MV (c) Distal tubular cells with a euchromatic nucleus (N), basal infoldings with longitudinally arranged mitochondria (M), MV (TEM, ×5800. Scale bar = 2 μm). MV: Microvilli, N: Nucleus

Similar articles

References

    1. Ogunyinka BI, Oyinloye BE, Osunsanmi FO, Opoku AR, Kappo AP. Protective effects of Parkia biglobosa protein isolate on streptozotocin-induced hepatic damage and oxidative stress in diabetic male rats. Molecules. 2017;22:1654. - PMC - PubMed
    1. Giralt-López A, Molina-Van den Bosch M, Vergara A, García-Carro C, Seron D, Jacobs-Cachá C, et al. Revisiting experimental models of diabetic nephropathy. Int J Mol Sci. 2020;21:3587. - PMC - PubMed
    1. Valencia WM, Florez H. How to prevent the microvascular complications of type 2 diabetes beyond glucose control. BMJ. 2017;356:i6505. - PubMed
    1. Samsu N. Diabetic nephropathy: Challenges in pathogenesis, diagnosis, and treatment. Biomed Res Int. 2021;2021:17. https://doi.org/10.1155/2021/1497449. - PMC - PubMed
    1. Faridi Esfanjani A, Jafari SM. Biopolymer nano-particles and natural nano-carriers for nano-encapsulation of phenolic compounds. Colloids Surf B Biointerfaces. 2016;146:532–43. - PubMed

LinkOut - more resources