. 2024 Dec 9;28(1):111550.
doi: 10.1016/j.isci.2024.111550. eCollection 2025 Jan 17.

Proteasome inhibition induces microtubule-dependent changes in nuclear morphology

Affiliations

Proteasome inhibition induces microtubule-dependent changes in nuclear morphology

Sourabh Sengupta et al. iScience. .

Abstract

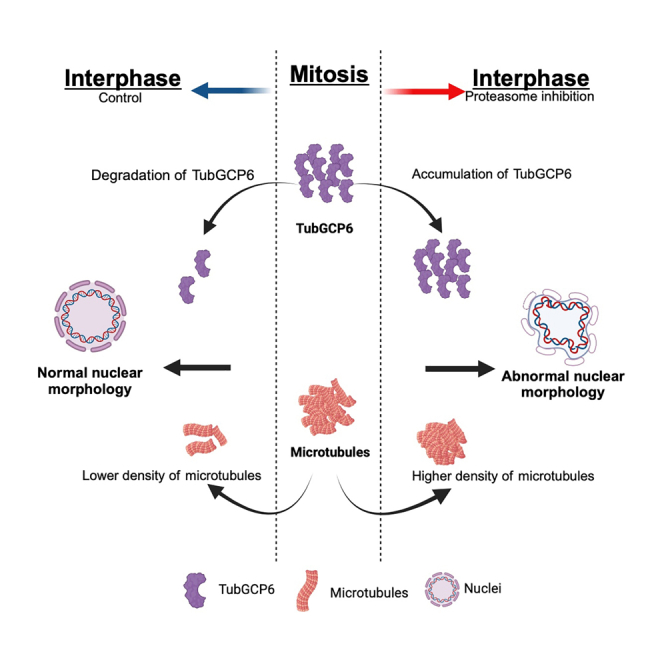
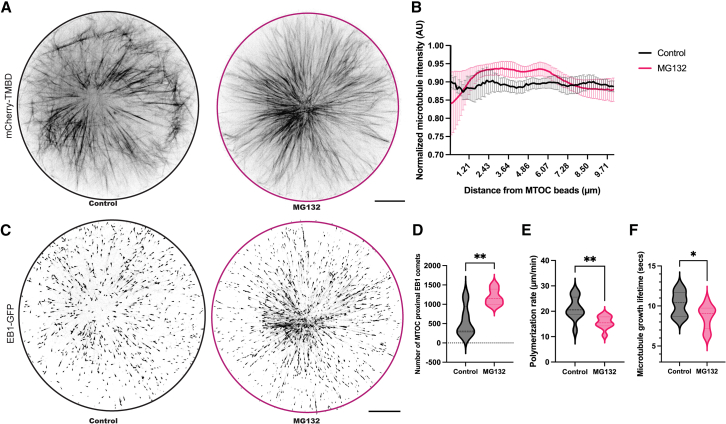
Cancers and neurodegenerative disorders are associated with both disrupted proteostasis and altered nuclear morphology. Determining if changes in nuclear morphology contribute to pathology requires an understanding of the underlying mechanisms, which are difficult to elucidate in cells where pleiotropic effects of altering proteostasis might indirectly influence nuclear morphology. To investigate direct effects, we studied nuclei assembled in Xenopus egg extract where potentially confounding effects of transcription, translation, cell cycle progression, and actin dynamics are absent. We report that proteasome inhibition causes acute microtubule-dependent changes in nuclear morphology and stability and altered microtubule dynamics and organization. Proteomic analysis of proteasome-inhibited extracts identified an increased abundance of microtubule nucleator TubGCP6, and TubGCP6 depletion partially rescued nuclear morphology. Key results were confirmed in HeLa cells. We propose that accumulation of TubGCP6 leads to altered microtubule dynamics proximal to the nucleus, producing forces that deform the nucleus and impact nuclear morphology and integrity.

Keywords: Biological sciences; Cell biology; Functional aspects of cell biology.


Conflict of interest statement

The authors declare no competing interests.

Figures

None
Graphical abstract
Figure 1
Figure 1
Proteasome inhibitor MG132 affects nuclear morphology and integrity (A–G) Xenopus laevis egg extract was supplemented with 500 μM MG132 or an equivalent volume of buffer (Control). We tested a range of MG132 concentrations and selected 500 μM because it induced the greatest effect on nuclear morphology (Figure S4). GFP-NLS was added at 0.4 μg/μL for imaging, nuclear assembly was initiated as described in STAR Methods, and live widefield imaging was performed for 1 h at 30 s intervals. Once import-competent nuclei formed, quantification was performed for the subsequent 10 min to interrogate initial nuclear growth and import rates immediately after nuclear assembly. Data were acquired for 15 nuclei per condition and three biological replicates. (A-B) Images from representative time-lapses are shown. The scale bar is 20 μm. (C) At the indicated time points, nuclei were thresholded based on GFP-NLS signal and nuclear cross-sectional (CS) area was quantified and plotted as a function of time. (D) At the indicated time points, nuclei were thresholded and total nuclear GFP-NLS fluorescence intensity was quantified by multiplying average GFP-NLS pixel intensity by nuclear volume to obtain the integrated volumetric nuclear GFP-NLS signal (see STAR Methods). These data were plotted as a function of time. (E) Nuclear growth rates were quantified based on the data shown in (C) by calculating the slope of the graph. (F) Nuclear import rates were quantified based on the data shown in (D) by calculating the slope of the graph. (G) When nuclei rupture, the intranuclear GFP-NLS signal disperses. To quantify the number of ruptured nuclei, we counted the number of nuclei positive for intranuclear GFP-NLS at the start of imaging and subtracted the number of nuclei still positive for intranuclear GFP-NLS after 1 h. This number was divided by the initial number of nuclei to obtain the rupture frequency. Ruptures typically occurred after the 10-min window used to calculate nuclear growth and import rates. (H–J) Nuclei were assembled in Xenopus laevis egg extract. After nuclear assembly, extracts were supplemented with 500 μM MG132 or an equivalent volume of buffer (Control) and incubated for 45 min. Nuclei were fixed and immunofluorescence against the nuclear pore complex (NPC) was performed with mAb414. (H) Representative widefield images are shown. The scale bar is 20 μm. (I) After thresholding, nuclear CS area was quantified and normalized to controls. (J) Thresholded images were quantified for nuclear roundness, which is the ratio of CS area to the square of the major axis. Nuclear CS area and roundness were quantified for >100 nuclei per condition and three biological replicates. (K–M) eGFP-LMNA HeLa cells were treated with 200 μM MG132 or an equivalent volume of buffer (Control) for 1 h and fixed. (K) Representative confocal images are shown. The scale bar is 20 μm. (L) After thresholding, nuclear CS area was quantified and normalized to controls. (M) Feret’s diameter, which is a measure of the longest distance between two points in a selected boundary, was calculated from thresholded images and used as a metric to quantify nuclear shape in HeLa cells. Nuclear CS area and Feret’s diameter were quantified for >100 nuclei per condition and three biological replicates. Error bars represent SD, except for in (D) where error bars are SEM. Unpaired two-tailed t-tests: ns, not significant; ∗∗∗p < 0.001; ∗∗∗∗p < 0.0001. See also Figure S1 and Video S1.
Figure 2
Figure 2
Microtubules contribute to the altered nuclear morphology induced by MG132 (A–D) Nuclei were assembled in Xenopus laevis egg extract. After nuclear assembly, extracts were supplemented with 500 μM MG132 and/or 33 μM nocodazole, as indicated. After a 45-min treatment, nuclei were fixed and immunofluorescence against the NPC was performed with mAb414. (A) Representative widefield images are shown. The scale bar is 20 μm. (B–C) Nuclear CS area and roundness were quantified as in Figure 1. (D) Heterogeneity in NPC distribution, which reflects the wrinkled appearance of the nuclear envelope, was quantified by drawing line scans within the nuclear interior and calculating the standard deviation of the NPC signal intensity along the line. Nuclear CS area, roundness, and heterogeneity in NPC distribution were quantified for >100 nuclei per condition and three biological replicates. (E–G) eGFP-LMNA HeLa cells were treated with 200 μM MG132 and/or 3 μM nocodazole for 1 h and fixed. (E) Representative confocal images are shown. The scale bar is 20 μm. (F–G) Nuclear CS area and Feret’s diameter were quantified as in Figure 1 for >100 nuclei per condition and three biological replicates. Error bars represent SD. Ordinary One-Way ANOVA: ns, not significant; ∗p < 0.05; ∗∗∗∗p < 0.0001.
Figure 3
Figure 3
MG132-treatment affects interphase microtubule architecture and dynamics Interphase X. laevis egg extract supplemented with mCherry-TMBD (to label microtubules) and EB1-GFP (to label microtubule plus ends) was encapsulated in 110 μm diameter cylindrical hydrogel enclosures containing an aMTOC. Where indicated, extracts were treated with 500 μM MG132. Time-lapse confocal imaging was performed near the coverslip at 5-s intervals for visualizing microtubules with mCherry-TMBD and at 0.5-s intervals for visualizing microtubule plus ends with EB1-GFP. aMTOC-nucleated microtubules cause the aMTOC to center within the hydrogel chamber, reaching a steady-state architecture within 10 min. (A) Representative inverted images of interphase microtubule asters. Average intensity projections of consecutive confocal images acquired over 100 s are shown. The black and purple circles represent the inner edges of the enclosures. The scale bar is 20 μm. (B) Normalized mean microtubule intensity distributions were quantified along 10 μm radial lines extending from the aster center toward the enclosure periphery (see STAR Methods). Error bars represent SEM. (C) Representative inverted images of interphase microtubule plus ends labeled with EB1-GFP after aster centration. Single time point images were randomly selected from time-lapses. The black and purple circles represent the inner edges of the enclosures. The scale bar is 20 μm. (D) The number of EB1 comets was quantified within a 10 μm radial zone around the aster center over 1 min. (E) The microtubule plus end polymerization rate and (F) microtubule growth lifetime were quantified within the entire enclosure using uTrack. See STAR Methods for quantification details. Data are presented as violin plots. Data are from at least three independent experiments using at least three different extract preparations. Unpaired two-tailed t-tests: ∗p < 0.05; ∗∗p < 0.005. See also Figure S2 and Videos S2, and S3.
Figure 4
Figure 4
Altered nuclear morphology in MG132-treated Xenopus egg extract is partially mediated by TubGCP6 (A and B) Mass spectrometry-based DIA analysis was performed on five biological replicates of control untreated interphase X. laevis egg extracts and extracts treated with 500 μM MG132 for 45 min. The relative concentrations of ∼7000 proteins were determined in Control versus MG132-treated extracts. For determining differences between the two conditions, the false discovery threshold was set at 1%, and proteins with an FDR adjusted p-value <0.05 and fold change >2 were considered significant. (A) Volcano plot of proteins that showed increased abundance (red dots) and decreased abundance (blue dots) upon MG132 treatment as compared to controls. Peptides with a greater than 2-fold increase or decrease in abundance and FDR adjusted p-value <0.05 are indicated with bigger circles. Black dots indicate proteins without any significant change in abundance. (B) 30 proteins with known functions showed a greater than 2-fold increase in abundance in MG132-treated extracts with FDR adjusted p-value of <0.05. (C–E) X. laevis egg extracts were immunodepleted using antibodies against TubGCP6 (TubGCP6Δ) or mock depleted as a control. Nuclei were assembled in immunodepleted extracts, then extracts were supplemented with 500 μM MG132 or an equivalent volume of buffer (Control). After a 45-min incubation, nuclei were fixed and immunofluorescence against the NPC was performed with mAb414. (C) Representative confocal images are shown. The scale bar is 20 μm. (D) Nuclear CS area was quantified as in Figure 1. (E) Nuclear roundness was quantified as in Figure 1. Nuclear CS area and roundness were quantified for >100 nuclei per condition and three biological replicates. Error bars represent SD. Ordinary One-Way ANOVA: ns, not significant; ∗∗∗∗p < 0.0001. See also Figure S3 and Tables S1 and S2.

Similar articles

Cited by

References

    1. Vuković L.D., Jevtić P., Edens L.J., Levy D.L. New Insights into Mechanisms and Functions of Nuclear Size Regulation. Int. Rev. Cell Mol. Biol. 2016;322:1–59. doi: 10.1016/bs.ircmb.2015.11.001. - DOI - PubMed
    1. Jevtić P., Levy D.L. Nuclear size scaling during Xenopus early development contributes to midblastula transition timing. Curr. Biol. 2015;25:45–52. doi: 10.1016/j.cub.2014.10.051. - DOI - PMC - PubMed
    1. Levy D.L., Heald R. Mechanisms of intracellular scaling. Annu. Rev. Cell Dev. Biol. 2012;28:113–135. doi: 10.1146/annurev-cellbio-092910-154158. - DOI - PubMed
    1. Wühr M., Chen Y., Dumont S., Groen A.C., Needleman D.J., Salic A., Mitchison T.J. Evidence for an upper limit to mitotic spindle length. Curr. Biol. 2008;18:1256–1261. doi: 10.1016/j.cub.2008.07.092. - DOI - PMC - PubMed
    1. Mishra S., Levy D.L. Nuclear F-actin and Lamin A antagonistically modulate nuclear shape. J. Cell Sci. 2022;135 doi: 10.1242/jcs.259692. - DOI - PMC - PubMed

LinkOut - more resources