. 2025 Mar;37(12):e2407728.
doi: 10.1002/adma.202407728. Epub 2025 Jan 15.

Leveraging Optical Anisotropy of the Morpho Butterfly Wing for Quantitative, Stain-Free, and Contact-Free Assessment of Biological Tissue Microstructures

Affiliations

Leveraging Optical Anisotropy of the Morpho Butterfly Wing for Quantitative, Stain-Free, and Contact-Free Assessment of Biological Tissue Microstructures

Paula Kirya et al. Adv Mater. 2025 Mar.

Abstract

Changes in the density and organization of fibrous biological tissues often accompany the progression of serious diseases ranging from fibrosis to neurodegenerative diseases, heart disease and cancer. However, challenges in cost, complexity, or precision faced by existing imaging methodologies and materials pose barriers to elucidating the role of tissue microstructure in disease. Here, we leverage the intrinsic optical anisotropy of the Morpho butterfly wing and introduce Morpho-Enhanced Polarized Light Microscopy (MorE-PoL), a stain- and contact-free imaging platform that enhances and quantifies the birefringent material properties of fibrous biological tissues. We develop a mathematical model, based on Jones calculus, which describes fibrous tissue density and organization. As a representative example, we analyzed collagen-dense and collagen-sparse human breast cancer tissue sections and leverage our technique to assess the microstructural properties of distinct regions of interest. We compare our results with conventional Hematoxylin and Eosin (H&E) staining procedures and second harmonic generation (SHG) microscopy for fibrillar collagen detection. Our findings demonstrate that our MorE-PoL technique provides a robust, quantitative, and accessible route toward analyzing biological tissue microstructures, with great potential for application to a broad range of biological materials.

Keywords: histopathology; morpho butterfly wing; photonic surface; polarized light; structural color; tissue imaging; tissue microstructure.


Conflict of interest statement

The authors declare no conflict of interest.

Figures
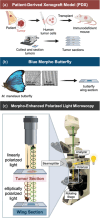
Figure 1
Figure 1
Schematic of Morpho‐enhanced Polarized Light Microscopy (MorE‐PoL), the imaging platform introduced in this work. a) The studied histological murine human breast cancer xenograft tissue sections (3 µm thickness) are obtained from a Patient‐derived Xenograft Model (see Experimental Section). b) Optical anisotropy and structural color from the Morpho menelaus butterfly wing, as shown in a photograph and scanning electron micrographs, was leveraged in this work (see Experimental Section). c) Principle of operation of MorE‐PoL. The glass slide containing the Morpho wing section was placed underneath the glass slide with the histological tumor section onto the rotating stage of the polarized light microscope. This arrangement was imaged between crossed linear polarizers and the stage was rotated counterclockwise from 0° to 180° in 15° increments. The samples were imaged under episcopic illumination with the Nikon ECLIPSE LV100ND polarized light microscope. Illumination from a halogen lamp was sent through a linear analyzer and passed through a beamsplitter to illuminate the Morpho+Tissue sample. Inset: Linearly polarized light transmitted through fibrous biological tissue obtains a degree of ellipticity which is further enhanced upon interaction with the Morpho butterfly wing. The output signal is imaged through a linear analyzer and assessed with Jones calculus. Created in BioRender. Poulikakos, L. (2024) https://BioRender.com/l77d349. Illustration of Nikon ECLIPSE LV100ND polarized light microscope adapted in canva.com from a photograph taken with a mobile phone camera.
Figure 2
Figure 2
Table describing collagen arrangements (a–d) corresponding to distinct intensity profiles fit to our Jones calculus model (Equation 3) (e–h). a,e) Case 1: ordered and dense, ↑R 2, ↑δ, b,f) Case 2: disordered and dense, ↓R 2, ↑δ, (c,g) Case 3: ordered and sparse, ↑R 2, ↓δ, (d,h) Case 4: disordered and sparse, ↓R 2, ↓δ. e) Case 1: R 2 =  1.000, δ  =  90.012° ± 0.057°, f) Case 2: R 2 =  0.1818, δ  =  48.048° ± 38.239°, g) Case 3: R 2 =  1.000, δ  =  45.000° ± 0.000°, h) Case 4: R 2 =  0.1818, δ  =  25.457° ± 19.389°. Created in BioRender. Poulikakos, L. (2024) https://BioRender.com/m45y124.
Figure 3
Figure 3
Experimental characterization of the Morpho butterfly wing. a–d) Polarized light microscope images of the Morpho butterfly wing at varying optical axis orientations between crossed linear polarizers (parts a,b) and for circularly polarized light excitation with a linear analyzer (parts c,d). Scale bars for a–d are 100 µm. e) Reflectance spectra of the Morpho butterfly wing between crossed linear polarizers at 90° and 150° stage orientations. f) Jones calculus fit (Equation 3) of the Morpho butterfly wing between crossed linear polarizers at varying microscope stage angle orientations. g) Reflectance spectra of the Morpho butterfly wing for circularly polarized light excitation at 45° and 135° stage orientations. h) Histogram of the mean normalized Red, Green, Blue and Gray Value color signals obtained for images shown in parts c at 45° (darker histograms), and d at 135° (lighter histograms) stage orientations.
Figure 4
Figure 4
Collagen‐dense histological tumor section fiber arrangement Case 1 (ordered) and Case 2 (disordered) classification. a) MorE‐PoL images of section between crossed polarizers in reflectance for θ  =  45° − 90°. b) Unstained, FFPE tumor section imaged between crossed linear polarizers. c) Unstained, FFPE tumor section interfaced with the Morpho butterfly wing section imaged between crossed linear polarizers, ROIs representing Case 1 and Case 2 were encircled in FIJI. d) Deparaffinized histological tumor section stained with H&E imaged in transmission. e) SHG micrograph of deparaffinized H&E‐stained section. Scale bars for a‐e are 100 µm. Section in parts b,c,d,e is positioned at 𝜃 = 45°. f,g) Jones calculus fit of average grayscale intensity within encircled ROI at 15° increments of microscope stage rotation from 0° to 180° for Case 1 (part f) and Case 2 (part g). Parameters ϕ and δ were optimized for the Jones fit equation (Equation 3) in the MATLAB Curve Fitter tool (see Experimental Section) to produce the curves for Case 1 (part f) and Case 2 (part g). Curves were overlaid with plots of the mean normalized ROI pixel intensity at each stage orientation.
Figure 5
Figure 5
Collagen‐sparse histological tumor section fiber arrangement characterization Case 3 and Case 4 classification. a) MorE‐PoL images of section between crossed polarizers in reflectance for 𝜃 = 45°–90°. b) Unstained, FFPE tumor section imaged between crossed linear polarizers. c) Unstained, FFPE tumor section interfaced with the Morpho butterfly wing section imaged between crossed linear polarizers, ROIs representing Case 3 and Case 4 are encircled in FIJI. d) Deparaffinized histological tumor section stained with H&E imaged in transmission. e) SHG micrograph of H&E‐stained section. Scale bars for a‐e are 100 µm. Section in parts b,c,d,e is positioned at 𝜃 = 45°. f,g) Jones fit of average grayscale intensity within encircled ROI at 15° increments of microscope stage rotation from 0° to 180° for Case 3 (part e) and Case 4 (part f). Parameters ϕ and δ were optimized for the Jones fit equation (Equation 3) in the MATLAB Curve Fitter tool (see Experimental Section) to produce the curves for Case 3 (part f) and Case 4 (part g). Curves were overlaid with plots of the mean ROI pixel intensity at each stage orientation.
Figure 6
Figure 6
MorE‐PoL of the studied collagen‐dense and collagen‐sparse histological tumor sections for circularly polarized light illumination with a linear analyzer. a) MorE‐PoL images of collagen‐dense section for stage orientation 𝜃 = 45°. ROIs representing Cases 1 and 2. b,c) Average normalized RGB color channel and grayscale pixel intensity for Case 1 (part b) and Case 2 (part c) for 45° (darker histograms) and 135° (lighter histograms) stage rotation. d) MorE‐PoL images of collagen‐sparse section for stage orientation 𝜃 = 45°. ROIs representing Cases 3 and 4. e,f) Average normalized RGB color channel and grayscale pixel intensity for Case 3 (part e) and Case 4 (part f) for 45° (darker histograms) and 135° (lighter histograms) stage rotation. Scale bars are 100 µm. Pixel values were calculated in MATLAB.

Update of

References

    1. Haddadin Z., Pike T., Moses J. J., Poulikakos L. V., J. Mater. Chem. C 2021, 9, 11619.
    1. Lu S.‐Y., Chipman R. A., JOSA A 1996, 13, 1106.
    1. Ghosh N., Wood M. F. G., Li S., Weisel R. D., Wilson B. C., Li R.‐K., Vitkin I. A., J. Biophotonics 2009, 2, 145. - PubMed
    1. Cowin S. C., J. Biomech. Eng. 2000, 122, 553. - PubMed
    1. Chen X., Nadiarynkh O., Plotnikov S., Campagnola P. J., Nat. Protoc. 2012, 7, 654. - PMC - PubMed