. 2025 Dec;17(1):2450207.
doi: 10.1080/19490976.2025.2450207. Epub 2025 Jan 15.

Host-microbe multi-omics and succinotype profiling have prognostic value for future relapse in patients with inflammatory bowel disease

Affiliations

Host-microbe multi-omics and succinotype profiling have prognostic value for future relapse in patients with inflammatory bowel disease

Jill O'Sullivan et al. Gut Microbes. 2025 Dec.

Abstract

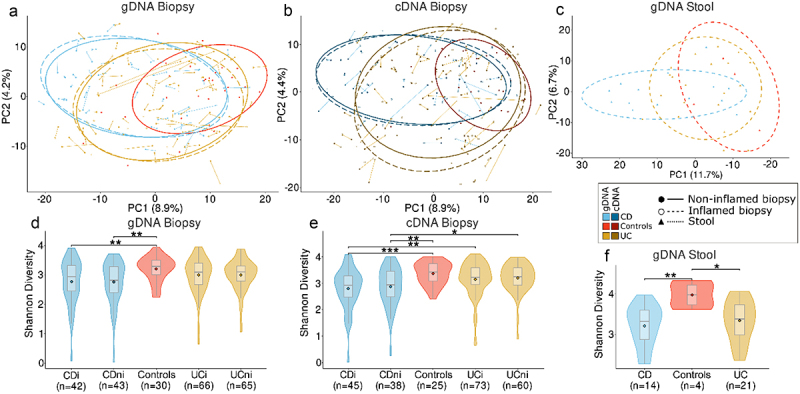
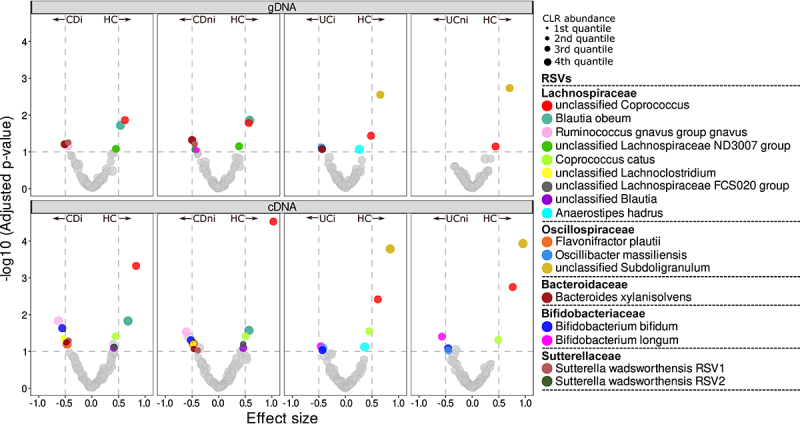
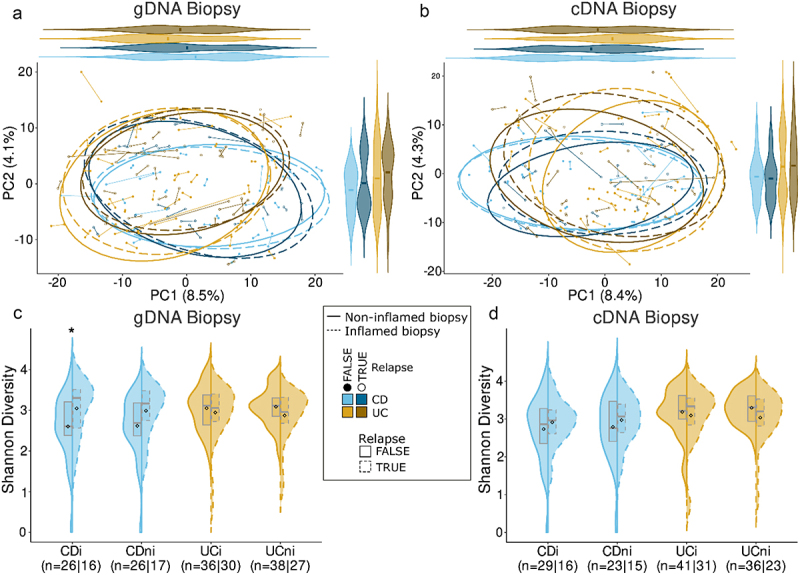
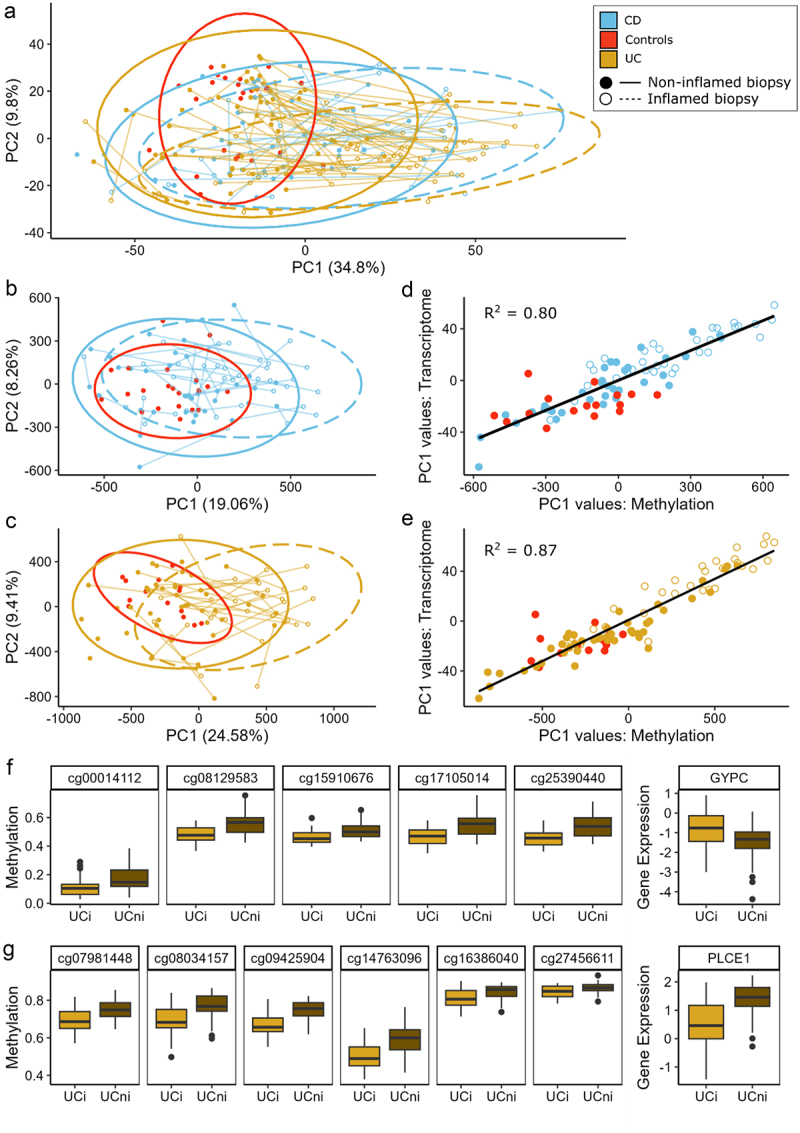
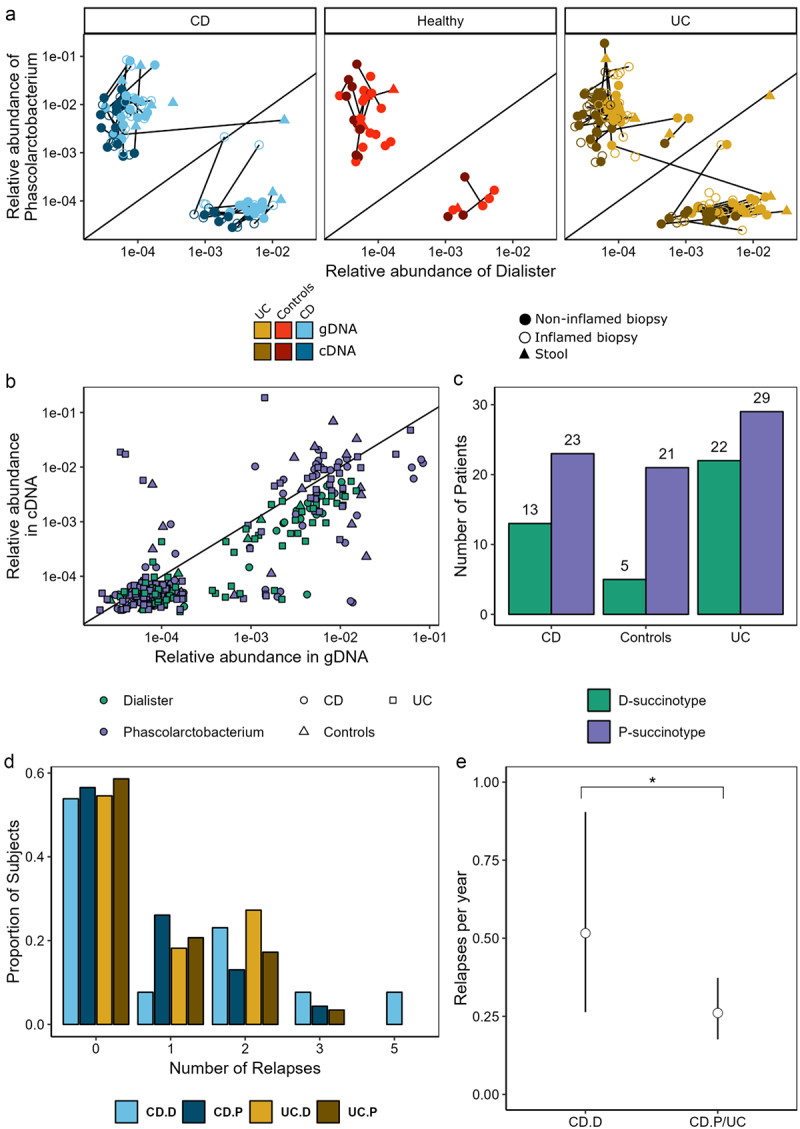
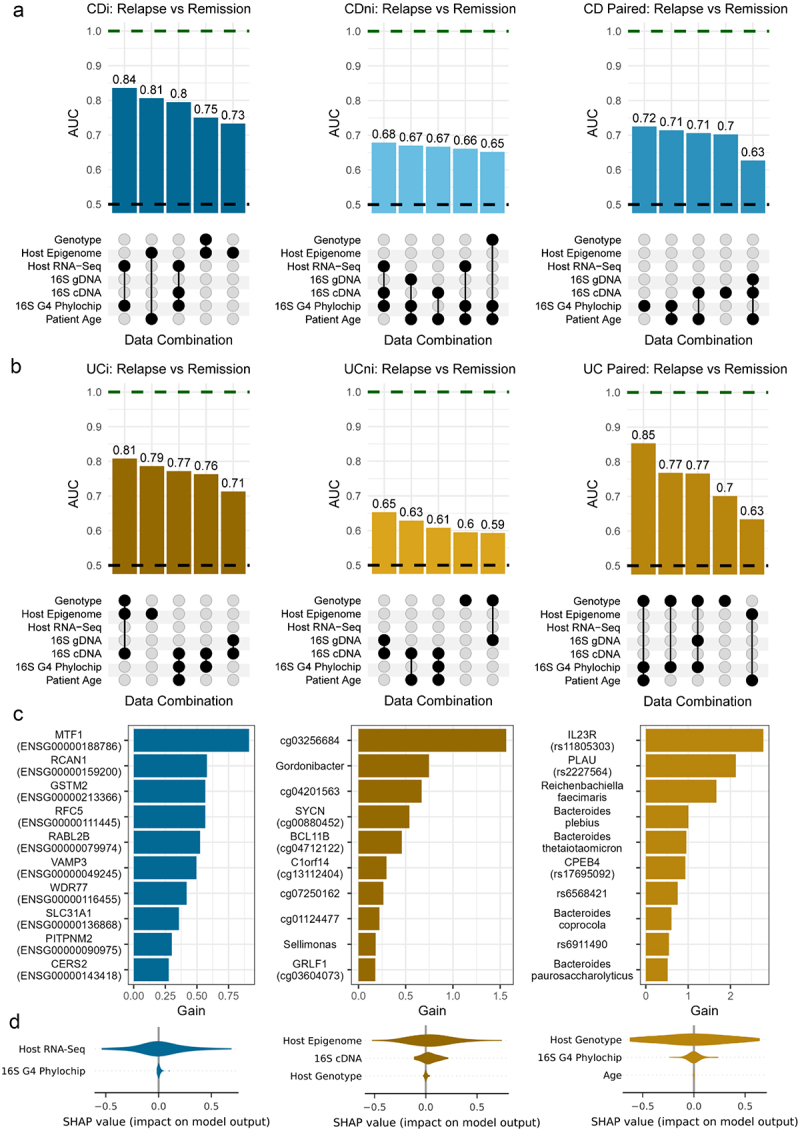
Crohn's disease (CD) and ulcerative colitis (UC) are chronic relapsing inflammatory bowel disorders (IBD), the pathogenesis of which is uncertain but includes genetic susceptibility factors, immune-mediated tissue injury and environmental influences, most of which appear to act via the gut microbiome. We hypothesized that host-microbe alterations could be used to prognostically stratify patients experiencing relapses up to four years after endoscopy. We therefore examined multiple omics data, including published and new datasets, generated from paired inflamed and non-inflamed mucosal biopsies from 142 patients with IBD (54 CD; 88 UC) and from 34 control (non-diseased) biopsies. The relapse-predictive potential of 16S rRNA gene and transcript amplicons (standing and active microbiota) were investigated along with host transcriptomics, epigenomics and genetics. While standard single-omics analysis could not distinguish between patients who relapsed and those that remained in remission within four years of colonoscopy, we did find an association between the number of flares and a patient's succinotype. Our multi-omics machine learning approach was also able to predict relapse when combining features from the microbiome and human host. Therefore multi-omics, rather than single omics, better predicts relapse within 4 years of colonoscopy, while a patient's succinotype is associated with a higher frequency of relapses.

Keywords: Crohn’s disease; gut microbiome; host-microbe interactions; inflammatory bowel disease; machine learning; ulcerative colitis.


Conflict of interest statement

G.E.L is an employee and shareholder of PharmaBiome AG and inventor on the patent application WO 2023/118460 A1 entitled “New biomarker for disorders and diseases associated with intestinal dysbiosis”. M.J.C. is co-founder and Head of Bioinformatics of SeqBiome. T.Z.D. is a co-founder and was Vice-president of Second Genome; S.I., K.D., and E.R. were employees of Second Genome at the time of the analysis. F.S. is a co-founder of three campus companies: Alimentary Health Ltd, Tuscan Health Ltd (now names 4D Pharma Cork) and Alantia Food Clinical Trials.

Figures

Figure 1.
Figure 1.
Microbiota composition and diversity of Crohn’s disease (CD), ulcerative colitis (UC) and control subjects. Principal component analysis (PCA) based on Aitchison distances of all RSVs present in > 5% of samples in at least one dataset under consideration for (a) gDNA biopsy, (b) cDNA biopsy and (c) gDNA stool datasets, respectively. Samples are grouped by disease type and inflammation status. Points connected by lines highlight samples from the same patient. d-f) Comparison of alpha diversity using the Shannon diversity index for each 16S rRNA dataset. Diversity is compared for each disease type and inflammation status. *p < 0.05, **p < 0.01, ***p < 0.001.
Figure 2.
Figure 2.
Volcano plots of differential abundance analysis comparing RSV abundances of CD and UC subjects to controls. Analysis was repeated for each inflammation status and 16S rRNA data type. Points above the horizontal line represent those taxa with an adjusted p-value (q) < 0.1 and those outside the vertical lines have an effect size >±0.5. Species abundance is denoted by point size where 4th quantile denotes that the species is in the least abundant category.
Figure 3.
Figure 3.
Comparison of microbiota composition and diversity between patients with IBD who experienced a relapse of disease and those who remained in remission within 4 years of sampling. (a-b) Principal component analysis (PCA) based on Aitchison distances grouped by relapse status, inflammation status and disease type with analysis repeated for 16S gDNA and cDNA datasets, respectively. (c-d) Comparison of Shannon alpha diversity between relapse and remission groups for gDNA and cDNA datasets respectively. *p < 0.05.
Figure 4.
Figure 4.
Host gene expression and DNA methylation in Crohn’s disease (CD), ulcerative colitis (UC) and control subjects. (a) PCA plot based on Aitchison distances of Host RNA-Seq data grouped by disease type and inflammation status of samples. Points connected by lines highlight those samples from the same patient. (b-c) PCA plots of Host epigenetic data grouped by disease type and inflammation status for those samples generated using the 450K and EPIC methylation arrays, respectively. (d-e) Plot of PC1 values comparing Host methylation and Host transcriptome for each methylation array. (f) Boxplots of methylation of CpG sites associated with the promoter region of the GYPC gene and its corresponding gene expression. (g) Boxplots of methylation of CpG sites associated with the gene body of PLCE1 and its corresponding gene expression.
Figure 5.
Figure 5.
Succinotypes can be defined in CD, UC and control subjects. (a) Relative abundance of Dialister vs Phascolarctobacterium within samples for both standing and active datasets. (b) Comparison of the relative abundance of genera in gDNA and cDNA. (c) Bar plot of succinotypes grouped by disease-type. (d) Number of relapses by disease and succinotype. (e) Relapses per year with 95% confidence intervals for CD.D vs all other groups estimated using zero-inflated poisson model. *p < 0.1.
Figure 6.
Figure 6.
Outline of XGBoost model performance to predict relapse in (a) Crohn’s disease (CD) and (b) ulcerative colitis (UC) subjects. UpSet plots outline AUCs and the combination of features used to achieve model performance. Top row shows top 5 models when predicting future relapse in patients with CD, where models were trained on inflamed, non-inflamed and paired data, respectively (left-right). Second row shows top 5 models when predicting future relapse in patients with UC. Green dashed line indicates perfect performance. Black dashed line is equivalent to a random model. (c) Top 10 important features based on gain importance metric from XGBoost. Features presented are those from the highest performing model when models were trained on CDi, UCi and UC paired samples, respectively (left-right). (d) SHAP values extracted from same models as c) but values were grouped (summed) by those omics types used to train the model.

References

    1. Lloyd-Price J, Arze C, Ananthakrishnan AN, Schirmer M, Avila-Pacheco J, Poon TW, Andrews E, Ajami NJ, Bonham KS, Brislawn CJ, et al. Multi-omics of the gut microbial ecosystem in inflammatory bowel diseases. Nature. 2019;569(7758):655–25. doi:10.1038/s41586-019-1237-9. - DOI - PMC - PubMed
    1. Franzosa EA, Sirota-Madi A, Avila-Pacheco J, Fornelos N, Haiser HJ, Reinker S, Vatanen T, Hall AB, Mallick H, McIver LJ, et al. Gut microbiome structure and metabolic activity in inflammatory bowel disease. Nat Microbiol. 2019;4(2):293–305. doi:10.1038/s41564-018-0306-4. - DOI - PMC - PubMed
    1. Lavelle A, Sokol H.. Gut microbiota-derived metabolites as key actors in inflammatory bowel disease. Nat Rev Gastroenterol Hepatol. 2020;17(4):223–237. doi:10.1038/s41575-019-0258-z. - DOI - PubMed
    1. Clooney AG, Eckenberger J, Laserna-Mendieta E, Sexton KA, Bernstein MT, Vagianos K, Sargent M, Ryan FJ, Moran C, Sheehan D, et al. Ranking microbiome variance in inflammatory bowel disease: a large longitudinal intercontinental study. Gut. 2021;70(3):499–510. doi:10.1136/gutjnl-2020-321106. - DOI - PMC - PubMed
    1. Ryan FJ, Ahern AM, Fitzgerald RS, Laserna-Mendieta EJ, Power EM, Clooney AG, O’Donoghue KW, McMurdie PJ, Iwai S, Crits-Christoph A, et al. Colonic microbiota is associated with inflammation and host epigenomic alterations in inflammatory bowel disease. Nat Commun. 2020;11(1):1–12. doi:10.1038/s41467-020-15342-5. - DOI - PMC - PubMed

MeSH terms

Substances

LinkOut - more resources