The Development of a Reverberation Chamber for the Assessment of Biological Effects of Electromagnetic Energy Absorption in Mice
- PMID: 39812400
- PMCID: PMC11734383
- DOI: 10.1002/bem.22539
The Development of a Reverberation Chamber for the Assessment of Biological Effects of Electromagnetic Energy Absorption in Mice
Abstract
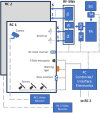
In this paper, we present the design, RF-EMF performance, and a comprehensive uncertainty analysis of the reverberation chamber (RC) exposure systems that have been developed for the use of researchers at the University of Wollongong Bioelectromagnetics Laboratory, Australia, for the purpose of investigating the biological effects of RF-EMF in rodents. Initial studies, at 1950 MHz, have focused on investigating thermophysiological effects of RF exposure, and replication studies related to RF-EMF exposure and progression of Alzheimer's disease (AD) in mice predisposed to AD. The RC exposure system was chosen as it allows relatively unconstrained movement of animals during exposures which can have the beneficial effect of minimizing stress-related, non-RF-induced biological and behavioral changes in the animals. The performance of the RCs was evaluated in terms of the uniformity of the Whole-Body Average-Specific Absorption Rate (WBA-SAR) in mice for a given RF input power level. The expanded uncertainty in WBA-SAR estimates was found to be 3.89 dB. Validation of WBA-SAR estimates based on a selected number of temperature measurements in phantom mice found that the maximum ratio of the temperature-derived WBA-SAR to the computed WBA-SAR was 1.1 dB, suggesting that actual WBA-SAR is likely to be well within the expanded uncertainties.
Keywords: SAR validation; computational modeling; reverberation chamber; uncertainty.
© 2025 The Author(s). Bioelectromagnetics published by Wiley Periodicals LLC on behalf of Bioelectromagnetics Society.
Conflict of interest statement
The first, third, and fourth listed authors are former employees of a telecommunications company; the second author is a current employee of a telecommunications company; the third author is a former employee of a national telecommunications industry association.
Figures


Similar articles
-
1950 MHz radiofrequency electromagnetic fields do not aggravate memory deficits in 5xFAD mice.Bioelectromagnetics. 2016 Sep;37(6):391-9. doi: 10.1002/bem.21992. Epub 2016 Jul 19. Bioelectromagnetics. 2016. PMID: 27434853 Free PMC article.
-
Exposure time-dependent thermal effects of radiofrequency electromagnetic field exposure on the whole body of rats.J Toxicol Sci. 2016;41(5):655-66. doi: 10.2131/jts.41.655. J Toxicol Sci. 2016. PMID: 27665775
-
Characterising core body temperature response of free-moving C57BL/6 mice to 1.95 GHz whole-body radiofrequency-electromagnetic fields.Bioelectromagnetics. 2024 Dec;45(8):387-398. doi: 10.1002/bem.22527. Epub 2024 Oct 14. Bioelectromagnetics. 2024. PMID: 39402826
-
Effects of radiofrequency electromagnetic field (RF-EMF) exposure on male fertility: A systematic review of experimental studies on non-human mammals and human sperm in vitro.Environ Int. 2024 Mar;185:108509. doi: 10.1016/j.envint.2024.108509. Epub 2024 Feb 19. Environ Int. 2024. PMID: 38492496
-
Effects of Radiofrequency Electromagnetic Field (RF-EMF) exposure on pregnancy and birth outcomes: A systematic review of experimental studies on non-human mammals.Environ Int. 2023 Oct;180:108178. doi: 10.1016/j.envint.2023.108178. Epub 2023 Aug 30. Environ Int. 2023. PMID: 37729852
Cited by
-
Characterization of the Core Temperature Response of Free-Moving Rats to 1.95 GHz Electromagnetic Fields.Bioelectromagnetics. 2025 Jul;46(5):e70013. doi: 10.1002/bem.70013. Bioelectromagnetics. 2025. PMID: 40569088 Free PMC article.
References
-
- Andrieu, G. , Ticaud N., Lescoat F., and Trougnou L.. 2019. “Fast and Accurate Assessment of the ‘Well Stirred Condition’ of a Reverberation Chamber From S 11 Measurements.” IEEE Transactions on Electromagnetic Compatibility 61, no. 4: 974–982.
-
- Cerri, G. , Primiani V. M., Pennesi S., and Russo P.. 2005. “Source Stirring Mode for Reverberation Chambers.” IEEE Transactions on Electromagnetic Compatibility 47, no. 4: 815–823. 10.1109/TEMC.2005.858757. - DOI
-
- Chou, C.‐K. , and Guy A. W.. 1982. “Systems for Exposing Mice to 2,450‐MHz Electromagnetic Fields.” Bioelectromagnetics 3: 401–412. - PubMed
-
- Chou, C.‐K. , Guy A. W., McDougall J. A., and Lai H.. 1985. “Specific Absorption Rate in Rats Exposed to 2,450‐MHz Microwaves Under Seven Exposure Conditions.” Bioelectromagnetics 6, no. 1: 73–88. - PubMed
MeSH terms
LinkOut - more resources
Full Text Sources
Medical
Miscellaneous

