Review
. 2025 Jan 15;17(1):109.
doi: 10.1007/s40820-024-01597-w.

Wearable Biodevices Based on Two-Dimensional Materials: From Flexible Sensors to Smart Integrated Systems

Affiliations
Review

Wearable Biodevices Based on Two-Dimensional Materials: From Flexible Sensors to Smart Integrated Systems

Yingzhi Sun et al. Nanomicro Lett. .

Abstract

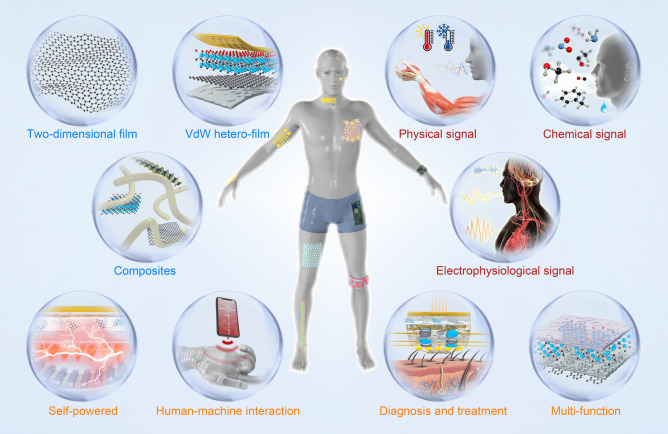
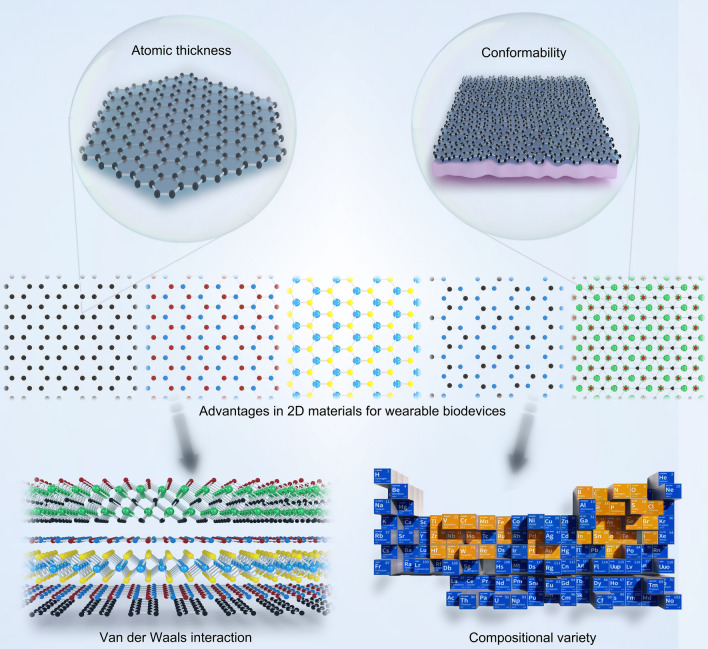
The proliferation of wearable biodevices has boosted the development of soft, innovative, and multifunctional materials for human health monitoring. The integration of wearable sensors with intelligent systems is an overwhelming tendency, providing powerful tools for remote health monitoring and personal health management. Among many candidates, two-dimensional (2D) materials stand out due to several exotic mechanical, electrical, optical, and chemical properties that can be efficiently integrated into atomic-thin films. While previous reviews on 2D materials for biodevices primarily focus on conventional configurations and materials like graphene, the rapid development of new 2D materials with exotic properties has opened up novel applications, particularly in smart interaction and integrated functionalities. This review aims to consolidate recent progress, highlight the unique advantages of 2D materials, and guide future research by discussing existing challenges and opportunities in applying 2D materials for smart wearable biodevices. We begin with an in-depth analysis of the advantages, sensing mechanisms, and potential applications of 2D materials in wearable biodevice fabrication. Following this, we systematically discuss state-of-the-art biodevices based on 2D materials for monitoring various physiological signals within the human body. Special attention is given to showcasing the integration of multi-functionality in 2D smart devices, mainly including self-power supply, integrated diagnosis/treatment, and human-machine interaction. Finally, the review concludes with a concise summary of existing challenges and prospective solutions concerning the utilization of 2D materials for advanced biodevices.

Keywords: Flexible sensor; Healthcare; Smart integrated system; Two-dimensional material; Wearable biodevice.


Conflict of interest statement

Declarations. Conflict of interest: The authors declare no interest conflict. They have no known competing financial interests or personal relationships that could have appeared to influence the work reported in this paper.

Figures

Fig. 1
Fig. 1
Overview of 2D material-based wearable devices and their health-related applications
Fig. 2
Fig. 2
Advantages in 2D materials for wearable devices. 2D materials, with their atomic thickness, excel in these areas by reducing strain and offering superior flexibility and elasticity, allowing them to conform closely to human tissues. The van der Waals interactions in these materials also enable the creation of multifunctional heterostructures with customizable properties. Additionally, the vast range of 2D materials, incorporating various elements, provides extensive opportunities for innovation in wearable technology
Fig. 3
Fig. 3
2D materials-based wearable sensors for monitoring physiological signals. 2D material-based wearable sensors for human health monitoring, capable of detecting intricate physiological signals. These sensors are categorized into three main types: physical signals, electrophysiological signals, and chemical signals
Fig. 4
Fig. 4
Durable and wide-range mechanical signal detection with 2D material-based wearable devices. a Schematic illustrating the concept of a graphene-based capacitive sensor. The sensor consists of three layers: patterned graphene electrodes on a PET film substrate. b Photograph of a mutual capacitance touch sensor based on graphene electrodes with a three-dimensional-sensing capability. c Capacitance change for approaching finger by 5 mm. Reproduced with permission: Copyright 2017, American Chemical Society [128]. d Schematic diagram of the compositional structure of the stretchable resistive strain sensor based on BN nanosheets and graphene nanoribbons (denoted TPU-BNNS). e TPU-BNNS strain sensor at the saturated temperature fluctuation range for more than 30 cycles between initial length and 100% strain. f Cyclic test of the TPU-BNNS sensor at 100% strain range for more than 5000 cycles, and the inset shows the enlarged view of the marked region. Reproduced with permission: Copyright 2020, Springer Nature [129]
Fig. 5
Fig. 5
High-sensitivity and dynamic monitoring of mechanical signals with 2D material-based wearable devices. a Schematic representation of in situ stretching and alignment of PVDF polymer chains to enhance spontaneous polarization (Ps) by the surface termination of Ti3C2Tx nanosheets. b Piezoelectric potential distribution in the visual structural modeling of the prepared PVDF and MXene composite textile. Note: For simulation, the stress applied along the z-axis is fixed at 106 Pa. c MXene-based piezoelectric sensor for gait monitoring. Reproduced with permission: Copyright 2022, Springer Nature [132]. d Schematic diagram of graphene electronic tattoo for blood pressure detection. e Schematic diagram of the blood pressure detection principle. f Comparison of the detection performance of graphene electronic tattoo with that of the commercial blood pressure detection devices rated as class A. Reproduced with permission: Copyright 2022, Springer Nature [133]
Fig. 6
Fig. 6
2D material-based wearable devices for body temperature detection. a Schematic representation of PU/graphene encapsulated skin–core structure PEDOT: PSS and composite fibers prepared into fabrics. b Current profiles of the composite fibers within the temperature range of 36.1–37.8 °C with an increment of 0.1 °C. c Stability of resistance exhibited by the composite fibers at different temperatures. Reproduced with permission: Copyright 2023, American Chemical Society [142]. d Structural schematic of the MoS2-based temperature sensor. e Calculated sensitivity of the MoS2 temperature sensors across various heating cycles and in the folded state, displaying an averaged sensitivity of -0.98 ± 0.03% °C−1. The sensitivity is determined using the (R1-R0)/R0(T1-T0) equation, where R0 and R1 represent the resistance at temperatures T0 and T1, respectively. f Dynamic cyclic electrical response and recovery curves of the sensor measured within the range of 38–42 °C. Reproduced with permission: Copyright 2022, Wiley–VCH [143]. g Schematic illustration of the heterojunction structure formed through the combination of Ru with V-MXene via atomic layer deposition. h Schematic depiction of the temperature sensor achieving both contact and non-contact temperature sensing. i Relative resistance changes of the developed temperature sensor as a function of temperature. Reproduced with permission: Copyright 2023, Wiley–VCH [144]
Fig. 7
Fig. 7
Detection of electrophysiological signals with 2D material-based wearable devices. a Schematic structural diagram of the MXene hydrogel epidermal sensor. b The epidermal sensor assembled from MXene hydrogel for ECG detection. c Comparison of EMG detection performance between MXene-based epidermal and commercial sensors. Reproduced with permission: Copyright 2022, Wiley–VCH [177]. d Schematic structural diagram of graphene-based electronic skin. e EOG measured with PTG (red), pure PEDOT: PSS (blue), and Ag/AgCl (black) electrodes showing peaks and troughs corresponding to eyelid movements. f PTG acquires sEMG from finger movements (thumb, index finger, middle finger, ring finger, and little finger). Reproduced with permission: Copyright 2021, Springer Nature [178]. g Structural diagram of graphene-based contact lens for ERG monitoring. h Optical transmittance of the bare Parylene-C, and graphene contact lens electrodes (GRACE) devices made from graphene grown on quartz (G-quartz) and graphene grown on Cu (G-Cu), all with Parylene thickness of 25 μm. The transmittance at 550 nm wavelength is shown in the inset. i Comparison of ERG monitoring performance with commercial electrodes. Reproduced with permission: Copyright 2018, Springer Nature [179]
Fig. 8
Fig. 8
Health-related gas detection using 2D material-based wearable devices. a Schematic structural diagram of a bendable NO2 gas sensor based on ultrathin In2O3/g-C3N4 heterostructure. b Influence of light intensity on the In2O3/g-C3N4 heterostructure-based sensor performance. c Repeatability of the In2O3/g-C3N4 heterostructure-based sensor toward 100 ppb and 1 ppm NO2 at room temperature under visible light illumination. Reproduced with permission: Copyright 2021, Wiley–VCH [221]. d Schematic structural diagram of the PtSe2-based NH3 sensor. e Comparison of limits of detection (LODs) of PtSe2-based NH3 sensor in a flat state and at 1/4 mm.−1 curvature strain. The inset shows the 3-cycle response test under 50 ppb NH3. f Performance comparison with other transition metal dichalcogenides (TMDs)-based gas sensors. Reproduced with permission: Copyright 2023, American Chemical Society [222]. g Structural diagram of SnS2-based NO sensor. h The sensing performance for different concentrations of NO in SnS2-based sensor. Note how the sensitivity reverses from negative to positive for NO concentrations ≥ 75 ppb. i Sensitivity in SnS2-based NO sensor as a function of different exhaled NO concentrations. Reproduced with permission: Copyright 2021, AAAS [223]
Fig. 9
Fig. 9
Body fluid detection with 2D material-based wearable devices. a Schematic diagram of the device configuration of the graphene-based sweat sensor. b Illustration depicting the reduction of ion diffusion paths in graphene electrodes within body fluid sensors. c Ion interference testing of the graphene sensor. Reproduced with permission: Copyright 2022, American Chemical Society [271]. d Schematic structural diagram of MXene-based body fluid sensor. e Measurement of glucose using the MXene-based body fluid sensor before and after meals. f The temporal current response of the lactate sensor at various time points during exercise. Reproduced with permission: Copyright 2019, Wiley–VCH [272]. g Schematic representation of the aptamer-modified graphene-Nafion field-effect transistor biosensor for cytokine biomarker detection. h Transfer characteristic curve measured upon exposure of the biosensor to various concentrations of IFN- γ in undiluted sweat. i Biosensors with different regeneration cycles were used to detect IFN- γ across concentrations ranging from 0.015 to 250 nM. Reproduced with permission: Copyright 2020, Wiley–VCH [273]
Fig. 10
Fig. 10
Self-powered wearable 2D material-based wearable devices. a Structural diagram of MXene/PVA self-powered device. b Triboelectric charging mechanism based on MXene/PVA hydrogel microchannels. c MXene/PVA-based smart wearable devices for handwriting recognition. Reproduced with permission: Copyright 2021, Wiley–VCH [282]. d Schematic of battery-free, biofuel-powered electronic skin. e Power density curves of biofuel cells in sweat samples sourced from four healthy humans. f Graphene-based sensors for real-time temperature, pH, and glucose monitoring. Reproduced with permission: Copyright 2020, AAAS [283]. g Structural diagram of GO-based self-powered sensor. h) The GO-based self-powered sensor detects respiratory signals at different frequencies. i Variations in short-circuit current (ΔI) of the GO-based self-powered sensor at different distances above the water surface. Reproduced with permission: Copyright 2022, Springer Nature [284]
Fig. 11
Fig. 11
Human–machine interaction with 2D material-based wearable devices. a Schematic diagram illustrating the three-dimensional structure of the cochlear implant based on MXene. b The operating principle of two-stage enhancement in MXene-based HMI devices. c Visualization of the pronunciation information of voice within 280 voices adopting t-distributed stochastic neighbor embedding (t-SNE) dimensionality reduction. Reproduced with permission: Copyright 2022, AAAS [318]. d Schematic diagram of the structure of a 10 × 10 sensor array based on MoS2. e Observation of MoS2 resistance change rate reflecting human respiratory humidity under different exercise states. f Black and white plots (top) of MoS2 (left) and nanographene (right) resistance change rates upon finger contact with the electronic skin, while the bottom images represent the corresponding relative humidity and strain distributions, respectively. Reproduced with permission: Copyright 2021, Wiley–VCH [322]. g Structural diagram of GO-based HMI sensor. h Spontaneous movement of hydrogen ions to the bottom under gradient diffusion, generating a potential difference at both ends of the GO-based HMI sensor. i Sequence of pressure changes received by the sensor under eight common sign language movements. Reproduced with permission: Copyright 2022, Wiley–VCH [323]
Fig. 12
Fig. 12
Integrated diagnosis and treatment devices using 2D materials. a Schematic diagram of an integrated system comprising diagnostic and therapeutic devices for real-time monitoring and treatment of chronic OSI. b Schematic diagram of Fab functionalization and antigen–antibody reaction of a graphene FET. c Detection of MMP-9 concentration and the instantaneous temperature control of the heat patch. Each plot shows real-time changes in the relative drain current of the contact lens (top) and the temperature of the heat patch (bottom). Reproduced with permission: Copyright 2021, AAAS [330]. d Schematic drawings of the diabetes patch, including the sweat-control (i, ii), sensing (iii–vii), and therapy (viii–x) components. e Schematic illustrations of bioresorbable microneedles. f Blood glucose concentrations of diabetic mice for the treated group (with the drug) and control groups (without the drug or patch). Reproduced with permission: Copyright 2016, Springer Nature [331]. g Structural schematic diagram of diagnosis and treatment system based on graphene. h Experiment setup for the diagnosis of kidney necrosis. i Comparison of average wound area over 10 days in three different groups (without patch, with patch but not heated, and with patch and heated group). Reproduced with permission: Copyright 2022, AAAS [332]
Fig. 13
Fig. 13
Implantable wearable devices based on 2D materials. a Schematic diagram of the structure and multi-array design of the graphene-based neural interface. b Schematic representation of an acute experiment using engineered graphene for neural interface micro-electrocorticography flexible array to record epicortical neural activity in a rat. The evoked activity was induced by pure tone stimuli. c Plots showcasing evoked neural activity in response to 16 kHz stimulation, depicting individual events on all 64 microelectrodes. Recorded responses include onset (green), offset (red), and both (yellow) or no onset/offset (dark gray) responses are recorded. Reproduced with permission: Copyright 2024, Springer Nature [345]. d Transparent and flexible 64-channel graphene array, with an enlarged section displaying graphene lines shown as white dashed lines. Scale bar, 100 μm. e Impedance distribution of 64 channels at 1 kHz measured before and after the deposition of platinum nanoparticles (PtNP). The average impedance of the electrodes before and after PtNP deposition was 5.4 ± 1.1 and 250 ± 56 kΩ (mean ± standard deviation), respectively. f Representative events on different channels trigger multiunit activity waveforms. Scale bar, 2 ms (horizontal) and 20 μV (vertical). Notably, multiple nearby channels also capture neural events, and they are color-coded to correspond with the target channel. Reproduced with permission: Copyright 2024, Springer Nature [346]. g Structural diagram of the laser-induced graphene heart patch. h Schematic representation of the cardiac patch utilized for signal monitoring such as arrhythmia. i Average amplitude of the atrial and ventricular signals recorded during 10 min in moribund rats. Reproduced with permission: Copyright 2024, Springer Nature [347]
Fig. 14
Fig. 14
Strategies for constructing high-performance wearable devices with 2D materials
Fig. 15
Fig. 15
Prospects of 2D material-based wearable biodevices. The next generation of wearable biodevices, from flexible sensors to advanced smart wearable systems, is anticipated to emerge with the advancement of 2D material synthesis methods, flexible sensor design, and performance assessment

References

    1. M. Lin, H. Hu, S. Zhou, S. Xu, Soft wearable devices for deep-tissue sensing. Nat. Rev. Mater. 7, 850–869 (2022). 10.1038/s41578-022-00427-y
    1. H.C. Ates, P.Q. Nguyen, L. Gonzalez-Macia, E. Morales-Narváez, F. Güder et al., End-to-end design of wearable sensors. Nat. Rev. Mater. 7, 887–907 (2022). 10.1038/s41578-022-00460-x - PMC - PubMed
    1. T.R. Ray, J. Choi, A.J. Bandodkar, S. Krishnan, P. Gutruf et al., Bio-integrated wearable systems: a comprehensive review. Chem. Rev. 119, 5461–5533 (2019). 10.1021/acs.chemrev.8b00573 - PubMed
    1. J. Heikenfeld, A. Jajack, J. Rogers, P. Gutruf, L. Tian et al., Wearable sensors: modalities, challenges, and prospects. Lab Chip 18, 217–248 (2018). 10.1039/c7lc00914c - PMC - PubMed
    1. C. Choi, Y. Lee, K.W. Cho, J.H. Koo, D.H. Kim, Wearable and implantable soft bioelectronics using two-dimensional materials. Acc. Chem. Res. 52, 73–81 (2019). 10.1021/acs.accounts.8b00491 - PubMed

LinkOut - more resources