. 2025 Jan 28;44(1):115156.
doi: 10.1016/j.celrep.2024.115156. Epub 2025 Jan 14.

The Golgi complex governs natural killer cell lytic granule positioning to promote directionality in cytotoxicity

Affiliations

The Golgi complex governs natural killer cell lytic granule positioning to promote directionality in cytotoxicity

Luis A Pedroza et al. Cell Rep. .

Abstract

Cytotoxic immune cells mediate precise attacks against diseased cells to maintain organismal health. Their operational unit of killing and host defense is lytic granules (LGs), which are specialized lysosomal-related organelles. Precision in cytotoxicity is achieved by converging the many LGs to the microtubule-organizing center (MTOC) and polarizing these to the diseased cell for secretion. We identify unappreciated intimate relationships between the Golgi, MTOC, and LGs after cytotoxic cell activation, as well as the trans-Golgin protein GCC2 on the LG surface. GCC2 serves to tether LGs to the Golgi following convergence, and both GCC2 and the Golgi are required for the persistence of convergence. GCC2 allows LGs to utilize the Golgi as a docking station preventing LG dispersion and innocent bystander killing in complex three-dimensional environments. We also identify GCC2 variants causing human natural killer cell deficiency, further emphasizing the importance of LG convergence and Golgi linkage in precision targeting for human immunity.

Keywords: CP: Immunology; GCC2; Golgi; Golgins; cancer; confocal microscopy; cytotoxicity; lytic granule convergence; natural killer cells.


Conflict of interest statement

Declaration of interests L.A.P., F.v.d.H., Y.L., and J.S.O. are inventors on a patent application (applied through the Trustees of Columbia University in the city of New York, application number PCT/US2023/01614, entitled “Compounds, targets, and methods for modulating lytic granule convergence in cytotoxic cells to promote bystander killing in cellular therapies”). J.R.L. has stock ownership in 23andMe and is a co-inventor on multiple patents related to molecular diagnostics for inherited neuropathies, eye diseases, genomic disorders, and bacterial genomic fingerprinting.

Figures
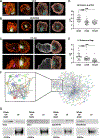
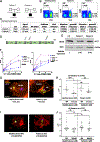
Figure 1.
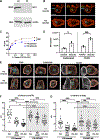
Figure 1.. The Golgi associates with lytic granules after NK cell activation
(A–C) YTS cells stably transduced with GALT-mCherry allow Golgi visualization (teal) imaged in combination with F-actin (via phalloidin, orange), the MTOC (via α-tubulin foci, purple), and LGs (via perforin, yellow) in cells adhered with non-activating anti-CD18(IB4) (A), cells activated with anti-CD18(IB4)/anti-CD28 (B), or in conjugation with 721.221 target cells (C). Left: original images; right: reconstructions using Imaris software (target cells, gray; scale bar, 10 μm). Left images in each pair show x, z; right images, x, y projections. (D and E) Average distance of LGs to the MTOC (D) and the Golgi (E) for 20 to 25 cells per condition: each point represents average distance in one cell derivative from 3 independently repeated experiments (**** = p < 0.0001 Mann-Whitney U tests). (F) Visualization of interaction of proteins identified on the LG surface by mass spectrometry after their surface biotinylation and streptavidin-based isolation. Inset denotes known protein associations with Golgi via STRING. (G) Western blot analysis confirmation of trans-Golgins within proteins extracted from purified LGs.
Figure 2.
Figure 2.. GCC2 is required for activation-induced LG convergence
(A and B) GCC2 expression was confirmed by (A) western blot analysis of whole-cell lysate and (B) confocal microscopy: F-actin (phalloidin, orange), Golgi (GALT-mCherry, teal), and GCC2 (anti-GCC2, yellow); scale bar, 10 μm. (C) Representative 4 h 51Cr-release assay cytotoxicity using YTS GCC2 KO or parental cells against 721.221 target cells (*** = p < 0.001 chi-squared tests). (D) Degranulation in YTS GCC2 KO or parental cells after 60 min of incubation with 721.221 target cells measured by mean fluorescence intensity (MFI) of CD107a. Data represented as mean ± SD of 3 independent repeats with individual values depicted (* = p < 0.05, *** = p < 0.001 Mann-Whitney U tests). (E) Representative rendered images from YTS parental or GCC2 KO cells stimulated with anti-CD18(IB4)/anti-CD28-coated glass or 721.221 target cells for 60 min: LGs (perforin, yellow), F-actin (phalloidin, orange), Golgi (mCherry-GALT, teal), and MTOC (α-tubulin purple); scale bar, 10 μm. The left image in each pair shows an x, z and the right image an x, y projection. (F and G) Mean distance of LGs to MTOC (F) and Golgi (G) measured from 20 to 25 cells per condition across 3 independent experiments in YTS parental (left) and YTS GCC2 KO (right, shaded) cells. (noted comparisions were different **** = p < 0.0001, *** = p < 0.001, * = p < 0.05, Mann-Whitney U tests).
Figure 3.
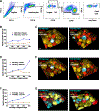
Figure 3.. GCC2 prevents bystander killing in multicellular microenvironments
(A) TheCOS stacks were digested, and cells were stained using LIVE/DEAD Near-IR and anti-CD56, -CD45, and -CD19 to allow for identification of live and dead effector, target, and bystander cells via gating. (B) Representative results of resistant K562 target cell “bystander” killing in TheCOS via flow cytometry by parental YTS (red) or YTS GCC2 KO (blue) with increasing percentages of susceptible 721.221 cells from 0 to 80% of the target cells in the TheCOS stack. (C) TheCOS stacks were cut and placed upon glass and imaged via confocal microscopy through the z axis. Three-dimensional reconstruction of images were generated to show vital dye-labeled parental YTS (teal), 721.221 triggering target cells (red), and resistant K562 “bystander” cells (yellow) with staining for perforin to visualize LGs (white); scale bar, 10 μm. (D–G) TheCOS experiments using the osteosarcoma cell lines LM7 (D and E) or 143B (F and G) substituted for the K562 “bystander” cells. After digestion of TheCOS stacks, (D) cells were evaluated by flow cytometry to measure LM7 osteosarcoma cell “bystander” killing by parental YTS (red) or YTS GCC2 KO (blue) cells with increasing percentages of susceptible 721.221 cells ranging from 0 to 80%. (E) Three-dimensional reconstruction of a TheCOS stack: vital dye-labeled parental YTS (teal), 721.221 triggering target cells (red), resistant LM7 osteosarcoma “bystander” cells (yellow), and perforin for LGs (white); scale bar, 10 μm. (F) After digestion of a TheCOS stack, cells were evaluated by flow cytometry to measure the 143B osteosarcoma cell “bystander” killing mediated by parental YTS (red) or YTS GCC2 KO (blue) cells with increasing percentages of susceptible 721.221 cells ranging from 0 to 80%. (G) Three-dimensional reconstruction of a TheCOS stack: vital dye-labeled parental YTS (teal), 721.221 triggering target cells (red), resistant 143B osteosarcoma “bystander” cells (yellow), and perforin for LGs (white); scale bar, 10 μm.
Figure 4.
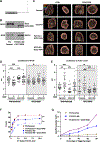
Figure 4.. Ectopic expression of GCC2 at the cell membrane blocks LG convergence and enhances bystander killing
(A) Construct used for targeting GCC2 to the cell membrane. (B) Western blot analysis for GCC2 of whole-cell lysates confirming GCC2-KRAS expression (178 kDa) vs. endogenous GCC2 (185 kDa). (C) Representative reconstructed YTS cell images from parental and GCC2 KO, or GCC2 KO YTS reconstituted with the GCC2-KRAS, after stimulation with anti-CD18(IB4)/anti-CD28-coated glass for 60 min. LGs (perforin, yellow), F-actin (phalloidin, orange), Golgi (GALT-mCherry, teal), and the MTOC (α-tubulin purple); scale bar, 10 μm, x, z (left) and x, y (right) projections. (D and E) Mean distance of LGs to MTOC (D) and to the F-actin cortex (E) measured from 20 to 25 cells per condition across 2 independent experiments in YTS parental and GCC2 KO (left) and when stably transduced with GCC2-KRAS cells (right, shadowed). (noted comparisions were different **** = p < 0.0001, *** = p < 0.001, ** = p < 0.01, * = p < 0.05, Mann-Whitney U tests). (F) Cytotoxicity of YTS or GCC2 KO YTS cells with or without the GCC2-KRAS construct against 721.221 target cells measured by 51Cr-release assay. Individual points show technical triplicate means and represent 3 independent repeats (*** = p < 0.001 chi-squared test). (G) Representative flow cytometry viability assays after 4 h killing in TheCOS. Resistant K562 target cell “bystander” killing by parental YTS (brown), YTS GCC2 KO (blue), or GCC2 KO YTS+GCC2 KRAS (purple) with increasing percentages of susceptible 721.221 cells from 0 to 80% of the target cells in the TheCOS stack.
Figure 5.
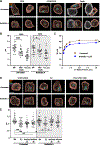
Figure 5.. Golgi maintains LG convergence after activation
(A) Representative rendered images of YTS cells untreated or treated with 1 μM Brefeldin A and stimulated with anti-CD18(IB4)/anti-CD28-coated glass or by 721.221 target cells for 60 min. LGs (perforin, yellow), F-actin (phalloidin, orange), Golgi (GALT-mCherry, teal), and the MTOC (α-tubulin purple), and target cells (gray), scale bar, 10 μm, x, z (left) and x, y (right) projections. (B) Mean distance of LGs to the MTOC in 20–25 cells per condition across 3 independent experiments in YTS that were unstimulated (anti-CD18 [IB4]) or stimulated (anti-CD18 [IB4]/anti-CD28) on coated glass or by conjugation with 721.221 target cells for 60 min; pretreated with (right, shadowed) or without (left) 1 μM Brefeldin A (noted comparisons were different **** = p < 0.0001, * = p < 0.05, Mann-Whitney U tests). (C) Representative 4 h 51Cr release killing assay against 721.221 target cells using YTS cells untreated (red) or pretreated (blue) with 1 μM Brefeldin A (means of technical triplicates, representative assay of n = 3, *p < 0.05 chi-squared tests). (D) Rendered images of YTS cells untreated (top) or treated with 1 μM Brefeldin A (bottom); unstimulated (left), stimulated with 100 units/mL IL-2 for 30 min (center), or stimulated for 30 min followed by IL-2 washout and 1 h incubation at 37°C (right). LGs (perforin, yellow), F-actin (phalloidin, orange), Golgi (GALT-mCherry, teal), and MTOC (α-tubulin, purple), x, z (left) and the right image x, y (right) projections. (E) Mean distance of LGs to the MTOC from 20 to 25 cells per condition (2 independent experiments) in untreated (left) or Brefeldin-treated (right, shadowed) cells after IL-2 stimulation, and 1 or 3 h after washing the stimulus. (noted comparisons were different *** = p < 0.0001, ** = p < 0.01, * = p < 0.05 Mann-Whitney U tests).
Figure 6.
Figure 6.. Biallelic mutations in GCC2 lead to an NK cell deficiency with impaired LG convergence
(A) Patients pedigree with biallelic GCC2 variants. (B) Flow cytometric analysis of total NK cells among PBMC. (C) Clinical and variant summary. (D) Schematic GCC2 with interspaced CC-D and GRIP domain regions (green) and disordered regions (gray) showing variant localization. (E) Western blot analysis of GCC2 expression in PBMC whole-cell lysates (HD relative expression shown at the bottom). (F) 4 h 51Cr-release assay of PBMC (patients, blue; HD purple) against K562 targets with (dashed line) or without (solid line) 1,000 U/mL added IL-2 (points = means of technical triplicates; representative assay of n = 2 is shown; **** = p < 0.0001 chi-squared test). (G) Confocal microscopy (x, y plane) of isolated NK cells from patient 2 incubated 60 min with 721.221 targets showing F-actin (phalloidin, orange), LGs (perforin, yellow), and MTOC (α-tubulin, purple); scale bar, 10 μm. (H) Mean distance of LGs to the MTOC after adherence to non-activating (anti-CD18 [IB4]) glass surface or conjugated to 721.221 target cells; minimum 20 cells per condition (noted comparisons were different **** = p < 0.0001, *** = p < 0.001, or not significant [ns] Mann-Whitney U tests). (I) Confocal microscopy (x, y plane) of isolated NK cells from patient 2 incubated 60 min on glass coated with anti-CD18(IB4) and anti-NKp30 showing F-actin (phalloidin, orange), LGs (perforin, yellow), and MTOC (α-tubulin, purple); scale bar, 10 μm. (J) Mean distance of LGs to the MTOC from a minimum of 20 cells per condition (noted comparisons were different; **** = p < 0.0001, *** = p < 0.001, ** = p < 0.01, or not significant (ns), Mann-Whitney U tests).
Figure 7.
Figure 7.. The common NKD GCC2 variant impairs directed killing and LG convergence
(A) GCC2 reconstitution confirmed by western blot analysis of whole-cell lysates. (B) 4 h 51Cr-release assay against 721.221 targets by YTS GCC2 KO cells reconstituted with either WT GCC2 or GCC2 E1608G. Individual points show technical triplicate means, showing a representative assay of n = 3 (noted comparisons were different **** = p < 0.0001, *** = p < 0.001, chi-squared test). (C) Mean distance of LGs to the MTOC in YTS GCC2 KO cells reconstituted with GCC2 WT, or GCC2 E1608G (after 40 min of stimulation on IB4/anti-CD28-coated glass; 20–25 cells per condition from 2 independent experiments; noted comparisons were different, *** = p < 0.001, * = p < 0.05). (D) Time-lapse live-cell confocal microscopy of conjugates between 721.221 targets (red) and YTS parental, YTS GCC2 KO, and YTS GCC2 KO reconstituted with WT GCC2 or GCC2 E1608G pre-loaded with Lysotracker Deep Red, LGs (yellow) (scale bar, 20 μm). Imaging began after 30 min of conjugation (time = 0), and images collected every 5 s (total = 100 frames, images from every ~2 min shown).

Similar articles

References

    1. Cooper MA, Fehniger TA, and Caligiuri MA (2001). The biology of human natural killer-cell subsets. Trends Immunol. 22, 633–640. 10.1016/s1471-4906(01)02060-9. - DOI - PubMed
    1. Hsu HT, Mace EM, Carisey AF, Viswanath DI, Christakou AE, Wiklund M, Önfelt B, and Orange JS (2016). NK cells converge lytic granules to promote cytotoxicity and prevent bystander killing. J. Cell Biol. 215, 875–889. 10.1083/jcb.201604136. - DOI - PMC - PubMed
    1. Gwalani LA, and Orange JS (2018). Single Degranulations in NK Cells Can Mediate Target Cell Killing. J. Immunol. 200, 3231–3243. 10.4049/jimmunol.1701500. - DOI - PMC - PubMed
    1. James AM, Hsu HT, Dongre P, Uzel G, Mace EM, Banerjee PP, and Orange JS (2013). Rapid activation receptor- or IL-2-induced lytic granule convergence in human natural killer cells requires Src, but not downstream signaling. Blood 121, 2627–2637. 10.1182/blood-2012-06-437012. - DOI - PMC - PubMed
    1. Ham H, Medlyn M, and Billadeau DD (2022). Locked and Loaded: Mechanisms Regulating Natural Killer Cell Lytic Granule Biogenesis and Release. Front. Immunol. 13, 871106. 10.3389/fimmu.2022.871106. - DOI - PMC - PubMed

Publication types

MeSH terms

Substances

Associated data

LinkOut - more resources