. 2025 Jan 21;122(3):e2413037121.
doi: 10.1073/pnas.2413037121. Epub 2025 Jan 15.

Dual modes of DNA N6-methyladenine maintenance by distinct methyltransferase complexes

Affiliations

Dual modes of DNA N6-methyladenine maintenance by distinct methyltransferase complexes

Yuanyuan Wang et al. Proc Natl Acad Sci U S A. .

Abstract

Stable inheritance of DNA N6-methyladenine (6mA) is crucial for its biological functions in eukaryotes. Here, we identify two distinct methyltransferase (MTase) complexes, both sharing the catalytic subunit AMT1, but featuring AMT6 and AMT7 as their unique components, respectively. While the two complexes are jointly responsible for 6mA maintenance methylation, they exhibit distinct enzymology, DNA/chromatin affinity, genomic distribution, and knockout phenotypes. AMT7 complex, featuring high MTase activity and processivity, is connected to transcription-associated epigenetic marks, including H2A.Z and H3K4me3, and is required for the bulk of maintenance methylation. In contrast, AMT6 complex, with reduced activity and processivity, is recruited by PCNA to initiate maintenance methylation immediately after DNA replication. These two complexes coordinate in maintenance methylation. By integrating signals from both replication and transcription, this mechanism ensures the faithful and efficient transmission of 6mA as an epigenetic mark in eukaryotes.

Keywords: AMT1; DNA N6-methyladenine (6mA); PCNA; maintenance methylation; methyltransferase.


Conflict of interest statement

Competing interests statement:The authors declare no competing interest.

Figures

Fig. 1.
Fig. 1.
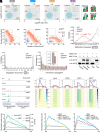
Two distinct AMT1 complexes with AMT6 or AMT7 as their mutually exclusive components. (A) Volcano plots of IP-MS results using AMT1, AMT6, and AMT7 as the bait. Bait: orange; high-confidence preys of interest: green; other high-confidence preys: red; low-confidence preys: gray. (B) IP-IB confirming the interaction of AMT1 with AMT6 and AMT7, respectively. Bait proteins were tagged with a hemagglutinin (HA), while prey proteins were tagged with 3×G196. (C) IP-IB confirming the lack of interaction between AMT6 and AMT7. Bait proteins were HA-tagged, while prey proteins were tagged with 3×G196. (D) Summary of interactions between AMT1 complexes according to IP-MS results. (E) SDS-PAGE analysis of recombinant AMT6 and AMT7 complexes with bacterially expressed proteins. (F) Detection of DNA methyltransferase (MTase) activities by DpnI digestion. Linearized plasmid DNA purified from dam- Escherichia coli was subject to in vitro methylation. Only methylated DNA was digested by DpnI, as seen in lanes treated by wild-type (WT) AMT6 and AMT7 complexes, as well as EcoGII. (G) Detection of DNA MTase activities by [3H]SAM labeling. 27bp double-strand DNA (dsDNA) substrates, with two ApT dinucleotides in the nonmethylated state (non), hemimethylated on the forward strand (hemi-f), hemimethylated on the reverse strand (hemi-r), or fully methylated (full), were subject to in vitro methylation by AMT6 and AMT7 complexes. DNA methylation was monitored by scintillation counting. Only background methylation was observed in fully methylated dsDNA, or single-strand DNA (ssDNA: f/r). Error bars represent SD (n = 3). (H) Enzyme kinetics of AMT6 and AMT7 complexes on hemimethylated DNA, quantified by [3H]SAM-labeling. Each data point was presented as mean ± SD (n = 3). Curve fitting was based on steady-state Michaelis–Menten kinetics. (I) Comparing AF3-predicted and published cryo-EM structures (20) of the heterodimeric core of AMT1 complexes. For AF3 modeling: AMT1, blue; AMT6, orange; AMT7, magenta. For the cryo-EM structure of AMT7 complex: AMT1, cadet blue; AMT7, hot pink; displayed as tube helices. (J) Detection of DNA binding by Electrophoretic Mobility Shift Assay (EMSA). Top panel: bound DNA (top band) progressively increased, while free DNA (Bottom) progressively decreased, as AMT6 and AMT7 complexes increased in concentration (1, 2, 4, 8 μM protein, 4 μM DNA); DNA binding ability was more prominent for AMT7 complex than AMT6 complex. 27bp nonmethylated DNA was used as substrate. Bottom panel: no substantial difference between dsDNA of different methylation states. (K) Detection of DNA binding by Surface Plasmon Resonance (SPR). Hemimethylated dsDNA was immobilized, while specified concentrations of AMT6 and AMT7 complexes were flowed. Equilibrium and kinetic constants were calculated by fitting to 1:1 Langmuir binding model. (L) AF3 predictions of the AMT7 apo-complex. Five high-confidence structures were used to illustrate the open to closed transition: AMT1, cornflower blue; AMT7, magenta; AMTP2, light gray; AMTP1, from open to closed: red, yellow, green, gray, and dark gray. (M) AF3 predictions of the AMT7 holo-complex bound to a dsDNA substrate (depicted in the double helix form). Five high-confidence structures were used to depict the stable conformations, with AMT1 in cornflower blue, AMT7 in magenta, AMTP2 in light gray, and AMTP1 in light sea green.
Fig. 2.
Fig. 2.
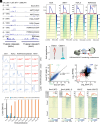
Distinct phenotypes of ΔAMT6 and ΔAMT7. (A) Representative bright-field images of WT, ΔAMT1, ΔAMT6, and ΔAMT7. Inset: zoom-in showing abnormally large contractile vacuoles (CV) frequently observed in ΔAMT1 and ΔAMT7(red arrowheads), but not in WT and ΔAMT6. Percentage of abnormally large CV-containing cells was marked. (B) 6mA distribution along Pol II-transcribed genes in WT, ΔAMT1, ΔAMT6, and ΔAMT7. Genes were ranked from low to high (quantiles 1 to 10, Q1 to Q10) according to their methylation levels (ΣP, sum of penetrance values for all methylated ApT positions in the gene body) in WT. Genes were scaled to unit length and extended to each side for 0.4 Kb. TSS, transcription start site. TES, transcription end site. (C) 6mA distribution on the gene body of Pol II-transcribed genes in WT, ΔAMT1, ΔAMT6, and ΔAMT7. (D) 6mA methylation level of 10 quantiles in WT, ΔAMT1, ΔAMT6, and ΔAMT7. y axis: ΣP for all methylated ApT positions in the gene body of a specified quantile. x axis: 10 quantiles of genes ranked by their 6mA methylation level (1 to 10, from low to high). (E) 6mA (SMRT CCS) and expression levels (RNA-seq) of RAB46 in WT, ΔAMT1, ΔAMT6, and ΔAMT7. (F) 6mA (ΣP) and expression levels (qRT-PCR) of RAB46 in WT, ΔAMT1, ΔAMT6, and ΔAMT7.
Fig. 3.
Fig. 3.
Distinct methylation characteristics, chromatin affinity, and genomic distribution of AMT6 and AMT7. (A) Full-6mApT and hemi-6mApT levels in WT, ΔAMT1, ΔAMT6, and ΔAMT7. Note the abundance of full methylation in WT and ΔAMT6, but its absence in ΔAMT1 and substantial reduction in ΔAMT7. (B) Two-dimensional (2D) distribution of all methylated DNA molecules in WT, ΔAMT6, and ΔAMT7, according to the number of hemi-6mApT (x axis) and full-6mApT sites (y axis) contained in each DNA molecule. (C) Methylation progression (MP) in WT, ΔAMT6, and ΔAMT7. MP was calculated as the difference-sum ratio between full-6mApT and hemi-6mApT on individual DNA molecules: (full-hemifull+hemi). (D) Segregation strand bias in WT, ΔAMT6, and ΔAMT7, defined as the difference-sum ratio between hemi-6mApT sites on W and C: (W-CW+C)s. (E) Full-6mApT congregation in DNA molecules undergoing hemi-to-full conversion in WT, ΔAMT6, and ΔAMT7. x axis: the probability for simulated max inter-full distances to be no greater than the observed value; y axis: the percentage of total DNA molecules with the corresponding probability. (F) Differential chromatin affinity of AMT6 and AMT7. AMT6 and AMT7 were fractionated by salt and detergent extraction (soluble and insoluble) and visualized by Immunoblot. (G) A representative genomic region showing distributions of AMT1, AMT6, and AMT7 along Pol II-transcribed genes in WT. Tracks (Top to Bottom): 6mA penetrance, ChIP input, AMT6, AMT7, and AMT1 ChIP, gene models: 6mA+ vs. 6mA− genes. (H) Distributions of 6mA, ChIP input, AMT1, AMT6, and AMT7 ChIP along the gene body in WT. The gene body, from TSS to TES, was normalized to unit length and extended in both directions by 0.4 kb. Pol II-transcribed genes (26,359 in total) were divided into 10 quantiles (Q1 to Q10: low-6mA level to high-6mA level) according to their mean methylation levels in WT. AMT1, AMT6, and AMT7 distributions were normalized by their read counts of Q1 in the gene body. Composite plot showed the distribution of Q1 and Q10. Heat map displayed all 10 quantiles. (I) 6mA, AMT1, AMT6, and AMT7 distributions from TSS and TES in Q10 (top quantile ranked by WT 6mA ΣP). Input was included as control for background. y axis: normalized read count (Left scale) and 6mA ΣP (Right scale). (J) AMT1 distribution along the gene body was affected by changing AMT6 or AMT7 levels, showcased for Q10. Left: AMT1 distribution in WT, AMT6-OE, and ΔAMT7. Right: AMT1 distribution in WT, AMT7-OE, and ΔAMT6.
Fig. 4.
Fig. 4.
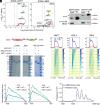
The association of AMT7 and 6mA with transcription. (A) A representative genomic locus showing distributions of 6mA, AMT7, H2A.Z, and H3K4me3 as well as gene expression in WT. Note the difference in the abundance of epigenetic marks between two neighboring genes. 6mA+: high 6mA level; 6mA−: low 6mA level. (B) Distributions of 6mA, AMT7, H2A.Z, and H3K4me3 along the gene body in WT. Composite plot showed the distribution of Q1 and Q10. Heat map displayed all 10 quantiles. (C) Correlations between 6mA, H2A.Z, H3K4me3, AMT7, and gene expression levels. 6mA levels: 6mA ΣP. H2A.Z, H3K4me3, and AMT7 levels: ChIP reads normalized by input across the gene body. Gene expression levels: RPKM for RNA-seq of WT. (D) 6mA penetrance in linker DNA (LD) dependent on whether none, one, or two of the flanking nucleosomes were enriched for H2A.Z and/or H3K4me3. 6mA was divided into 10 groups according to their penetrance (x axis). The percentage of a specific type of LD in each 6mA group was calculated (y axis). (E) Higher 6mA penetrance in LD when each of the two flanking nucleosomes were enriched for both H2A.Z and H3K4me3 (Class I) than when one mark was missing from either nucleosome or both (Class II). (F) Model: AMT7 complex is targeted by the dinucleosome containing H2A.Z and H3K4me3 for efficient 6mA deposition on LD. (G) 6mA levels of individual genes in WT and ΔMLL1. In ΔMLL1, 6mA levels substantially increased in many WT low-6mA genes, while remained stable in most WT high-6mA genes (dotted diagonal line). Each gene was assigned a coordinate: 6mA ΣP for WT (x axis) and ΔMLL1 (y axis). Group 1 were genes with low 6mA level in WT but elevated 6mA level in ΔMLL1: ΣPMLL1) ≥ 2 × ΣP(WT), ΣPMLL1) ≥ 2, ΣP(WT) ≤ 2. Group 2 were genes with stably low 6mA level in both cells: ΣPMLL1) < 2 × ΣP(WT), ΣPMLL1) < 2, ΣP(WT) ≤ 2. (H) 6mA in ΔMLL1 spread to genomic regions moderately enriched for H2A.Z (G1, group 1 defined in G), but remained unaffected in regions devoid of H2A.Z (G2, group 2 defined in G). (I) Relationship between changes in 6mA and gene expression in WT and ΔMLL1. ΔMLL1 vs. WT: Log2(FoldChange) for individual genes in 6mA (x axis: ΣP) and expression (y axis: RPKM). Blue: genes with significantly increased 6mA and expression levels (>2×). Red: genes with significantly decreased 6mA and expression levels (<0.5×).
Fig. 5.
Fig. 5.
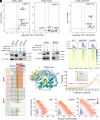
AMT7 complex is recruited by transcription-associated epigenetic pathways. (A) Volcano plots of IP-MS results using AMT7 (Left) and IBD2 (Right) as bait, respectively. AMT7 specifically interacted with IBD2, INO80 complex, and H2A.Z. Bait: orange; high-confidence preys of interest: green; other high-confidence preys: red; low-confidence preys: gray. (B) IP-IB confirming the interaction of IBD2 with AMT7, but not AMT6. Bait proteins were tagged with a HA, while prey proteins were tagged with 3×G196. (C) Illustration of domain structures of IBD2 containing BRD (bromodomain) and ET (extra-terminal domain) and GST pull-down assay. The direct interaction between the IBD2-GST and AMT7 complex was disrupted by the deletion of the ET domain (IBD2-ΔET-GST). (D) Distributions of AMT7, H2A.Z, and IBD2 along the gene body in WT. AMT7, H2A.Z, and IBD2 distributions were normalized by input read counts of Q1 in the gene body. Composite plot showed the distribution of Q1 and Q10. Heat map displayed all 10 quantiles. (E) AMT1 (Left) and AMT7 (Right) distributions (Q10) along the gene body were affected by deleting IBD2, showcased for Q10 genes. (F) Accumulation of hemi-6mApT along the gene body in ΔIBD2 relative to WT. y axis: 6mA frequency (6mA amount at a certain position/total 6mA amount).
Fig. 6.
Fig. 6.
AMT6 complex is recruited by PCNA and important for initiation of maintenance methylation after DNA replication. (A) Volcano plots of IP-MS results using AMT6 and PCNA as bait. AMT6 specifically interacted with PCNA. Bait: orange; high-confidence preys of interest: green; other high-confidence preys: red; low-confidence preys: gray. (B) Volcano plots of IP-MS results using AMT6-PIP as the bait. PIP mutation disrupted the interaction between AMT6 and PCNA interaction, but did not affect the integrity of AMT6 complex. (C) IP-IB confirming the interaction of PCNA with AMT6, but not AMT7. Bait proteins were tagged with a HA, while prey proteins were tagged with 3×G196. (D) IP-IB confirming that PIP mutation of AMT6 disrupted the interaction of PCNA with AMT6. Bait proteins were tagged with a HA, while prey proteins were tagged with 3×G196. (E) Sequence alignment of AMT6 and AMT7 homologs in ciliates. PIP was only conserved in AMT6 homologs but not AMT7 homologs. (F) AF3 prediction of the interaction between PCNA trimer and the PIP box of AMT6. The PIP-containing loop of AMT6 (EKKITDFFKR, shown in Lime stick) fit tightly into the hydrophobic cavity created by interdomain connecting loop of PCNA, with its surface colored by hydrophobicity. The molecular surface of PCNA are shown with coloring ranging from dark cyan (most hydrophilic) to white to dark goldenrod (most lipophilic). (G) Heat maps (Bottom) and composite plot (Top) showing increased hemi-6mApT downstream of TSS in AMT6-PIP. Composite plot showed the hemi-6mApT frequency. Heat map displayed all the well-annotated genes ranked by hemi-6mApT frequency (high to low). (H) 2D distribution of all methylated DNA molecules in WT, ΔAMT6, and AMT6-PIP. In ΔAMT6 and AMT6-PIP, accumulation of DNA molecules at the bottom right corner (relative to WT), corresponding to early methylation progress. (I) MP in WT, ΔAMT6, and AMT6-PIP. DNA molecules at early MP accumulated in ΔAMT6 and AMT6-PIP. Left: full plot. Right: zoom-in.
Fig. 7.
Fig. 7.
AMT6 and AMT7 complexes coordinate in 6mA transmission. Top: Multiple recognition that integrates signals from both replication and transcription to achieve specific methylation, including hemi-6mApT, PCNA, H2A.Z, H3K4me3, and possibly other transcription-associated epigenetic marks. Bottom: AMT6 and AMT7 are both required for efficient initiation of methylation after DNA replication, while AMT7 is required throughout methylation progression. AMT6 MTase activity is required for dissociative priming and AMT7 MTase activity is required for processive expansion.

Similar articles

Cited by

References

    1. Sanchez-Romero M. A., Cota I., Casadesus J., DNA methylation in bacteria: From the methyl group to the methylome. Curr. Opin. Microbiol. 25, 9–16 (2015). - PubMed
    1. Bochtler M., Fernandes H., DNA adenine methylation in eukaryotes: Enzymatic mark or a form of DNA damage? Bioessays 43, e2000243 (2021). - PubMed
    1. Wang Y., Chen X., Sheng Y., Liu Y., Gao S., N6-adenine DNA methylation is associated with the linker DNA of H2A.Z-containing well-positioned nucleosomes in Pol II-transcribed genes in Tetrahymena. Nucleic Acids Res. 45, 11594–11606 (2017). - PMC - PubMed
    1. Fu Y., et al. , N6-methyldeoxyadenosine marks active transcription start sites in Chlamydomonas. Cell 161, 879–892 (2015). - PMC - PubMed
    1. Mondo S. J., et al. , Widespread adenine N6-methylation of active genes in fungi. Nat. Genet. 49, 964–968 (2017). - PubMed

LinkOut - more resources