. 2025 Jan 15;17(781):eadj1445.
doi: 10.1126/scitranslmed.adj1445. Epub 2025 Jan 15.

Gene therapy ameliorates bowel dysmotility and enteric neuron degeneration and extends survival in lysosomal storage disorder mouse models

Affiliations

Gene therapy ameliorates bowel dysmotility and enteric neuron degeneration and extends survival in lysosomal storage disorder mouse models

Ewa A Ziółkowska et al. Sci Transl Med. .

Abstract

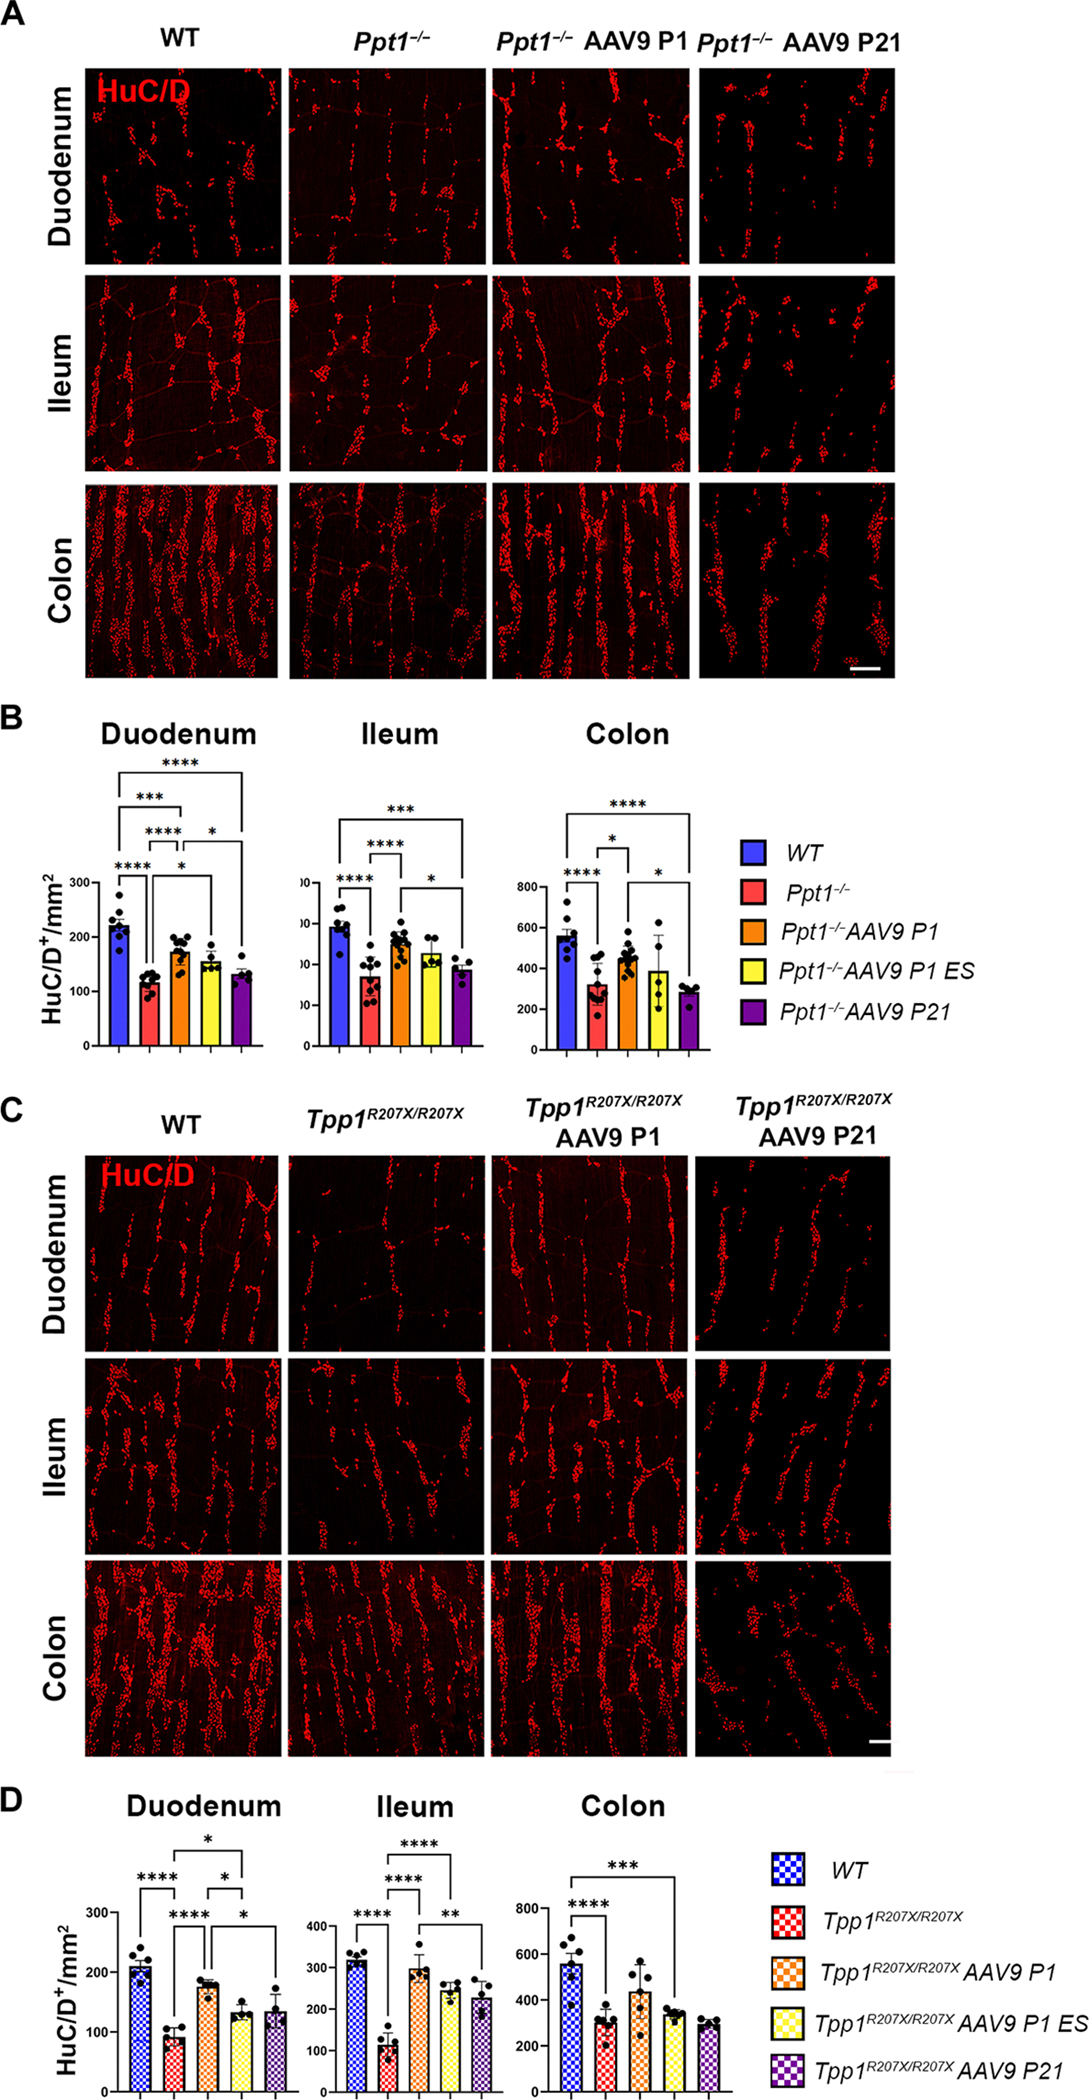
Children with neurodegenerative disease often have debilitating gastrointestinal symptoms. We hypothesized that this may be due at least in part to underappreciated degeneration of neurons in the enteric nervous system (ENS), the master regulator of bowel function. To test this hypothesis, we evaluated mouse models of neuronal ceroid lipofuscinosis type 1 and 2 (CLN1 and CLN2 disease, respectively), neurodegenerative lysosomal storage disorders caused by deficiencies in palmitoyl protein thioesterase-1 and tripeptidyl peptidase-1, respectively. Both mouse lines displayed slow bowel transit in vivo that worsened with age. Although the ENS appeared to develop normally in these mice, there was a progressive and profound loss of myenteric plexus neurons accompanied by changes in enteric glia in adult mice. Similar pathology was evident in colon autopsy material from a child with CLN1 disease. Neonatal administration of adeno-associated virus-mediated gene therapy prevented bowel transit defects, ameliorated loss of enteric neurons, and extended survival in mice. Treatment after weaning was less effective than treating neonatally but still extended the lifespan of CLN1 disease mice. These data provide proof-of-principle evidence of ENS degeneration in two lysosomal storage diseases and suggest that gene therapy can ameliorate ENS disease, also improving survival.


Conflict of interest statement

Competing interests: J.D.C. has received research support from BioMarin Pharmaceutical Inc., Abeona Therapeutics Inc., REGENXBIO Inc., and Neurogene and has been a consultant for Abeona Therapeutics Inc., JCR Pharmaceuticals, M6P Therapeutics, REGENXBIO Inc., and Taysha Gene Therapies. R.O.H. was a consultant for BlueRock Therapeutics and served on a scientific advisory board for Takeda. The remaining authors declare that they have no competing interests.

Figures

Fig. 1.
Fig. 1.. Mouse models of NCL display slow bowel transit and abnormal contractility.
(A) cln1 disease (Ppt1−/−) or cln2 disease (Tpp1R207X/R207X) mice display distention of the small intestine (arrows) and cecum (*) by fecal material at disease end stage, with hardened fecal pellets in colon (arrowheads). (B to D) Total bowel transit was assessed by measuring the time for gavaged carmine red to appear in stool (n = 12 mice per group) (B) or determining the amount of FiTc-conjugated dextrans present in individual bowel segments 2 hours after gavage (n = 16 mice per group) (c) or expressed as weighted geometric mean fluorescence (the same n = 16 mice per group) (d) (Si1 to Si10, numbered segments of small intestine; cec P, proximal cecum; cec d, distal cecum; col1 to col3, numbered segments of colon). (E) Time taken to expel a glass bead from the colon was measured at disease end stage (n = up to 12 mice per group). (F) Graphs of low-frequency contractions per 20 min in small bowel or colon based on the analysis of kymographs generated from videos of bowel in an oxygenated organ bath (n = 12 mice per group) (representative kymographs presented in fig. S1). Unpaired t test [(B), (d) to (F)]. *P ≤ 0.05, **P ≤ 0.01, and ****P ≤ 0.0001. ns, not significant.
Fig. 2.
Fig. 2.. Pathological changes in enteric neurons in Ppt1−/− and Tpp1R207X/R207X mice.
(A) Whole-mount bowel preparations immunostained for pan-neuronal marker HuC/D (red) reveal the altered distribution and morphology of myenteric plexus neurons in the duodena, ilea, and colons of disease end-stage Ppt1−/− mice versus age-matched WT controls at 7 months. Scale bar, 200 μm and (inserts) 50 μm. (B) The density of HuC/D+ neurons was measured in these mice at end stage (n = up to 11 mice per group). (C) Whole-mount bowel preparations immunostained for pan-neuronal marker HuC/D (red) reveal the altered distribution and morphology of myenteric plexus neurons in the duodena, ilea, and colons of disease end-stage Tpp1R207X/R207X mice versus age-matched WT controls at 3.5 months. Scale bar, 200 μm and (inserts) 50 μm. (D) The density of HuC/D+ neurons was measured in the bowels of these mice at disease end stage (n = up to 11 mice per group). Unpaired t test [(B) and (D)], ***P ≤ 0.001 and ****P ≤ 0.0001.
Fig. 3.
Fig. 3.. Loss of enteric glia in Ppt1−/− and Tpp1R207X/R207X mice.
(A) Whole-mount bowel preparations immunostained for HuC/D (neurons, red) and the enteric glial marker S100B (green) in the colons of Ppt1−/− mice and age-matched WT controls at 7 months. (Images from the duodena and ilea of Ppt1−/− mice are included in fig. S4). Green channel images reveal the altered distribution and morphology of S100B+ enteric glia, also shown in higher power inserts. Scale bar, 200 μm and (inserts) 50 μm. (B) The density of S100B+ enteric glia was measured in Ppt1−/− mice at end stage (n = up to 11 mice per group). (C) Whole-mount bowel preparations immunostained for HuC/D (neurons, red) and the enteric glial marker S100B (green) in the colons of Tpp1R207X/R207X mice and age-matched WT controls at 3.5 months. (Images from the duodena and ilea of Tpp1R207X/R207X mice are included in fig. S5). Green channel images reveal the altered distribution and morphology of S100B+ enteric glia, also shown in higher power inserts. (D) The density of S100B+ enteric glia was measured in Tpp1R207X/R207X mice at end stage (n = up to 11 mice per group). Scale bar, 200 μm and (inserts) 50 μm. Unpaired t test [(B) and (D)], *P ≤ 0.05 and **P ≤ 0.01.
Fig. 4.
Fig. 4.. Enteric nervous system pathology in a human colon from a child with CLN1 disease.
(A) Human colon from a healthy 5-year-old organ donor (left) and a colon from a 4-year 5-month-old child who died from CLN1 disease (right) were stained with antibodies to pan-neuronal protein HuC/D (magenta), cleared, and imaged by confocal microscopy from mucosa to serosa with a 10× objective. Large images show stitched confocal Z stacks of layers containing myenteric plexus. Scale bar, 1000 μm. Bottom, magnifications of the regions enclosed in boxes from large tiled images in the top row. Scale bar, 100 μm. (B) Colon from the same healthy organ donor and the same child with CLN1 disease was stained with antibodies to HuC/D (magenta) and TuJ1 (blue), cleared, and imaged by confocal microscopy from mucosa to serosa with a 10× objective. Images show AFSM (green), HuC/D, and TuJ1 signals in a single slice of the confocal Z stack in the region of the myenteric plexus. Scale bar, 100 μm. (C) Colon from the same healthy organ donor and the same child with CLN1 disease was stained with antibodies to HuC/D (magenta) and SOX10 (blue), cleared, and imaged by confocal microscopy from mucosa to serosa with a 10× objective. Images show AFSM, HuC/D, and SOX10 signals in a single slice from the confocal Z stack in the layer containing myenteric plexus. Scale bar, 100 μm.
Fig. 5.
Fig. 5.. Treatment effects of gene therapy on bowel transit and contractility in Ppt1−/− and Tpp1R207X/R207X mice.
(A to C) Total bowel transit was compared at 7 months in untreated Ppt1−/− mice, Ppt1−/− mice treated with AAV9-hPPT1 as neonates (P1) (also assessed at extended survival times, ES) or treated after weaning (P21), and age-matched WT controls (n = up to 23 mice per group). This was done by measuring the time for gavaged carmine red to appear in stool (A) and determining the amount of FITC-conjugated dextrans present in individual bowel segments 2 hours after gavage (B) and is expressed as weighted geometric mean FITC fluorescence (n = up to 16 mice per group) (C). (D and E) Bowel contractility kymographs were recorded in the small intestines and colons of mice from all treatment groups in an oxygenated organ bath, and the number of LFCs (D) (white arrowheads on kymographs) or colon migrating motor complexes (CMMCs) (E) in 20 min was calculated (n = up to 23 mice per group). (F to H) Total bowel transit was compared at 3.5 months in untreated Tpp1R207X/R207X mice, Tpp1R207X/R207X mice treated with AAV9-hTPP1 as neonates (P1) (also assessed at ES times) or treated after weaning (P21), and age-matched WT controls. This was done by measuring the time for gavaged carmine red to appear in stool (n = up to 12 mice per group) (F) and by determining the amount of FITC-conjugated dextrans present in individual bowel segments 2 hours after gavage (n = up to 16 mice per group) (G). (H) Histograms displaying weighted geometric mean FITC fluorescence revealed no difference between mice of any genotype at 3.5 months. One-way ANOVA with a post hoc Bonferroni correction [(A), (C), (F), and (H)]; *P ≤ 0.05, **P ≤ 0.01, and ****P ≤ 0.0001.
Fig. 6.
Fig. 6.. Treatment effects of gene therapy on histopathology in the bowels of Ppt1−/− and Tpp1R207X/R207X mice.
(A) Representative photomicrographs of whole-mount bowel preparations (duodenum, ileum, and colon) immunostained for the pan-neuronal marker HuC/D (red) in disease end-stage Ppt1−/− mice treated at P1 or P21 versus untreated Ppt1−/− mice versus WT controls at 7 months. Scale bar, 200 μm. (B) Counts of HuC/D-positive neurons in all bowel regions and for all groups as in (A) and in mice treated at P1 and assessed at extended survival times (AAV P1 ES) (n = up to 13 mice per group). One-way ANOVA with a post hoc Bonferroni correction [(A), (C), and (F)]; *P ≤ 0.05, ***P ≤ 0.001, and ****P ≤ 0.0001. (C) Representative photomicrographs of whole-mount bowel preparations immunostained for the pan-neuronal marker HuC/D (red) in disease end-stage Tpp1R207X/R207X mice treated at P1 or P21 versus untreated Tpp1R207X/R207X mice versus WT at 3.5 months. Scale bar, 200 μm. (D) Density of HuC/D-positive neurons in all bowel regions and for all groups as in (C) and in mice treated at P1 and assessed at ES times (AAV P1 ES) (n = up to 6 mice per group). One-way ANOVA with a post hoc Bonferroni correction [(A), (C), and (E)]; *P ≤ 0.05, **P ≤ 0.01, ***P ≤ 0.001, and ****P ≤ 0.0001.
Fig. 7.
Fig. 7.. AAV9-mediated gene therapy transduces enteric neurons in Ppt1−/− and Tpp1R207X/R207X mice.
(A) Immunostained bowel whole-mount preparations, livers, and brains from Ppt1−/− mice treated on P1 or P21 reveal the expression of hPPT1 (green) in these tissues. In bowel whole mounts, hPPT1 (green) was expressed in a subset of HuC/D-positive (red) myenteric neurons (arrows). This example is from the ileum, but similar findings were apparent in the duodenum and colon. Scale bar, 40 μm. (B) PPT1 enzyme activity in tissue homogenates (brain, liver, and bowel; in nanomole per hour per milligram) or serum (nanomole per hour per milliliter) collected from mice euthanized at normal disease end stage after treatment with AAV9-hPPT1 on either P1 or P21, compared with WT and untreated Ppt1−/− mice (n = up to 5 mice per group). One-way ANOVA with a post hoc Bonferroni correction; **P ≤ 0.01, ***P ≤ 0.001, and ****P ≤ 0.0001. (C) Immunostained bowel whole-mount preparations, livers, and brains from Tpp1R207X/R207X mice treated with AAV9-hTPP1 reveal the expression of hTPP1 (green) in these tissues. In bowel whole mounts, hTPP1 (green) was expressed in a subset of HuC/D-positive (red) myenteric neurons (arrows). This example is from the ileum, but similar findings were apparent in the duodenum and colon. Scale bar, 40 μm. (D) TPP1 enzyme activity from tissue homogenates (brain, liver, and bowel; in nanomole per hour per milligram) or serum (in nanomole per hour per milliliter) collected from mice euthanized at normal disease end stage after treatment with AAV9-hTPP1 on either P1 or P21, compared with WT and untreated Tpp1R207X/R207X mice (n = up to 5 mice per group). One-way ANOVA with a post hoc Bonferroni correction; *P ≤ 0.05, **P ≤ 0.01, ***P ≤ 0.001, and ****P ≤ 0.0001.
Fig. 8.
Fig. 8.. AAV9-mediated gene therapy extends the survival of Ppt1−/− and Tpp1R207X/R207X mice.
(A) Kaplan-Meier survival curve for Ppt1−/− mice treated intravenously with AAV9-hPPT1 on either P1 (P < 0.0001) or P21 (P = 0.0002) (n = up to 23 mice per group). P values from log-rank (Mantel-Cox) test comparisons with untreated Ppt1−/− mice. (B) Kaplan-Meier survival curve for Tpp1R207X/R207X mice treated intravenously with AAV9-hTPP1 at P1 (P = 0.001) but not in mice treated at P21 (P = 0.9765) (n = up to 23 mice per group). P values from log-rank (Mantel-Cox) test comparisons with untreated Tpp1R207X/R207X mice.

References

    1. Bhardwaj J, Wan DQ, Koenig MK, Liu Y, Hashmi SS, Rhoads JM, Impaired gastric emptying and small bowel transit in children with mitochondrial disorders. J. Pediatr. Gastroenterol. Nutr. 55, 194–199 (2012). - PubMed
    1. Dinari G, Rosenbach Y, Grunebaum M, Zahavi I, Alpert G, Nitzan M, Gastrointestinal manifestations of Niemann-Pick disease. Enzyme 25, 407–412 (1980). - PubMed
    1. Fagerberg CR, Taylor A, Distelmaier F, Schrøder HD, Kibæk M, Wieczorek D, Tarnopolsky M, Brady L, Larsen MJ, Jamra RA, Seibt A, Hejbøl EK, Gade E, Markovic L, Klee D, Nagy P, Rouse N, Agarwal P, Dolinsky VW, Bakovic M, Choline transporter-like 1 deficiency causes a new type of childhood-onset neurodegeneration. Brain 143, 94–111 (2020). - PubMed
    1. Finsterer J, Leigh and leigh-like syndrome in children and adults. Pediatr. Neurol. 39, 223–235 (2008). - PubMed
    1. Thapar N, Saliakellis E, Benninga MA, Borrelli O, Curry J, Faure C, De Giorgio R, Gupte G, Knowles CH, Staiano A, Vandenplas Y, Di Lorenzo C, Paediatric intestinal pseudo-obstruction: Evidence and consensus-based recommendations from an ESPGHAN-led expert group. J. Pediatr. Gastroenterol. Nutr. 66, 991–1019 (2018). - PubMed

MeSH terms

Substances