. 2025 Jan 17;11(3):eadp8494.
doi: 10.1126/sciadv.adp8494. Epub 2025 Jan 15.

Opioidergic activation of the descending pain inhibitory system underlies placebo analgesia

Affiliations

Opioidergic activation of the descending pain inhibitory system underlies placebo analgesia

Hiroyuki Neyama et al. Sci Adv. .

Abstract

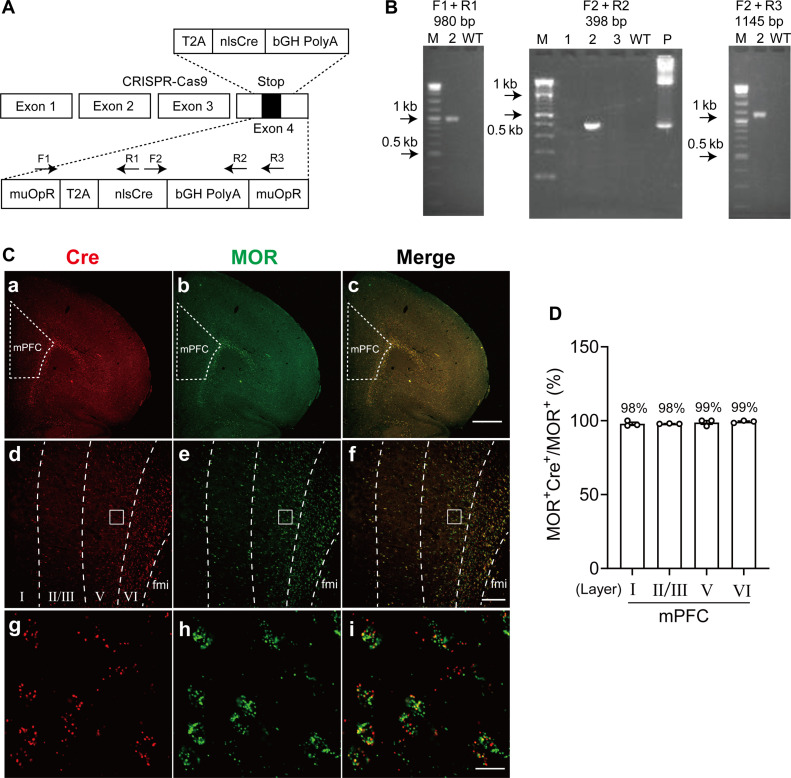
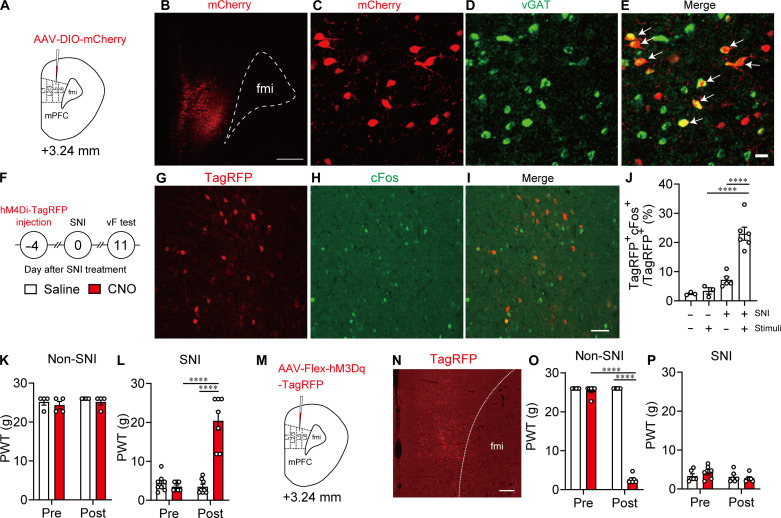
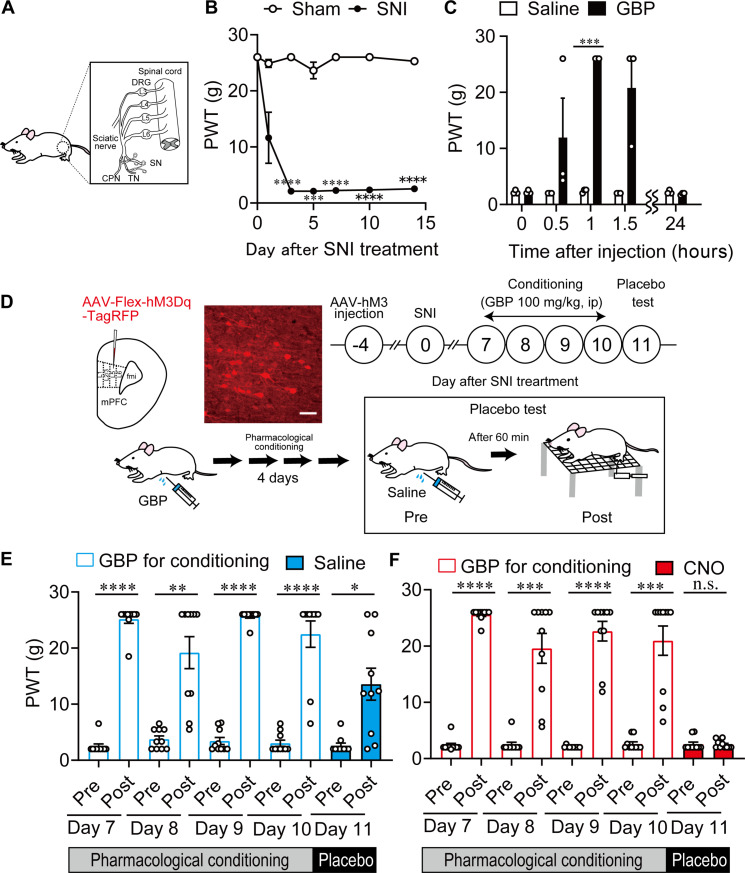
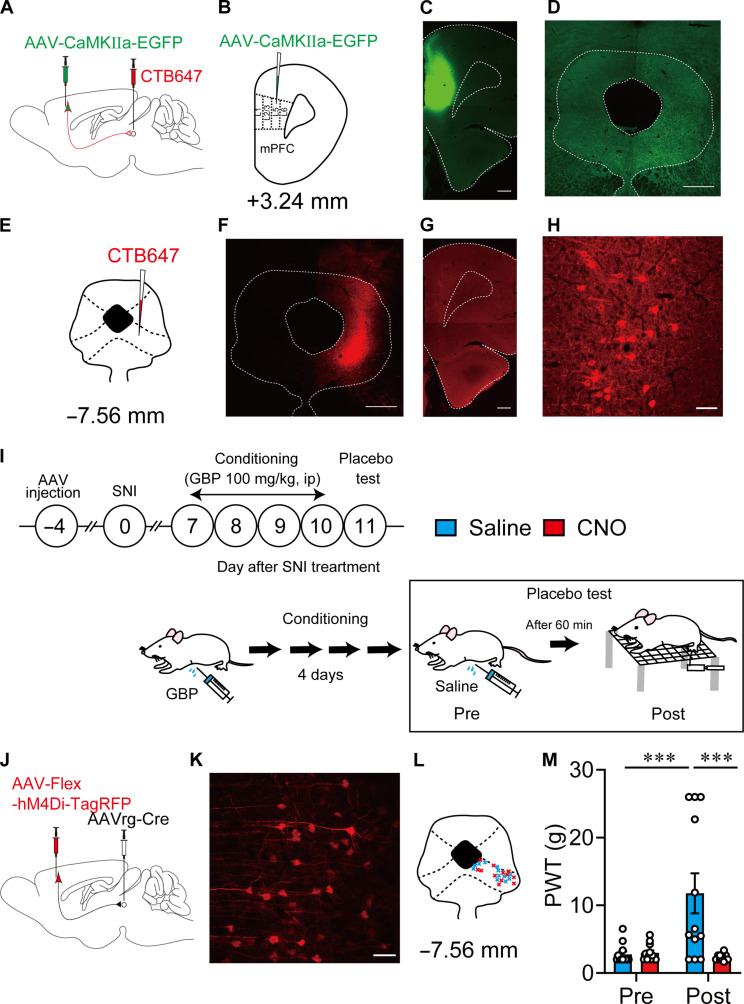
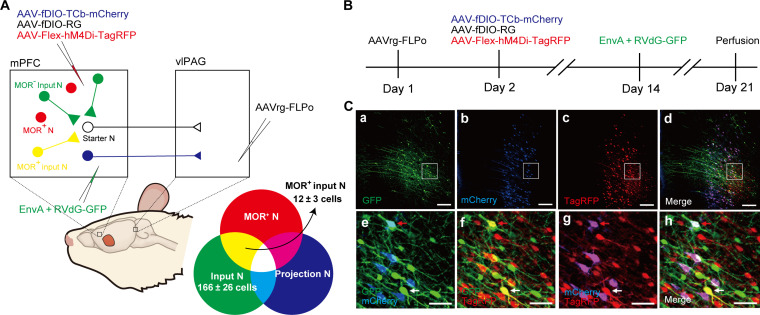
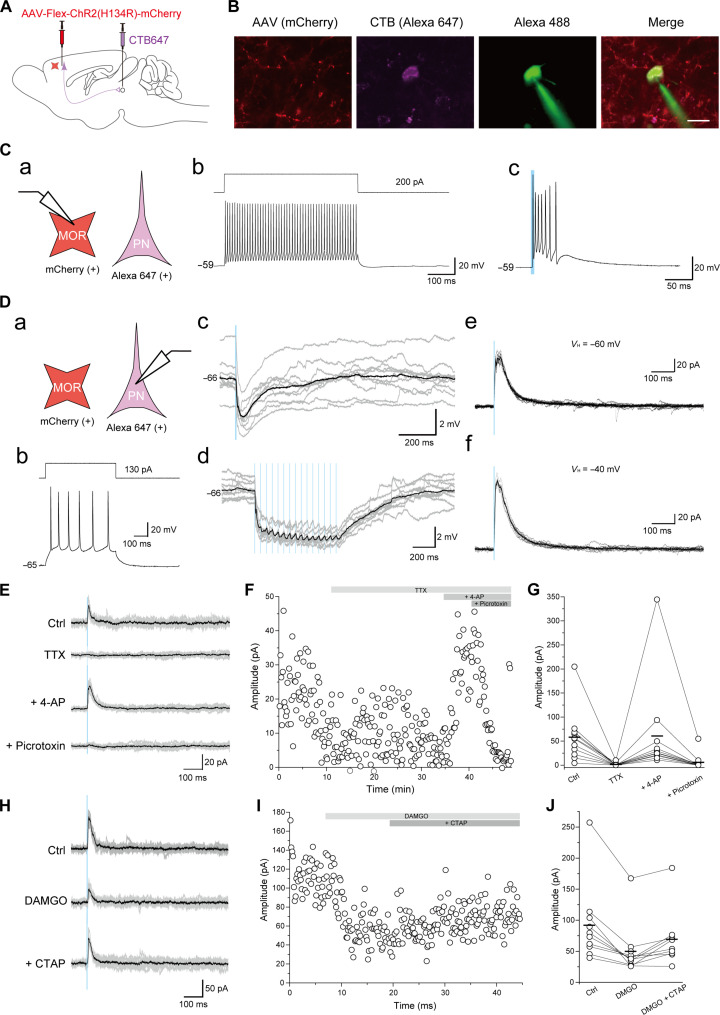
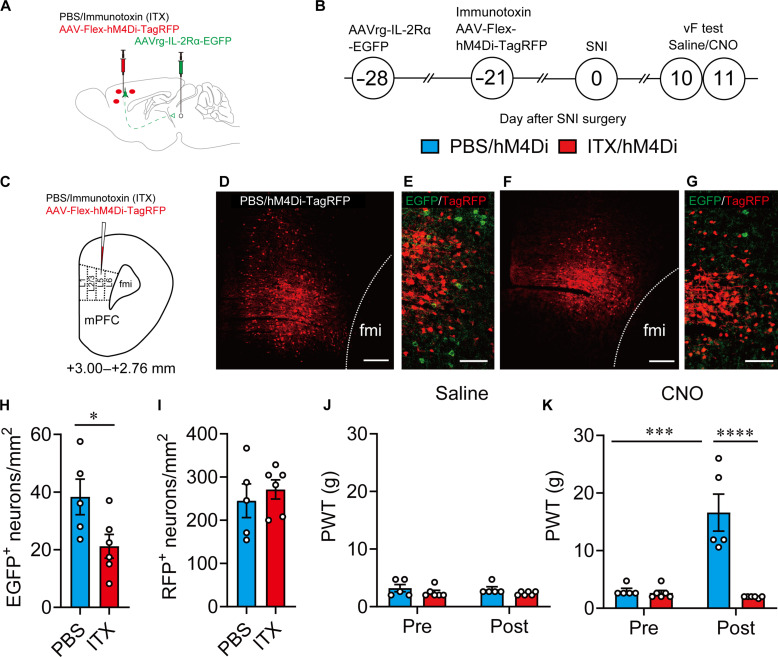
Placebo analgesia is caused by inactive treatment, implicating endogenous brain function involvement. However, the neurobiological basis remains unclear. In this study, we found that μ-opioid signals in the medial prefrontal cortex (mPFC) activate the descending pain inhibitory system to initiate placebo analgesia in neuropathic pain rats. Chemogenetic manipulation demonstrated that specific activation of μ-opioid receptor-positive (MOR+) neurons in the mPFC or suppression of the mPFC-ventrolateral periaqueductal gray (vlPAG) circuit inhibited placebo analgesia in rats. MOR+ neurons in the mPFC are monosynaptically connected and directly inhibit layer V pyramidal neurons that project to the vlPAG via GABAA receptors. Thus, intrinsic opioid signaling in the mPFC disinhibits excitatory outflow to the vlPAG by suppressing MOR+ neurons, leading to descending pain inhibitory system activation that initiates placebo analgesia. Our results shed light on the fundamental neurobiological mechanism of the placebo effect that maximizes therapeutic efficacy and reduces adverse drug effects in medical practice.


Figures

Fig. 1.
Fig. 1.. MOR+ neurons in the mPFC modulate placebo analgesia.
(A) Targeting strategy for inserting nlsCre. (B) Gel images for genotyping of MOR-Cre KI rat. M, marker; P, positive control. (C) RNAscope fluorescent images of MOR and Cre coexpression in the mPFC. (a to c) Low magnification images for (a) Cre, (b) MOR, and (c) coexpression. (d to f) Images showing separative lines for cortical layers in mPFC. (g to i) High-magnification images for Cre (g), MOR (h), and coexpression (i). fmi, forceps minor of the corpus callosum. (D) Percentage of coexpression with MOR+ and Cre-positive cells in each cortical layer. Scale bars, 1000 μm (c), 200 μm (f), and 20 μm (i). WT, wild type.
Fig. 2.
Fig. 2.. MOR+ neurons in the mPFC modulate nerve injury–induced pain.
(A) Schematic diagram for AAV injection. (B) Representative coronal image showing MOR+ neurons in the mPFC labeled with mCherry (red). Scale bar, 500 μm. (C to E) Combined fluorescent immunostaining and fluorescent ISH images showing vGAT [green, (D)] expression in MOR+ neurons [mCherry, red, (C)] in the mPFC. White arrows in (E) indicate coexpression of vGAT in the MOR+ neurons. Scale bar, 20 μm. (F) Schematic diagram of chemogenetic manipulation of MOR+ neurons in the mPFC of MOR-Cre KI rat. (G to I) Double immunostaining images showing cFos [green, (H)] expressed in MOR+ neurons [TagRFP, red, (G)] in the mPFC. Scale bar, 50 μm. (J) Percentage of cFos+ neurons among MOR+ neurons. (K) Changes in paw withdrawal threshold (PWT) after saline and clozapine N-oxide (CNO) injection in non–spared nerve injury (SNI) rats microinjected with AAV-Flex hM4Di-TagRFP. (L) Changes in PWT after injection of saline and CNO in SNI rats microinjected with AAV-Flex-hM4Di-TagRFP. (M) Experimental procedure. (N) Immunostaining image of MOR+ neurons (TagRFP, red). Scale bar, 200 μm. (O) Changes in PWT after saline and CNO injection in non-SNI rats microinjected with AAV-Flex-hM3Dq-TagRFP. (P) Changes in PWT after saline and CNO injection in non-SNI rats microinjected with AAV-Flex-hM3Dq-TagRFP. ****P < 0.0001. All statistical information is presented in table S2.
Fig. 3.
Fig. 3.. MOR+ neurons in mPFC modulate placebo analgesia.
(A) Configuration of SNI. TN, tibial nerve; SN, sural nerve; CPN, common peroneal nerve; DRG, dorsal root ganglion. (B) Long-lasting pain hypersensitivity in SNI treatment. (C) Time-dependent changes in antihypersensitivity effect of GBP hydrochloride (100 mg/kg, intraperitoneal) injection. (D) Schematic diagram of designer receptors exclusively activated by designer drug (DREADD) experiment for placebo analgesia. Scale bar, 50 μm. (E) Changes in PWT after GBP injection for conditioning and saline injection for placebo test in SNI rats microinjected with AAV-Flex-hM3Dq-TagRFP. (F) Changes in PWT after GBP injection for conditioning and CNO injection for placebo test in SNI rats microinjected with AAV-Flex-hM3Dq-TagRFP. *P < 0.05, **P < 0.01, ***P < 0.001, and ****P < 0.0001. All statistical information is presented in table S2. n.s., not significant.
Fig. 4.
Fig. 4.. mPFC-vlPAG circuit modulates placebo analgesia.
(A and B) Schematic diagram for anterograde (AAV-CaMKIIα-EGFP) and retrograde (CTB647) labeling of the mPFC-vlPAG circuit in wild-type rats. (C and D) Images show AAV injection side in the mPFC and the projection fiber in the vlPAG that was anterogradely labeled. Scale bars, 500 μm. (E to H) Retrograde somatic labeling of layer V pyramidal neurons in the mPFC, in which CTB647 was injected into the vlPAG. Scale bars, 500 μm (F), 500 μm (G), and 50 μm (H). (I) Experimental procedures for pharmacological conditioning-induced placebo analgesia and chemogenetic manipulation. (J) Schematic diagram for chemogenetic manipulation of mPFC-vlPAG circuit using AAV-Flex-hM4Di-TagRFP. (K) High-magnification image shows the expression of AAV-Flex-hM4Di-TagRFP in layer V pyramidal neurons that project into the vlPAG (blue, 4′,6-diamidino-2-phenylindole; red, TagRFP). Scale bar, 50 μm. (L) Retrograde AAV (AAVrg) injection points in the vlPAG. (M) Changes in PWT after saline and CNO injection for evaluating placebo analgesia. ***P < 0.001. All statistical information is presented in table S2.
Fig. 5.
Fig. 5.. Monosynaptic connection between MOR+ neurons and mPFC-vlPAG circuit.
(A) Schematic diagram for rabies virus–based retrograde trans-synaptic tracing. (B) Timeline of virus injection for rabies virus–based retrograde trans-synaptic tracing. (C) Representative fluorescent images show rabies virus–based retrograde trans-synaptic tracing. (Ca to Ch) mPFC coronal sections show starter neurons labeled in white [expressing GFP (green), mCherry (blue), and TagRFP (red)]; input neurons in green (expressing GFP); projection neurons in magenta, merged by mCherry (blue) and TagRFP (red); and MOR+ neurons in red (TagRFP). (Ce to Ch) Higher-magnification images of (Ca) to (Cd). Note that neurons labeled in yellow [merged by GFP (green) and TagRFP (red)] in the images (Cd) and (Cf) indicate MOR+ neurons monosynaptically connected with neurons that project into the vlPAG. Scale bars, 200 μm (Ca to Cd) and 50 μm (Ce to Ch).
Fig. 6.
Fig. 6.. MOR+ neurons predominantly inhibit the excitatory outflow of the mPFC to the vlPAG.
(A) Schematic diagram for optogenetic manipulation of MOR+ neurons and labeling layer V pyramidal neuron in the mPFC that projects into the vlPAG. (B) Images show representative MOR+ neurons (red), layer V pyramidal neuron (magenta, CTB647), and representative recording neurons (green, Alexa 488 contained in internal electrode solution). Scale bar, 20 μm. (C) Whole-cell patch-clamp recording from MOR+ neurons. (a) Schematic diagram. PN, pyramidal neurons. (b) Representative firing responses induced by current injection. (c) Representative firing responses induced by photostimulation. (D) Whole-cell patch-clamp recording from CTB647+ layer V pyramidal neuron that projects into the vlPAG. (a) Schematic diagram. (b) Representative firing responses induced by current injection. (c to d) Current-clamp recording shows photostimulation-induced IPSP. (e to f) Voltage-clamp recording shows photostimulation-induced IPSC. (E to G) Voltage-clamp recording of IPSC from CTB647+ layer V pyramidal neuron without (Ctrl) and with tetrodotoxin (TTX); TTX and 4-AP; or TTX, 4-AP, and picrotoxin. (H to J) Voltage-clamp recording of IPSC from CTB647+ pyramidal neuron without (Ctrl) and with DAMGO or DAMGO and CTAP.
Fig. 7.
Fig. 7.. mPFC-vlPAG circuit is essential for MOR+ neuron–mediated pain modulation.
(A to C) Schematic diagram for specific ablation of mPFC-vlPAG circuit using an ITX-mediated elimination method and the timeline for chemogenetic manipulation and behavior test. (D and F) Images show TagRFP expression in the mPFC in PBS- and ITX-treated rats. Scale bars, 200 μm. (E and G) High-magnification images showing TagRFP+ and GFP+ neurons. Scale bars, 100 μm. (H) The number of GFP+ neurons in PBS- and ITX-treated groups. (I) The number of TagRFP+ neurons in PBS- and ITX-treated groups. (J and K) Changes in PWT after saline (J) or CNO (K) injection in MOR Cre KI rat with PBS/hM4Di (light blue column) or ITX/hM4Di (red column). *P < 0.05, ***P < 0.001, and ****P < 0.0001. All statistical information is presented in table S2.

References

    1. Colloca L., The placebo effect in pain therapies. Annu. Rev. Pharmacol. Toxicol. 59, 191–211 (2019). - PMC - PubMed
    1. Levine J. D., Gordon N. C., Fields H. L., The mechanism of placebo analgesia. Lancet 2, 654–657 (1978). - PubMed
    1. Petrovic P., Kalso E., Petersson K. M., Ingvar M., Placebo and opioid analgesia—Imaging a shared neuronal network. Science 295, 1737–1740 (2002). - PubMed
    1. Wager T. D., Atlas L. Y., The neuroscience of placebo effects: Connecting context, learning and health. Nat. Rev. Neurosci. 16, 403–418 (2015). - PMC - PubMed
    1. Eippert F., Bingel U., Schoell E. D., Yacubian J., Klinger R., Lorenz J., Buchel C., Activation of the opioidergic descending pain control system underlies placebo analgesia. Neuron 63, 533–543 (2009). - PubMed

LinkOut - more resources