. 2025 Jan 17;11(3):eadn2811.
doi: 10.1126/sciadv.adn2811. Epub 2025 Jan 15.

SMARCA4 regulates the NK-mediated killing of senescent cells

Affiliations

SMARCA4 regulates the NK-mediated killing of senescent cells

Virinder Reen et al. Sci Adv. .

Abstract

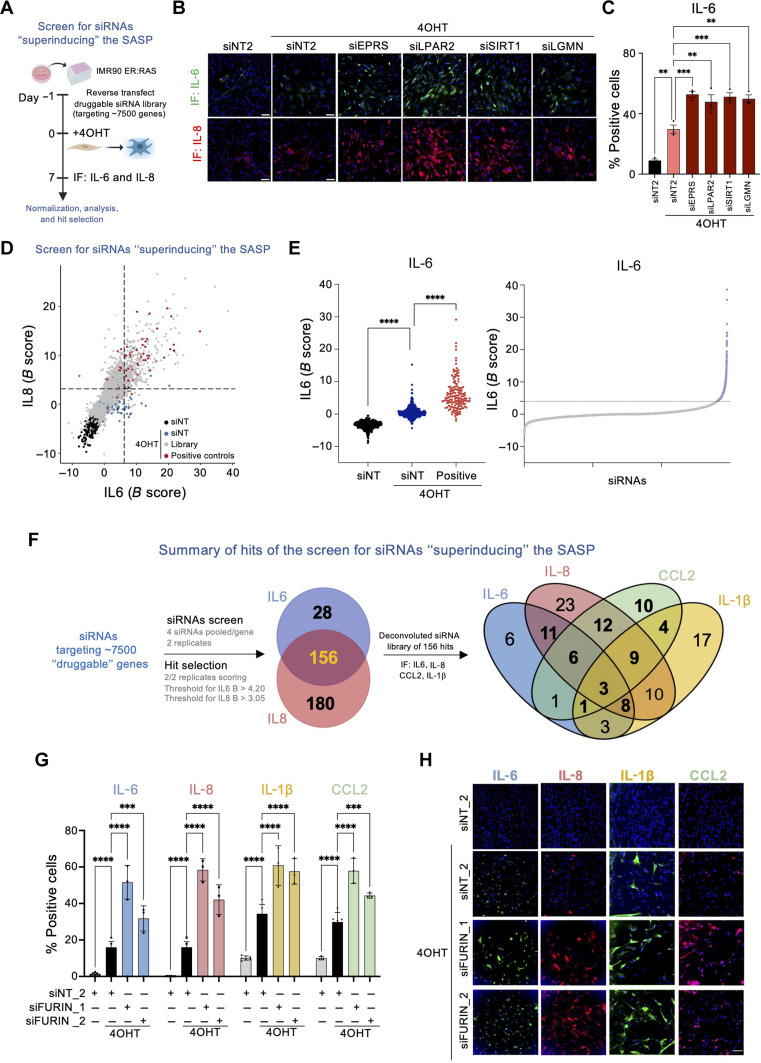
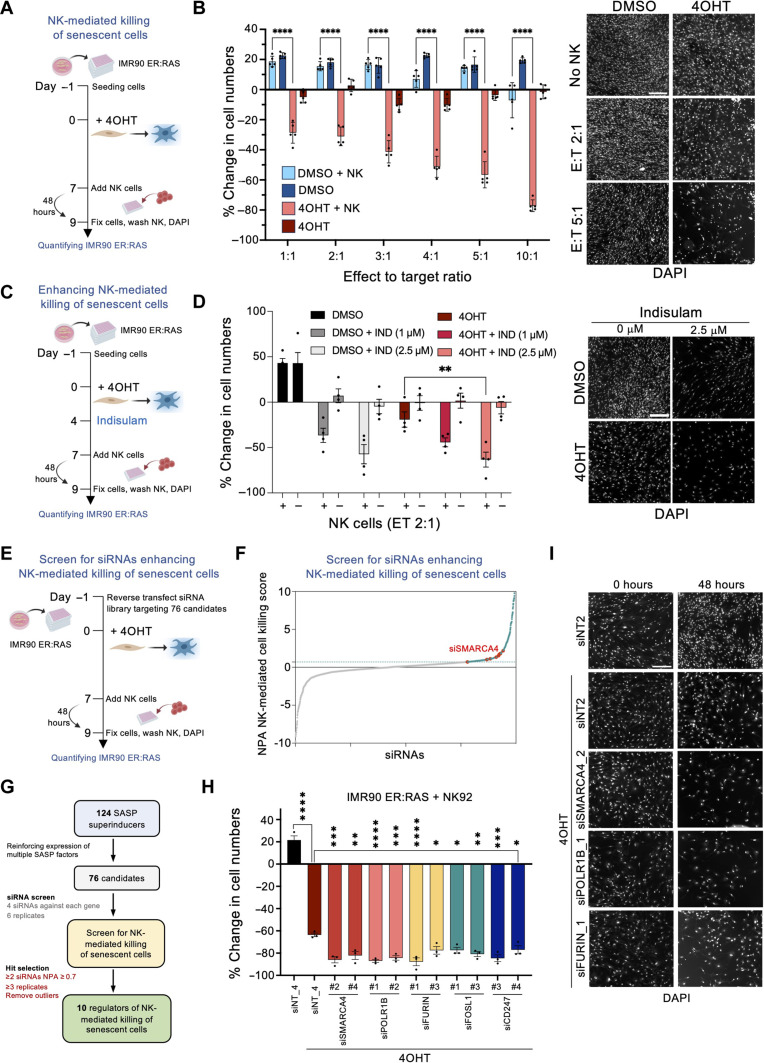
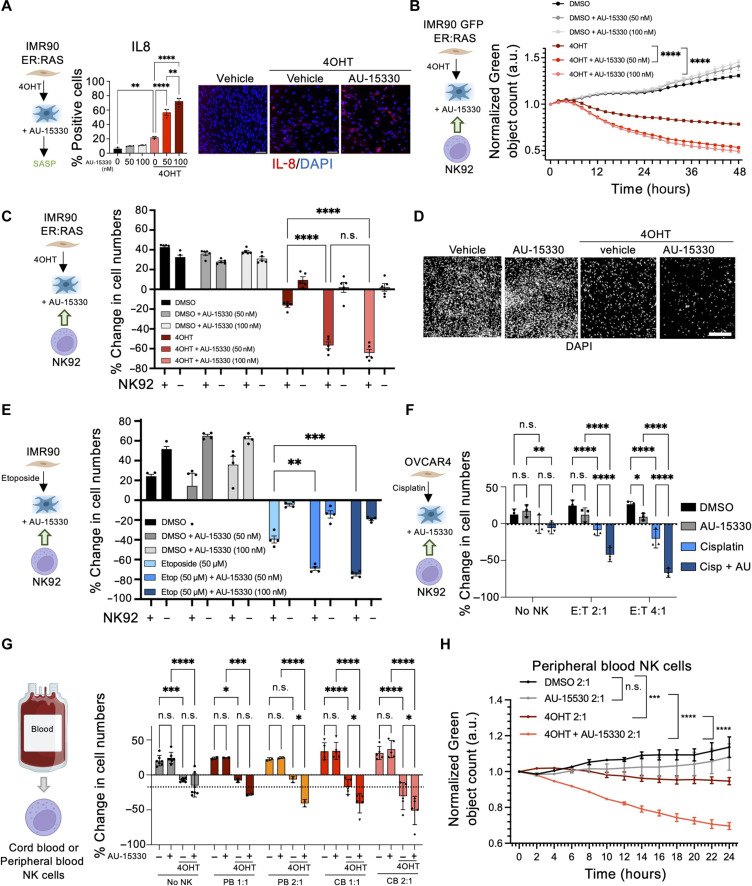
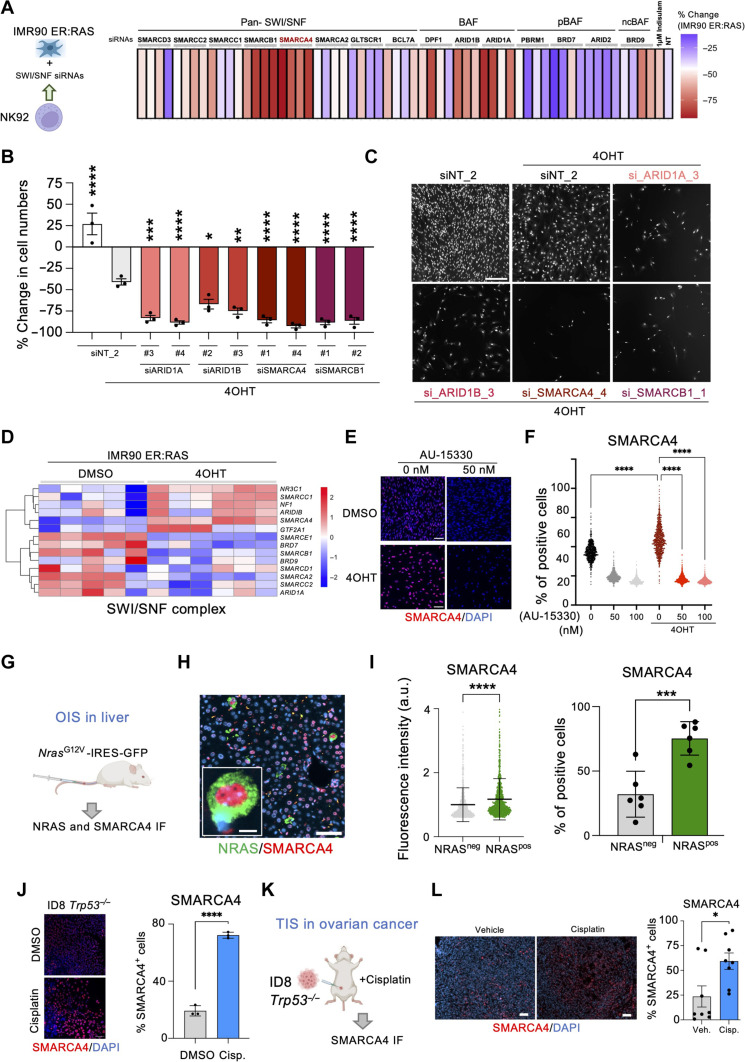
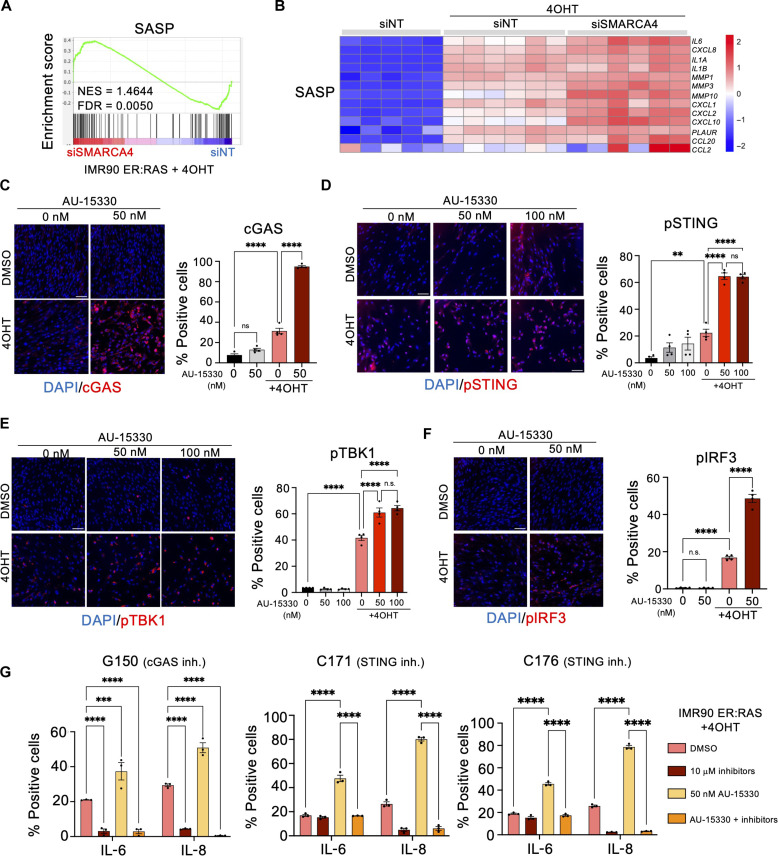
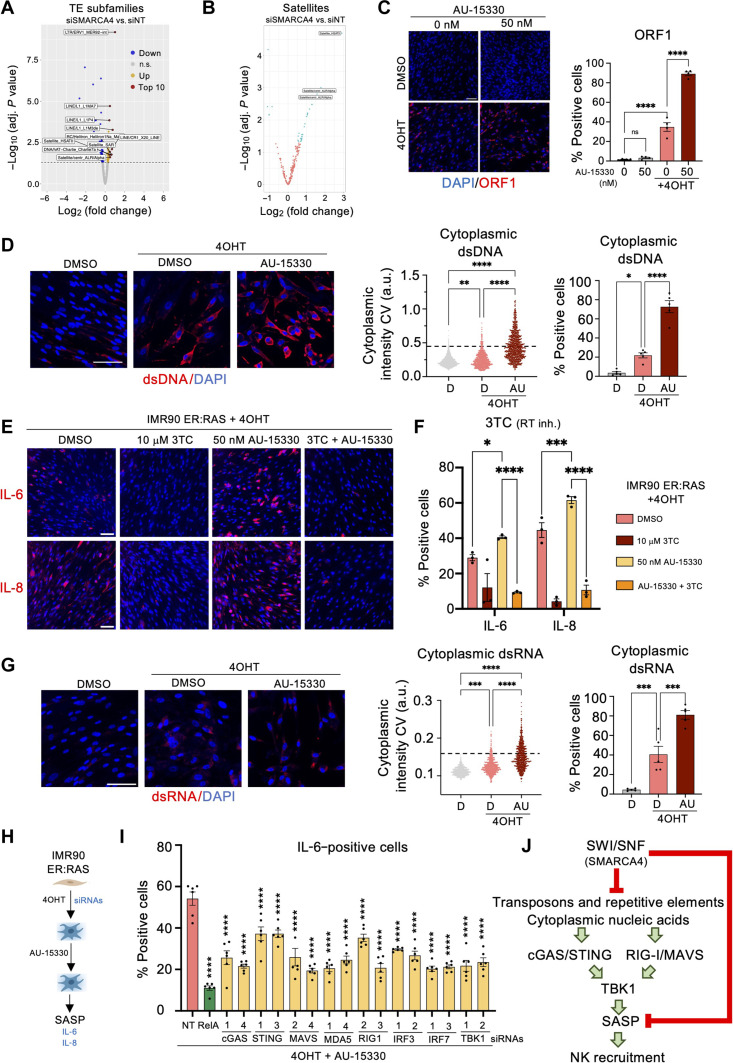
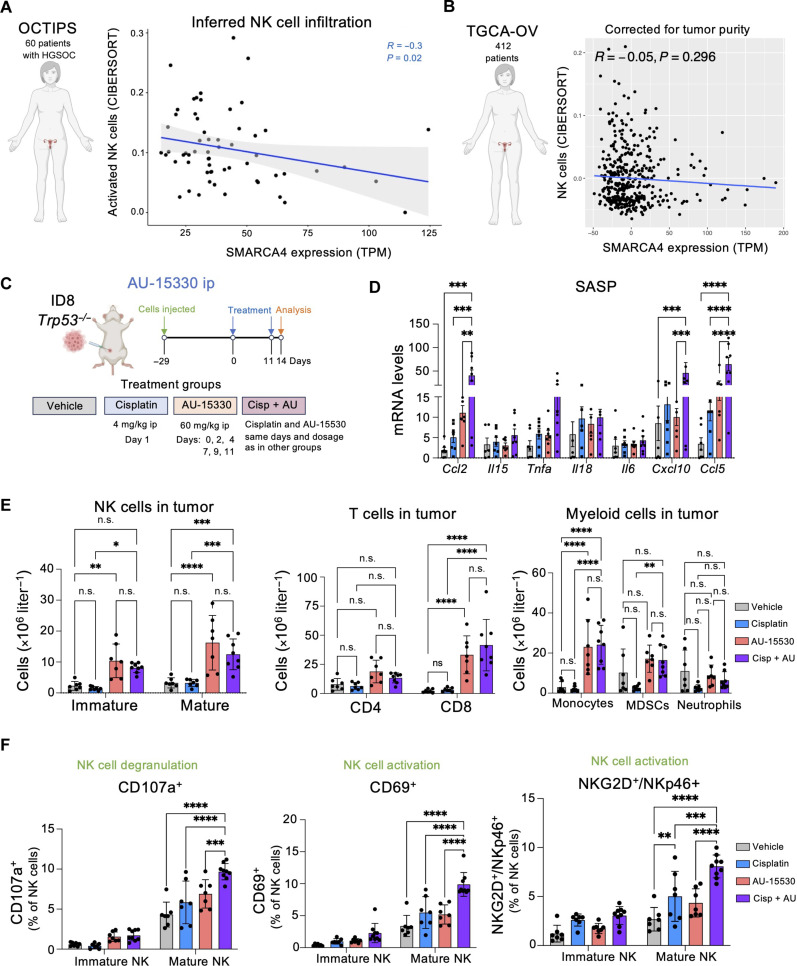
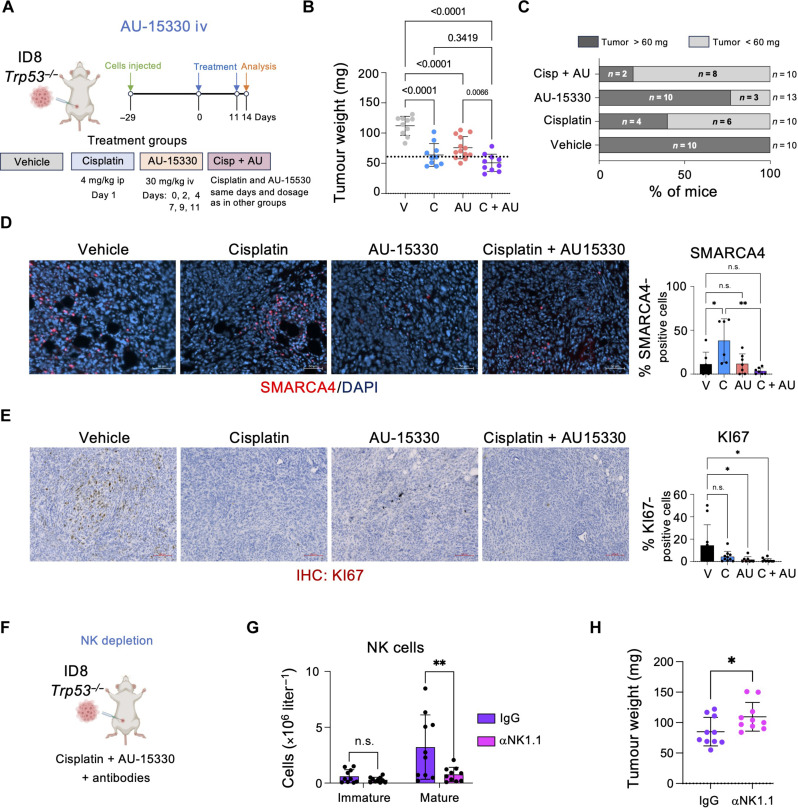
Induction of senescence by chemotherapeutic agents arrests cancer cells and activates immune surveillance responses to contribute to therapy outcomes. In this investigation, we searched for ways to enhance the NK-mediated elimination of senescent cells. We used a staggered screen approach, first identifying siRNAs potentiating the secretion of immunomodulatory cytokines to later test for their ability to enhance NK-mediated killing of senescent cells. We identified that genetic or pharmacological inhibition of SMARCA4 enhanced senescent cell elimination by NK cells. SMARCA4 expression is elevated during senescence and its inhibition derepresses repetitive elements, inducing the SASP via activation of cGAS/STING and MAVS/MDA5 pathways. Moreover, a PROTAC targeting SMARCA4 synergized with cisplatin to increase the infiltration of CD8 T cells and mature, activated NK cells in an immunocompetent model of ovarian cancer. Our results indicate that SMARCA4 inhibitors enhance NK-mediated surveillance of senescent cells and may represent senotherapeutic interventions for ovarian cancer.


Figures

Fig. 1.
Fig. 1.. siRNA screens to identify superinducers of the SASP.
(A) Schematic of the screen. (B) Representative images for IL-6 and IL-8 immunofluorescence (IF) of IMR90 ER:RAS cells transfected with the indicated siRNAs. Scale bars, 100 μm. (C) Percentage of IMR90 ER:RAS cells positive for IL-6 expression beyond a predetermined threshold following transfection with the indicated siRNAs. Data represent means ± SD (n = 3). **P < 0.01 and ***P < 0.001; ordinary one-way analysis of variance (ANOVA; Dunnett’s multiple comparisons test). (D) Results of the pooled siRNA screen for SASP superinducers. Normalized B-score values of IL-6 versus IL-8 for each replicate sample siRNA are shown. The dashed lines represent the thresholds (+2 SD of the mean of the negative non-targeting siRNA controls). Hits were selected if siRNA pools showed a normalized B-score value for both IL-6 and IL-8 beyond the specified threshold in both replicates. (E) Screen for IL-6 superinducers. Normalized score for the control siRNAs (left) and samples (right). Dotted line denotes threshold. ****P < 0.0001; ordinary one-way ANOVA (Tukey’s multiple comparisons test). (F) Summary of the SASP superinducer siRNA screens. The Venn diagram of the secondary screen shows the distribution of 124 hits across the indicated SASP readouts. (G) Percentage of IMR90 ER:RAS cells positive for the indicated SASP components 7 days after siRNA transfection. Two distinct siRNAs targeting FURIN are shown as well as the non-targeting control. Data represent means ± SD (n = 3). ***P < 0.001 and ****P < 0.0001; two-way ANOVA (Tukey’s multiple comparisons test). (H) Representative IF images of the indicated SASP components following transfection of siRNAs targeting FURIN. Scale bar, 100 μm. The results of the primary SASP siRNA screen [shown in (D) and (E)] are presented in table S1. The results of the secondary SASP siRNA screen [summarized in (F)] are presented in table S2.
Fig. 2.
Fig. 2.. A screen for siRNAs potentiating NK-mediated killing of senescent cells.
(A) Schematic of the coculture of IMR90 ER:RAS and NK92-MI (NK) cells. (B) Quantification and representative images of NK-mediated killing of IMR90 ER:RAS cells, measured as the percentage change in cell count after 48-hour coculture using 4′,6-diamidino-2-phenylindole (DAPI) staining. Control wells contained dimethyl sulfoxide (DMSO) or 4OHT-treated IMR90 ER:RAS cells only. Scale bar, 300 μm. Data represent means ± SEM (n = 5). ****P < 0.0001; two-way ANOVA (Tukey’s multiple comparisons test). (C) Schematic of the experiment testing the effect of indisulam on NK-mediated killing. (D) Quantification and representative images of NK coculture with control and senescent IMR90 ER:RAS cells [2:1 effector–to–target cell (E:T) ratio]. Scale bar, 300 μm. Data represent means ± SEM (n = 4). **P < 0.01; two-way ANOVA (Tukey’s multiple comparisons test). (E) Schematic of the siRNA screen to identify siRNAs potentiating NK-mediated killing of senescent cells. (F) Screen results showing normalized NPA scores for NK-mediated killing of senescent cells. The teal dotted line represents the cutoff (NPA ≥ 0.7). Hits were selected if at least two of the four siRNAs targeting a gene scored above the cutoff in at least three of the six replicates. siRNAs against SMARCA4 are highlighted. Screen results are presented in table S3. (G) Summary workflow of the screens for siRNAs potentiating NK-mediated killing of senescent cells. (H) Quantification of the percentage change in IMR90 ER:RAS cell counts in the indicated conditions. Data represent means ± SEM (n = 3). *P < 0.05, **P < 0.01, ***P < 0.001, and ****P < 0.0001; ordinary one-way ANOVA (Dunnett’s multiple comparisons test). (I) Representative images of IMR90 ER:RAS cells transfected with the indicated siRNAs and cocultured with NK cells (2:1 E:T ratio) for 48 hours. Scale bar, 300 μm.
Fig. 3.
Fig. 3.. The SMARCA4 PROTAC AU-15330 potentiates NK-mediated killing of senescent cells.
(A) Quantification and images of IL-8 expression in control and senescent IMR90 ER:RAS cells at day 7. AU-15330 was added on day 4. Scale bars, 300 μm. Data represent means ± SEM (n = 3). (B) Coculture of senescent AU-15330–treated IMR90 ER:RAS cells and NK cells at 2:1 E:T ratio. Cell numbers were measured using IncuCyte software and normalized to time 0. Data represent means ± SEM (n = 3). a.u., arbitrary units. (C) Quantification of percentage change in AU-15330–treated IMR90 ER:RAS cells cocultured with NK cells (2:1 E:T ratio). Data represent means ± SEM (n = 5). (D) Representative images of (C). Scale bar, 300 μm. (E) NK-mediated killing of etoposide-induced senescent AU-15330–treated IMR90 cells were cocultured with NK cells (2:1 E:T ratio). Data represent means ± SEM (n = 4). (F) NK-mediated killing of cisplatin-induced senescent AU-15330–treated OVCAR4 cells cocultured with NK cells at day 6. Data represent means ± SD (n = 3). (G) NK-mediated killing of senescent AU-15330–treated IMR90 ER:RAS cells cocultured with cord blood (CB)– or peripheral blood (PB)–derived NK cells. Data represent means ± SD. (H) Coculture of senescent AU-15330–treated IMR90 ER:RAS cells and peripheral blood–derived NK cells. Data represent means ± SEM. Ordinary one-way ANOVA (Tukey’s multiple comparisons test) was performed for (A), while two-way ANOVA (Tukey’s multiple comparisons test) was used in (B), (C), (E), (F), (G), and (H). n.s., not significant; *P < 0.05, **P < 0.01, ***P < 0.001, and ****P < 0.0001.
Fig. 4.
Fig. 4.. SMARCA4 induction in senescence renders SWI/SNF a target for NK cell–mediated killing.
(A) Heatmap representing average (of n = 3 replicates) NK-mediated killing of senescent IMR90 ER:RAS cells transfected with indicated siRNAs. (B) Percentage change in cell numbers of senescent IMR90 ER:RAS cells transfected with the indicated siRNAs following coculture with NK cells at a 2:1 E:T ratio. Data represent means ± SEM (n = 3). *P < 0.05, **P < 0.01, ***P < 0.001, and ****P < 0.0001; ordinary one-way ANOVA (Dunnett’s multiple comparisons test). (C) Representative images from (B). Scale bar, 300 μm. (D) Heatmap of RNA sequencing (RNA-seq) data showing a SWI/SNF signature. (E) IMR90 ER:RAS cells were treated with AU-15330 on day 4. Representative IF images at day 7. Scale bars, 100 μm. (F) Quantification of IMR90 ER:RAS cells positive for SMARCA4 from (E). Data represent means ± SEM (n = 3). ****P < 0.0001; ordinary one-way ANOVA (Tukey’s multiple comparisons test). (G) Model of OIS in the liver. (H) Representative IF images of SMARCA4 and NRAS in liver samples. (I) SMARCA4 fluorescence intensity in NRAS+ cells and NRAS cells (left). A representative experiment out of the six mice (n = 1000 cells). Data represent means ± SD. ****P < 0.0001; unpaired t test. Percentage of SMARCA4-positive cells in NRAS+ and NRAS cells (right). Data represent means ± SD (n = 6). ***P < 0.001; unpaired t test. (J) SMARCA4 IF staining and quantification in ID8 Trp53−/− cells treated with cisplatin (1 μM) or DMSO for 6 days. Scale bar, 100 μm. Data represent means ± SD (n = 3). ****P < 0.0001; unpaired t test. (K) Schematic of in vivo intraperitoneal injection of ID8 Trp53−/− cells and cisplatin treatment. (L) SMARCA4 IF staining and quantification in omental tumors. Scale bars, 50 μm. Data represent means ± SEM (n = 8 mice per group). *P < 0.05; unpaired t test.
Fig. 5.
Fig. 5.. SMARCA4 inhibition potentiates NK cell–mediated senescence surveillance via the cGAS-STING pathway.
(A) Gene set enrichment analysis (GSEA) plot of the SASP signature in 4OHT-induced IMR90 ER:RAS cells. NES, normalized enrichment score. (B) Heatmap of RNA-seq data showing up-regulation of SASP marker expression in senescent IMR90 ER:RAS cells transfected with siRNAs targeting SMARCA4. (C to F) Representative IF images (left) and quantification (right) of AU-15330–treated IMR90 ER:RAS cells positive for cGAS (C), pSTING (D), pTBK1 (E), and pIRF3 (F) staining. Scale bars, 100 μm. Data represent means ± SEM (n = 4). **P < 0.01 and ****P < 0.0001; ordinary one-way ANOVA (Tukey’s multiple comparisons test). (G) Quantification of the percentage of IL-6– and IL-8–positive 4OHT-induced IMR90 ER:RAS cells in the presence or absence of AU-15330 following treatment with the indicated inhibitors (inh.). Data represent means ± SEM (n = 3). ***P < 0.001 and ****P < 0.0001; two-way ANOVA (Dunnett’s multiple comparisons test).
Fig. 6.
Fig. 6.. Mechanism of SASP induction upon SMARCA4 inhibition.
(A) Volcano plot showing fold change of repetitive element subfamilies in siSMARCA4 versus siNT IMR90 ER:RAS + 4OHT cells. The dashed line indicates P adj. < 0.05. (B) Volcano plot showing fold change of satellite element loci in siSMARCA4 versus siNT IMR90 ER:RAS + 4OHT cells. Blue dots indicate significantly different (DESeq2, P adj. < 0.05, fold change > 1.5). (C) IF images and quantification of AU-15330–treated IMR90 ER:RAS cells positive for ORF1. Scale bar, 100 μm. Data represent means ± SEM (n = 4). (D) Representative IF images of cytoplasmic dsDNA staining (left), quantification of dsDNA intensity (center), and percentage of dsDNA-positive IMR90 ER:RAS cells (right) treated with and without AU-15330 as indicated. Data represent means ± SEM (n = 5). (E) IF images of IL-6 (top)– or IL-8 (bottom)–positive IMR90 ER:RAS cells treated with AU-15330 and lamivudine (3TC) as indicated. Scale bars, 100 μm. (F) Quantification of IL-6– or IL-8–positive cells from (E). Data represent means ± SEM (n = 3). (G) Representative IF images (left), quantification of dsRNA intensity (center), and percentage of dsRNA-positive IMR90 ER:RAS cells (right) treated with and without AU-15330 as indicated. Data represent means ± SEM (n = 5). (H) Schematic of siRNA experiment in AU-15330–treated IMR90 ER:RAS cells. (I) Quantification of IL-6–positive IMR90 ER:RAS cells. Data represent means ± SEM (n = 6). (J) Scheme showing SASP activation and the mechanism of NK cell recruitment following SMARCA4 inhibition in senescent cells. Ordinary one-way ANOVA (Tukey’s multiple comparisons test) was used for (C), ordinary one-way ANOVA (Dunnett’s multiple comparisons test) for (D) and (G), two-way ANOVA (Dunnett’s multiple comparisons test) for (F), and two-way ANOVA (Šídák’s multiple comparisons test) for (I). *P < 0.05, **P < 0.01, ***P < 0.001, and ****P < 0.0001.
Fig. 7.
Fig. 7.. SMARCA4 inhibition increases NK cell infiltration and activation.
(A) Sixty-six patients with HGSOC underwent primary debulking surgery, followed by RNA-seq of tumor samples derived from this cytoreduction. Six samples were excluded because of patients receiving neoadjuvant chemotherapy, resulting in a final cohort of 60 samples for downstream analysis. Spearman’s correlation between absolute NK cell infiltration as inferred by CIBERSORTx (51) and expression of SMARCA4 in transcript-per-million (TPM). R, Spearman r; P, P value. The linear regression line is in blue, with gray-shaded areas representing confidence intervals. (B) Spearman’s partial correlation between absolute NK cell infiltration as inferred by CIBERSORTx (51) and expression of SMARCA4 in TPM in the TCGA-OV cohort, accounting for tumor purity (n = 412). (C) Schematic of the in vivo intraperitoneal injection of ID8 Trp53−/− cells and treatment with cisplatin and AU-15330, alone or in combination. ip, intraperitoneal. (D) mRNA expression levels of markers for SASP in omental tumors measured by quantitative reverse transcription polymerase chain reaction (qRT-PCR). Data represent means ± SEM. **P < 0.01, ***P < 0.001, and ****P < 0.0001; two-way ANOVA (Tukey’s multiple comparisons test). (E) Flow cytometry analysis of NK, T, and myeloid cell counts in omental tumors. Data represent means ± SD. *P < 0.05, **P < 0.01, ***P < 0.001, and ****P < 0.0001; two-way ANOVA (Šídák’s multiple comparisons test). (F) Flow cytometry analysis of NK cell degranulation and activation in omental tumors. Data represent means ± SD. **P < 0.01, ***P < 0.001, and ****P < 0.0001; two-way ANOVA (Tukey’s multiple comparisons test). For (D) to (F), n = 7 mice for the vehicle, cisplatin, and AU-15330 groups; n = 8 for cisplatin in combination with AU-15330 (Cisp + AU).
Fig. 8.
Fig. 8.. Treatment with AU-15330 in combination with cisplatin reduces ovarian tumor size in an NK-dependent manner.
(A) Schematic of the in vivo intraperitoneal injection of ID8 Trp53−/− cells and treatment with cisplatin and AU-15330, alone or in combination. iv, intravenous. (B) Tumor weight (milligrams) of mice treated with vehicle (V), cisplatin (C), AU-15330 (AU), and cisplatin in combination with AU-15330 (C + AU). Data represent means ± SD; one-way ANOVA (Tukey’s multiple comparisons test). (C) Percentage of mice with a tumor weight below 60 mg from (B). For (B) and (C), n = 10 mice for the V, C, and C + AU groups; n = 13 mice for the AU group. (D) Representative images (left) and quantification (right) of SMARCA4 IF staining in omental tumors. Scale bar, 50 μm. Data represent means ± SD. *P < 0.05 and **P < 0.01; one-way ANOVA (Tukey’s multiple comparisons test). n = 7 mice for the V, AU, and C + AU groups; n = 6 mice for the C group. (E) Representative images (left) and quantification (right) of Ki67 staining in omental tumors. Scale bars, 100 μm. Data represent means ± SD. *P < 0.05; one-way ANOVA (Tukey’s multiple comparisons test). n = 10 mice for the V, C, and C + AU groups; n = 8 mice for the AU group. (F) Schematic of the in vivo depletion of NK cells in ID8 Trp53−/− cells injected intraperitoneally. Mice were treated with the combination of cisplatin and AU-15330 together with αNK1.1 antibody. Immunoglobulin G (IgG) antibody was used as a control. (G) Flow cytometry analysis of NK cell counts in omental tumors. Data represent means ± SD. **P < 0.01; two-way ANOVA (Šídák’s multiple comparisons test). (H) Tumor weight (milligrams) of mice treated with vehicle C + AU + αNK1.1 and C + AU + IgG. Data represent means ± SD; Mann-Whitney test. For (F) to (H), n = 10 mice for the C + AU + IgG and C + AU + αNK1.1 groups.

Similar articles

Cited by

References

    1. Gorgoulis V., Adams P. D., Alimonti A., Bennett D. C., Bischof O., Bishop C., Campisi J., Collado M., Evangelou K., Ferbeyre G., Gil J., Hara E., Krizhanovsky V., Jurk D., Maier A. B., Narita M., Niedernhofer L., Passos J. F., Robbins P. D., Schmitt C. A., Sedivy J., Vougas K., von Zglinicki T., Zhou D., Serrano M., Demaria M., Cellular senescence: Defining a path forward. Cell 179, 813–827 (2019). - PubMed
    1. Birch J., Gil J., Senescence and the SASP: Many therapeutic avenues. Genes Dev. 34, 1565–1576 (2020). - PMC - PubMed
    1. Faget D. V., Ren Q., Stewart S. A., Unmasking senescence: Context-dependent effects of SASP in cancer. Nat. Rev. Cancer 19, 439–453 (2019). - PubMed
    1. Collado M., Serrano M., Senescence in tumours: Evidence from mice and humans. Nat. Rev. Cancer 10, 51–57 (2010). - PMC - PubMed
    1. Krizhanovsky V., Yon M., Dickins R. A., Hearn S., Simon J., Miething C., Yee H., Zender L., Lowe S. W., Senescence of activated stellate cells limits liver fibrosis. Cell 134, 657–667 (2008). - PMC - PubMed

MeSH terms

LinkOut - more resources