. 2025 Mar 11;9(5):1185-1201.
doi: 10.1182/bloodadvances.2024014805.

α-Actinin-1 deficiency in megakaryocytes causes low platelet count, platelet dysfunction, and mitochondrial impairment

Affiliations

α-Actinin-1 deficiency in megakaryocytes causes low platelet count, platelet dysfunction, and mitochondrial impairment

Xiangjie Lin et al. Blood Adv. .

Abstract

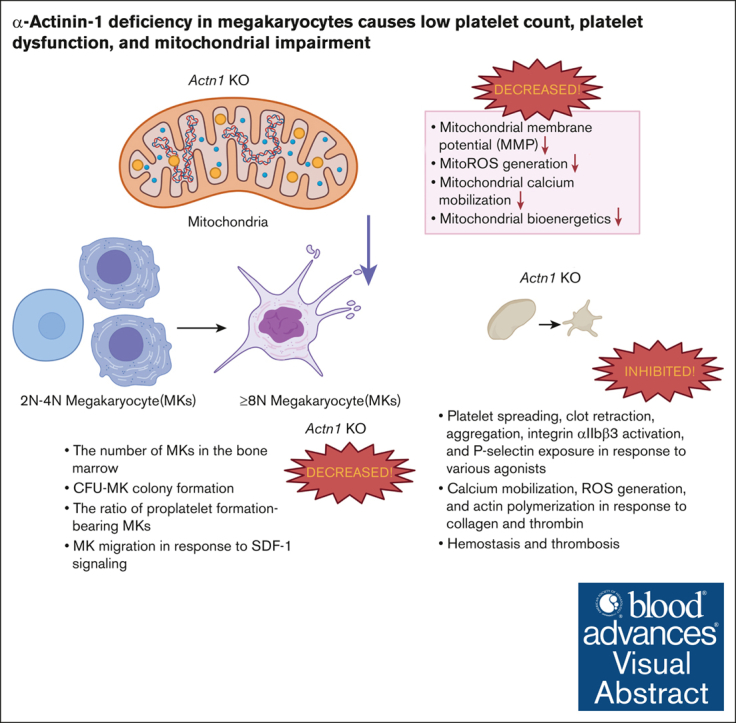
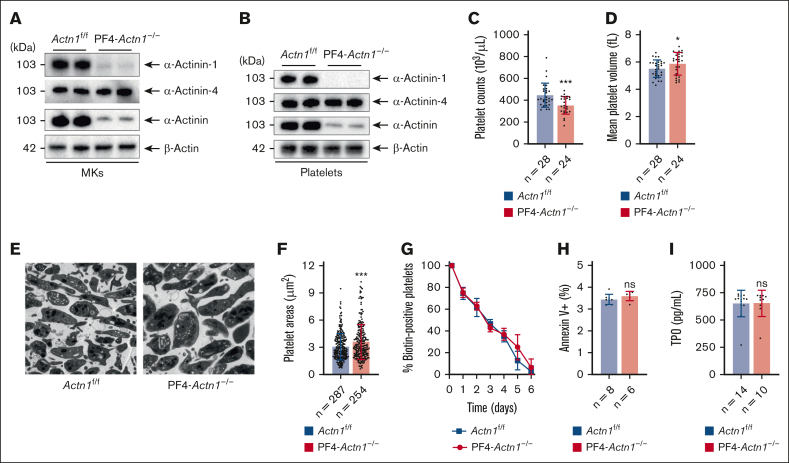
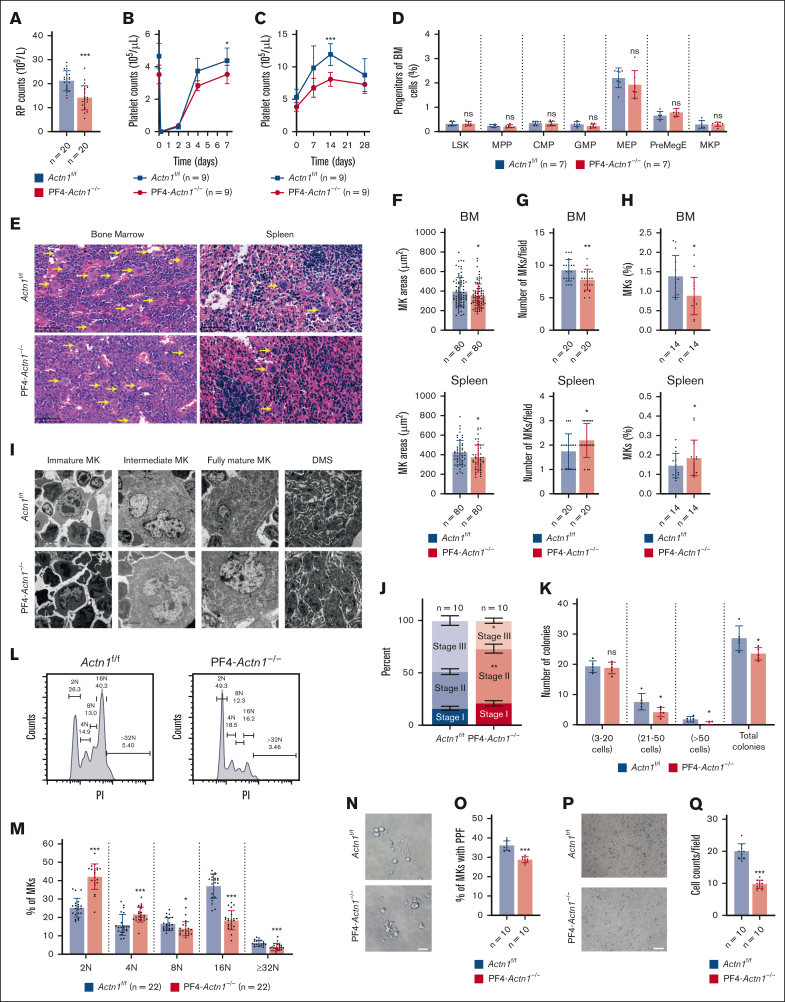
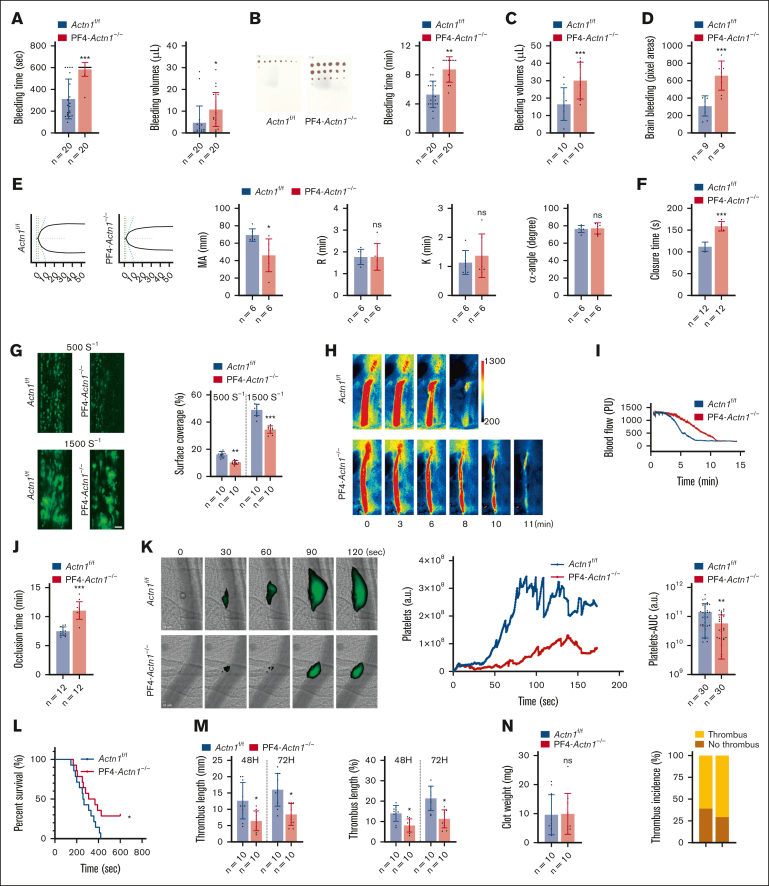
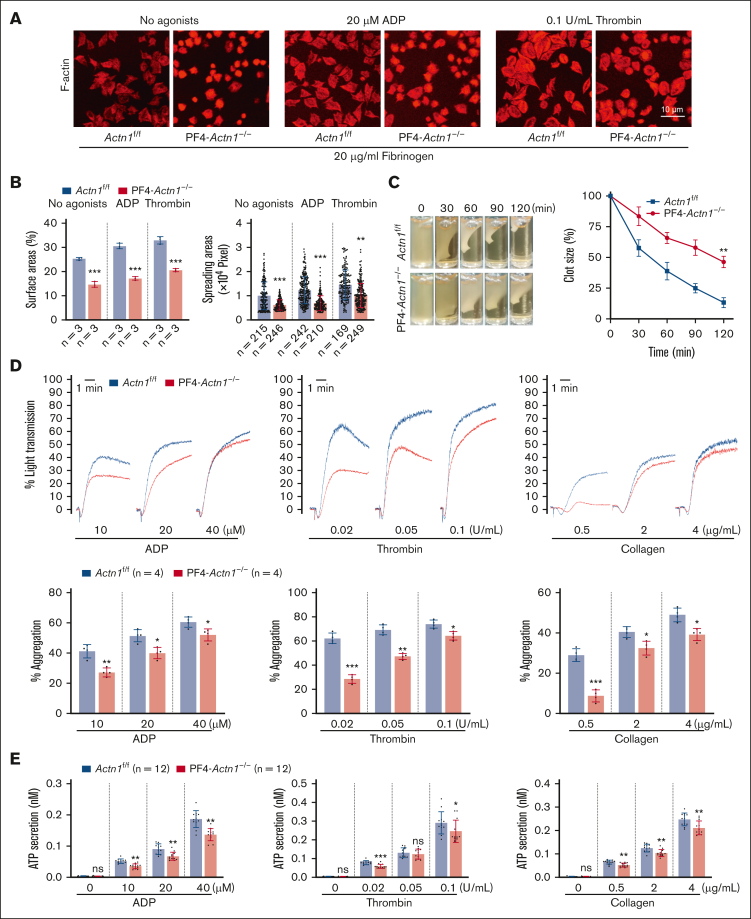
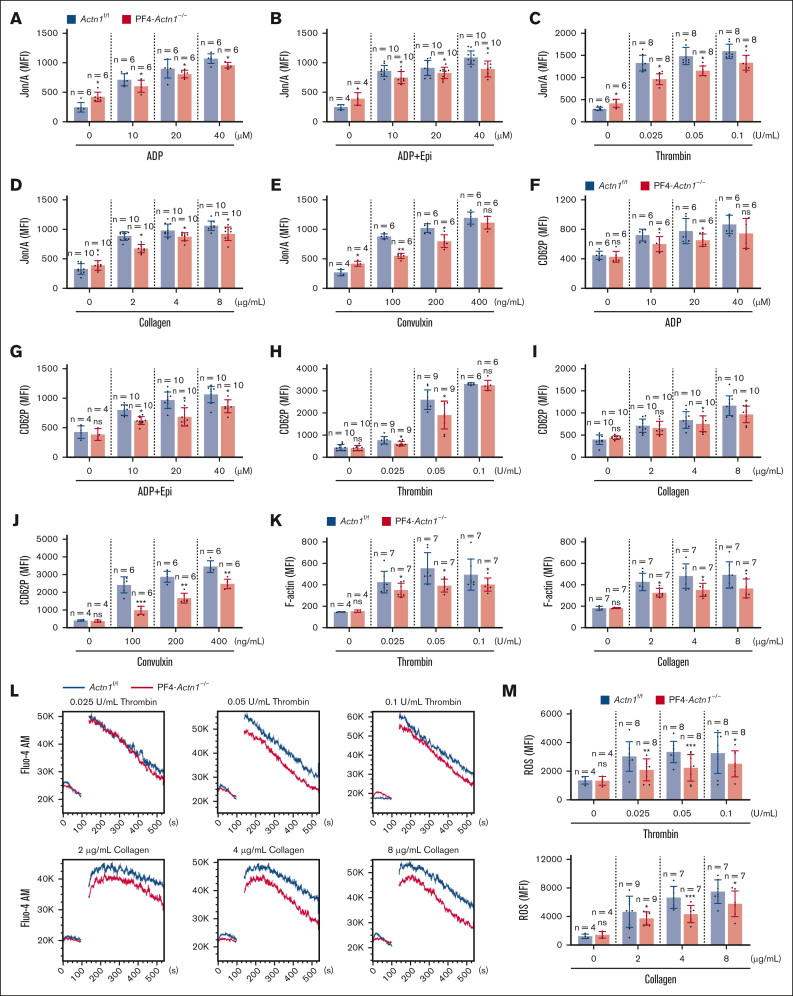
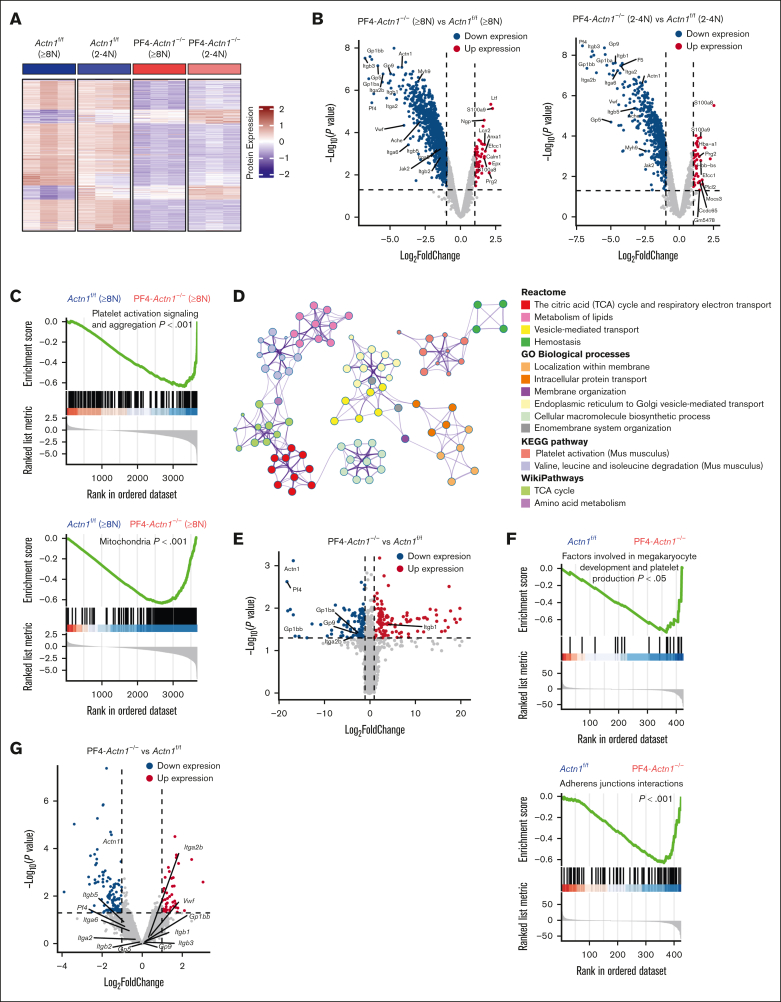
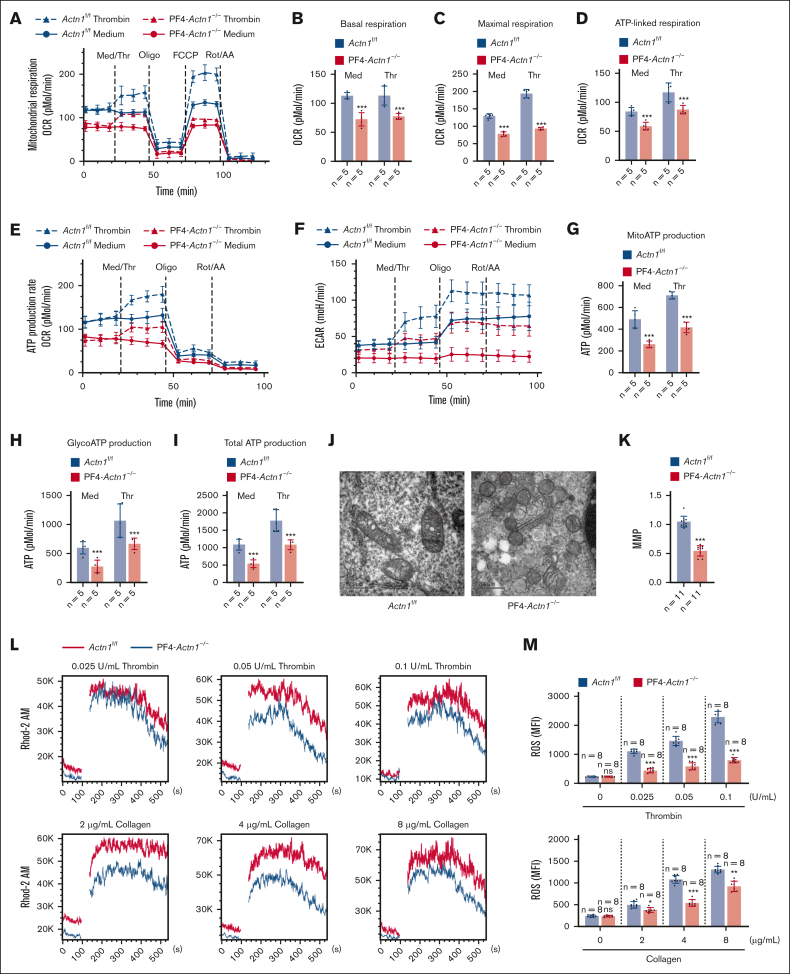
Cytoskeletal remodeling and mitochondrial bioenergetics play important roles in thrombocytopoiesis and platelet function. Recently, α-actinin-1 mutations have been reported in patients with congenital macrothrombocytopenia. However, the role and underlying mechanism of α-actinin-1 in thrombocytopoiesis and platelet function remain elusive. Using megakaryocyte (MK)-specific α-actinin-1 knockout (KO; PF4-Actn1-/-) mice, we demonstrated that PF4-Actn1-/- mice exhibited reduced platelet counts. The decreased platelet number in PF4-Actn1-/- mice was due to defects in thrombocytopoiesis. Hematoxylin and eosin staining and flow cytometry revealed a decrease in the number of MKs in the bone marrow of PF4-Actn1-/- mice. The absence of α-actinin-1 increased the proportion of 2 N-4 N MKs and decreased the proportion of 8 N-32 N MKs. Colony-forming unit-MK colony formation, the ratio of proplatelet formation-bearing MKs, and MK migration in response to stromal cell-derived factor-1 signaling were inhibited in PF4-Actn1-/- mice. Platelet spreading, clot retraction, aggregation, integrin αIIbβ3 activation, and CD62P exposure in response to various agonists were decreased in PF4-Actn1-/- platelets. Notably, PF4-Actn1-/- platelets inhibited calcium mobilization, reactive oxygen species (ROS) generation, and actin polymerization in response to collagen and thrombin. Furthermore, the PF4-Actn1-/- mice exhibited impaired hemostasis and thrombosis. Mechanistically, proteomic analysis of low-ploidy (2-4 N) and high-ploidy (≥8 N) PF4-Actn1-/- MKs revealed that α-actinin-1 deletion reduced platelet activation and mitochondrial function. PF4-Actn1-/- platelets and Actn1 KO 293T cells exhibited reduced mitochondrial membrane potential, mitochondrial ROS generation, mitochondrial calcium mobilization, and mitochondrial bioenergetics. Overall, in this study, we report that mice with α-actinin-1 deficiency in MKs exhibit low platelet count and impaired platelet function, thrombosis, and mitochondrial bioenergetics.


Conflict of interest statement

Conflict-of-interest disclosure: The authors declare no competing financial interests.

Figures

None
Graphical abstract
Figure 1.
Figure 1.
PF4-Actn1−/− mice recapitulate the main features of thrombocytopenia without changes in platelet turnover. (A) Mouse MKs were isolated from the BM of Actn1f/f and PF4-Actn1−/− mice by flow sorting, and the protein expression of α-actinin-1, α-actinin-4, and total α-actinin was analyzed via western blotting. β-Actin was used as a loading control. (B) Washed platelets from Actn1f/f and PF4-Actn1−/− mice were lysed, and the protein levels of α-actinin-1, α-actinin-4, and total α-actinin were analyzed via western blotting. β-Actin was used as a loading control. (C) Platelet counts in the peripheral blood of Actn1f/f (n = 28 mice) and PF4-Actn1−/− (n = 24 mice) mice. (D) Mean platelet volume in Actn1f/f (n = 28 mice) and PF4-Actn1−/− (n = 24 mice) mice. (E) TEM images of platelets from Actn1f/f and PF4-Actn1−/− mice. Representative images from 1 of 3 experiments with similar results are displayed. The scale bar is 2 μm. Male mice aged 6 to 10 weeks were used for these animal experiments. (F) The area of each platelet in cross-sections of the TEM was measured (n = 287, Actn1f/f platelets; n = 254, PF4-Actn1−/− platelets). (G) The platelet life span was measured by determining the percentage of biotin-positive platelets in vivo at the indicated time points after tail vein injection of NHS (N-hydroxysuccinimide ester)–biotin in Actn1f/f and PF4-Actn1−/− mice (n = 10 mice per group). (H) Platelet apoptosis in Actn1f/f (n = 8 mice) and PF4-Actn1−/− (n = 6 mice) mice was measured by flow cytometry. (I) The concentration of TPO in the serum of Actn1f/f (n = 14 mice) and PF4-Actn1−/− (n = 10 mice) mice. ∗P < .05; ∗∗∗P < .005. ns, not significant.
Figure 2.
Figure 2.
α-Actinin-1 depletion in MKs suppresses megakaryopoiesis, as evidenced by the inhibition of MK polyploidization, PPF, and MK migration. (A) The counts of reticulated platelets in the peripheral blood of Actn1f/f and PF4-Actn1−/− mice (n = 20 mice per group). (B) Platelet depletion in Actn1f/f and PF4-Actn1−/− mice was induced by tail vein injection of an anti-CD42b antibody, after which platelet counts were monitored at different time points (n = 9 mice per group). (C) Splenectomies were performed on Actn1f/f and PF4-Actn1−/− mice, and platelet numbers in the peripheral blood were counted at the indicated time points (n = 9 mice per group). (D) The percentage of progenitors among the BM nucleated cells (n = 7 mice per group). (E) Representative cross-sectional images from 4 experiments. Femurs (BM, left panels) and whole murine spleens (right panels) from Actn1f/f and PF4-Actn1−/− mice were H&E stained. The MKs are indicated by yellow arrows. The scale bar is 50 μm. (F) The area of MKs in the BM and spleen cross-sections was measured for Actn1f/f and PF4-Actn1−/− mice (n = 80 platelets per group). (G) Quantification of the number of MKs in BM and spleen cross-sections from Actn1f/f and PF4-Actn1−/− mice (n = 20 fields per group). (H) The percentage of MKs among all nucleated cells in the BM (upper panel) and spleen (lower panel) (n = 14 mice per group). (I) Representative TEM images of MKs in the BM of Actn1f/f and PF4-Actn1−/− mice. Immature MKs (stage 1) have a single large nucleus and no granules; intermediate MKs (stage 2) have a lobulated nucleus and contain immature, platelet-specific granules; and fully mature MKs (stage 3) have a mature demarcation membrane system (DMS) and contain mature α-granules and dense granules. The scale bar is 5 μm. (J) The percentage of each type of MK in the BM of Actn1f/f and PF4-Actn1−/− mice (n = 10 mice per group). (K) Colony-forming unit (CFU)–MK colonies formed from BM Lin progenitor cells. The number of small (3-20 MKs), intermediate (21-50 MKs), and large (>50 MKs) colonies and the total number of colonies per slide were calculated for 5 independent experiments (n = 5 slides per group). (L) Detection of polyploidy in MKs from Actn1f/f and PF4-Actn1−/− mice by flow cytometry. (M) Bar graph showing the level of nuclear ploidy in Actn1f/f and PF4-Actn1−/− mice examined by flow cytometry (n = 22 mice per group). (N) Representative images from 5 independent experiments of proplatelet formation. MKs were cultured in vitro from the fetal livers of Actn1f/f and PF4-Actn1−/− mice. Scale bar, 40 μm. (O) The number of PPF-bearing MKs was quantified under a light microscope (n = 10 fields per group). (P) Representative images from 5 independent Transwell experiments of the fetal liver–derived MKs from Actn1f/f and PF4-Actn1−/− mice. The scale bar is 3 mm. (Q) The histogram shows the number of migrated MKs in each field (n = 10 fields per group). ∗P < .05; ∗∗P < .01; ∗∗∗P < .005. CMP, common myeloid progenitor; GMP, granulocyte-macrophage progenitor; LSK, LinScal-1+cKit+; MEP, bipotential MK-erythroid progenitor; MKP, MK progenitor; MPP, multipotent progenitor; ns, not significant; PreMegE, erythroid/MK progenitor; PI, propidium iodide; PPF, proplatelet formation; RP, reticulated platelet.
Figure 3.
Figure 3.
PF4-Actn1−/− mice exhibit reduced primary hemostasis and thrombosis. (A) The tail tips of the mice were amputated, and the mice were then immersed in saline. The tail transection bleeding time and bleeding volume were monitored in Actn1f/f and PF4-Actn1−/− mice (n = 20 mice per group). (B) Tail bleeding time (via the filter paper method) in Actn1f/f and PF4-Actn1−/− mice and the results of the statistical analysis are shown (n = 20 mice per group). (C) Bleeding volumes after a calibrated injury to the liver in Actn1f/f and PF4-Actn1−/− mice (n = 10 mice per group). (D) Relative quantification of the areas of bleeding in the brains of Actn1f/f and PF4-Actn1−/− mice (n = 9 mice per group). (E) Representative thromboelastography (TEG) tracings of whole blood from Actn1f/f and PF4-Actn1−/− mice. Analysis of the maximal amplitude (MA), reaction time, kinetics time, and α-angle in Actn1f/f and PF4-Actn1−/− blood via TEG (n = 6 mice per group). (F) Citrate-anticoagulated blood samples were obtained from Actn1f/f and PF4-Actn1−/− mice and subsequently transferred to collagen/ADP cartridges. The in vitro closure time (CT) was measured with a PFA-200 (n = 12 mice per group). (G) Thrombus formation of Actn1f/f and PF4-Actn1−/− platelets at shear rates of 500 or 1500 s-1. Citrate anticoagulant and recalcified whole blood were perfused at 500 or 1500 s-1 for 5 minutes. An Alexa Fluor 488–conjugated anti-CD41 antibody was used to label the platelets. Thrombus formation was observed and imaged under an inverted fluorescence microscope. The left panel shows representative images from 3 independent experiments of platelet thrombi. Arrows indicate the direction of blood flow. The scale bar is 100 μm. The right panel shows the quantitative data reflecting the percentage of surface coverage (n = 10 fields per group). The data are presented as the mean ± standard deviation (SD) from 10 randomly selected visual fields of at least 3 independent experiments. (H) Representative images of carotid artery blood flow in FeCl3-treated Actn1f/f and PF4-Actn1−/− mice obtained via laser speckle perfusion imaging (n = 12 mice per group). Blood flow was monitored for 20 minutes. (I) Representative traces of blood flow in mice with FeCl3-induced occlusive carotid artery thrombosis. (J) Quantitative analysis of the duration of complete vessel occlusion (n = 12 mice per group). The data are presented as the means ± SDs. (K) Laser injury–induced thrombus formation in the cremasteric arterioles of Actn1f/f and PF4-Actn1−/− mice (n = 5 mice per group). Platelet accumulation was visualized via intravital microscopy after laser injury using a DyLight 649–conjugated anti-GPIbβ (CD42c) antibody derivative. Representative images depicting platelet counts at the indicated time points after injury in Actn1f/f and PF4-Actn1−/− mice. The medium fluorescence intensities of the platelets over time were analyzed for all the images from the Actn1f/f and PF4-Actn1−/− mice. The area under the curve (AUC) for the platelets from each capture was plotted for the Actn1f/f and PF4-Actn1−/− mice (n = 30 captures per group). (L) Survival of Actn1f/f and PF4-Actn1−/− mice after induction of pulmonary thromboembolism via the injection of a collagen/epinephrine mixture through the tail vein (n = 14 mice per group). (M) Actn1f/f and PF4-Actn1−/− mice were intraperitoneally injected with carrageenan solution (1%, 110 μL per mouse). On days 2 and 3, thrombus length was measured in the carrageenan-induced thrombosis mice. The thrombosis rate (the ratio of tail length with thrombus to whole tail length) was calculated for the tails of carrageenan-induced thrombosis mice (n = 10 mice per group). (N) Venous thrombus formation in the deep venous thrombosis model. Thrombus formation in the inferior vena cava (IVC) was induced by partial vein ligation. Twenty-four hours after ligation of the IVC, thrombosis samples were collected to measure the weight and calculate the incidence of thrombus formation in Actn1f/f and PF4-Actn1−/− mice (n = 10 mice per group). ∗P < .05; ∗∗P < .01; ∗∗∗P < .005. ns, not significant.
Figure 4.
Figure 4.
α-Actinin-1 deficiency reduces platelet function, including platelet spreading, clot retraction, aggregation, and ATP secretion. (A) Platelets from Actn1f/f and PF4-Actn1−/− mice were allowed to adhere to, and spread on, fibrinogen-coated coverslips for 90 minutes without or with ADP (20 μmol/L) or thrombin (0.1 U/mL) and then stained with tetramethyl rhodamine isothiocyanate-labeled phalloidin. The data shown are representative pictures from 1 of 3 experiments with similar results. The scale bar is 10 μm. (B) The left panel shows the percentage of the surface area covered by spreading platelets. The right panel displays the surface coverage area of each platelet (n = 3 independent experiments). (C) The clots were photographed at different time points. The percentage of the clot size was generated by calculating the ratio of the surface area of the retracted clots to that of the initial clots (n = 3 independent experiments). The data are presented as the mean and SD of 3 independent experiments. (D) Platelet-rich plasma or washed platelets from Actn1f/f and PF4-Actn1−/− mice were stimulated with ADP (10, 20, and 40 μmol/L), thrombin (0.02, 0.05, and 0.1 U/mL), and collagen (0.5, 2, and 4 μg/mL). The results are expressed as the percent change in light transmission relative to the blank (platelet poor plasma/buffer without platelets), set at 100% (n = 4 independent experiments). (E) ATP secretion from dense granules in platelets stimulated with agonists, including ADP (0, 10, 20, and 40 μmol/L), thrombin (0, 0.02, 0.05, and 0.1 U/mL), and collagen (0, 0.5, 2, and 4 μg/mL). The data are shown as the mean ± SD (n = 12 mice per group). ∗P < .05; ∗∗P < .01; ∗∗∗P < .005. ns, not significant.
Figure 5.
Figure 5.
α-Actinin-1 deficiency inhibits platelet activation, actin polymerization, calcium mobilization, and ROS generation. Flow cytometric analyses of JON/A binding (for activated integrin αIIbβ3) on washed platelets from Actn1f/f and PF4-Actn1−/− mice after stimulation with different agonists, including (A) ADP (0, 10, 20, and 40 μmol/L; n = 6 mice per group), (B) ADP + epinephrine (Epi; 0, 10, 20, and 40 μmol/L; n = 4-10 mice per group), (C) thrombin (0, 0.025, 0.05, and 0.1 U/mL; n = 6-8 mice per group), (D) collagen (0, 2, 4, and 8 μg/mL; n = 10 mice per group), and (E) convulxin (0, 100, 200, and 400 ng/mL; n = 4-6 mice per group). Flow cytometric analyses of CD62P (for exposure) on washed platelets from Actn1f/f and PF4-Actn1−/− mice after stimulation with (F) ADP (0, 10, 20, and 40 μmol/L; n = 6 mice per group), (G) ADP + Epi (0, 10, 20, and 40 μmol/L; n = 4-10 mice per group), (H) thrombin (0, 0.025, 0.05, and 0.1 U/mL; n = 6-10 mice per group), (I) collagen (0, 2, 4, and 8 μg/mL; n = 10 mice per group), or (J) convulxin (0, 100, 200, and 400 ng/mL; n = 4-6 mice per group). Actn1f/f and PF4-Actn1−/− platelets were stimulated with thrombin (n = 4-7 mice per group) and collagen (n = 7 mice per group) at the indicated concentrations, and the relative F-actin content (K) was determined by flow cytometry. (L) Representative traces of changes in global calcium content (n = 6 mice per group). (M) The levels of intracellular ROS in Actn1f/f and PF4-Actn1−/− platelets stimulated with thrombin (n = 4-8 mice per group) and collagen (n = 4-7 mice per group) at the indicated concentrations were determined by flow cytometry. The data are presented as the mean ± SD. ∗P < .05; ∗∗P < .01; ∗∗∗P < .005. Fluo-4 AM, Fluo-4 acetoxymethyl ester; MFI, mean fluorescence intensity; ns, not significant.
Figure 6.
Figure 6.
Bioinformatics analysis showing that α-actinin-1 deficiency alters platelet production and function through mitochondrial protein expression. (A) Heat map of the MK proteomics of low (ploidy 2 N and 4 N) or high (ploidy ≥8 N) ploidy after differential protein expression analysis. (B) Volcano plots showing differential protein expression in low- or high-ploidy MKs between Actn1f/f and PF4-Actn1−/− mice. (C) GSEA of differentially expressed proteins in high-ploidy MKs between Actn1f/f and PF4-Actn1−/− mice. The altered proteins in high-ploidy MKs revealed a signature related to platelet activation signaling and aggregation and mitochondria. (D) Network of enriched terms, which are colored according to cluster identity (ID), with nodes that share the same cluster ID typically close to each other. (E) Volcano plot of differential protein expression in platelets between Actn1f/f and PF4-Actn1−/− mice. (F) GSEA of differentially expressed proteins in platelets from Actn1f/f and PF4-Actn1−/− mice. The altered proteins in platelets revealed a signature related to factors involved in MK development and platelet production and adherens junction interactions. (G) Volcano plot of differentially expressed genes in MKs between Actn1f/f and PF4-Actn1−/− mice. GO, gene ontology; KEGG, Kyoto Encyclopedia of Genes and Genomes.
Figure 7.
Figure 7.
α-Actinin-1 deficiency results in impaired mitochondrial bioenergetics. (A) Mitochondrial respiration in platelets from Actn1f/f or PF4-Actn1−/− mice stimulated with medium (Med) or thrombin (Thr; 0.1 U/mL) was evaluated via Seahorse tracings (n = 5 independent experiments per group). The oxygen consumption rate (OCR) was measured with sequential injections of Med or thrombin (0.1 U/mL), oligomycin (Oligo), trifluoromethoxy carbonyl cyanide phenylhydrazone, or rotenone/antimycin A (Rot/AA). The following critical parameters of mitochondrial function were calculated: (B) basal respiration, (C) maximal respiration, and (D) ATP-linked respiration. Representative OCR (E) and extracellular acidification rate (ECAR) (F) data for Actn1f/f or PF4-Actn1−/− platelets treated with Med or Thr (0.1 U/mL) according to the real-time ATP rate assay protocol (n = 5 independent experiments per group). Metabolic flux analysis showing the quantification of (G) mitochondrial ATP (mitoATP) production, (H) GP ATP (glycoATP) production, and (I) total ATP production. The results are presented as the means ± SDs. (J) Representative TEM images from 3 independent experiments of mitochondria in Actn1f/f or PF4-Actn1−/− MKs. (K) The mitochondrial membrane potential (MMP) in platelets was analyzed via flow cytometry. The data are presented as bar graphs (n = 11 mice per group). (L) Representative traces of changes in mitochondrial calcium content. Mitochondrial calcium mobilization in thrombin-stimulated (0.025, 0.5, and 0.1 U/mL) and collagen-stimulated (2, 4, and 8 μg/mL) platelets was examined by flow cytometry (n = 8 mice per group). (M) The levels of mitochondrial ROS in the presence or absence of thrombin (0.025, 0.5, and 0.1 U/mL) or collagen (2, 4, and 8 μg/mL) were evaluated (n = 8 mice per group). The data are presented as the mean ± SD. ∗P < .05; ∗∗P < .01; ∗∗∗P < .005. MFI, mean fluorescence intensity; ns, not significant.

Similar articles

Cited by

References

    1. Huang J, Li X, Shi X, et al. Platelet integrin αIIbβ3: signal transduction, regulation, and its therapeutic targeting. J Hematol Oncol. 2019;12(1):26. - PMC - PubMed
    1. Manne BK, Campbell RA, Bhatlekar S, et al. MAPK-interacting kinase 1 regulates platelet production, activation, and thrombosis [published correction appears in Blood 2023;141(24):3007] Blood. 2022;140(23):2477–2489. - PMC - PubMed
    1. Guo L, Shen S, Rowley JW, et al. Platelet MHC class I mediates CD8+ T-cell suppression during sepsis. Blood. 2021;138(5):401–416. - PMC - PubMed
    1. Ma C, Fu Q, Diggs LP, et al. Platelets control liver tumor growth through P2Y12-dependent CD40L release in NAFLD. Cancer Cell. 2022;40(9):986–998.e5. - PMC - PubMed
    1. Lefrancais E, Ortiz-Munoz G, Caudrillier A, et al. The lung is a site of platelet biogenesis and a reservoir for haematopoietic progenitors. Nature. 2017;544(7648):105–109. - PMC - PubMed