. 2025 May 1;145(18):2056-2069.
doi: 10.1182/blood.2024026273.

Defining 2 biologically and clinically distinct groups in acute leukemia with a mixed phenotype

Affiliations

Defining 2 biologically and clinically distinct groups in acute leukemia with a mixed phenotype

Pallavi Galera et al. Blood. .

Abstract

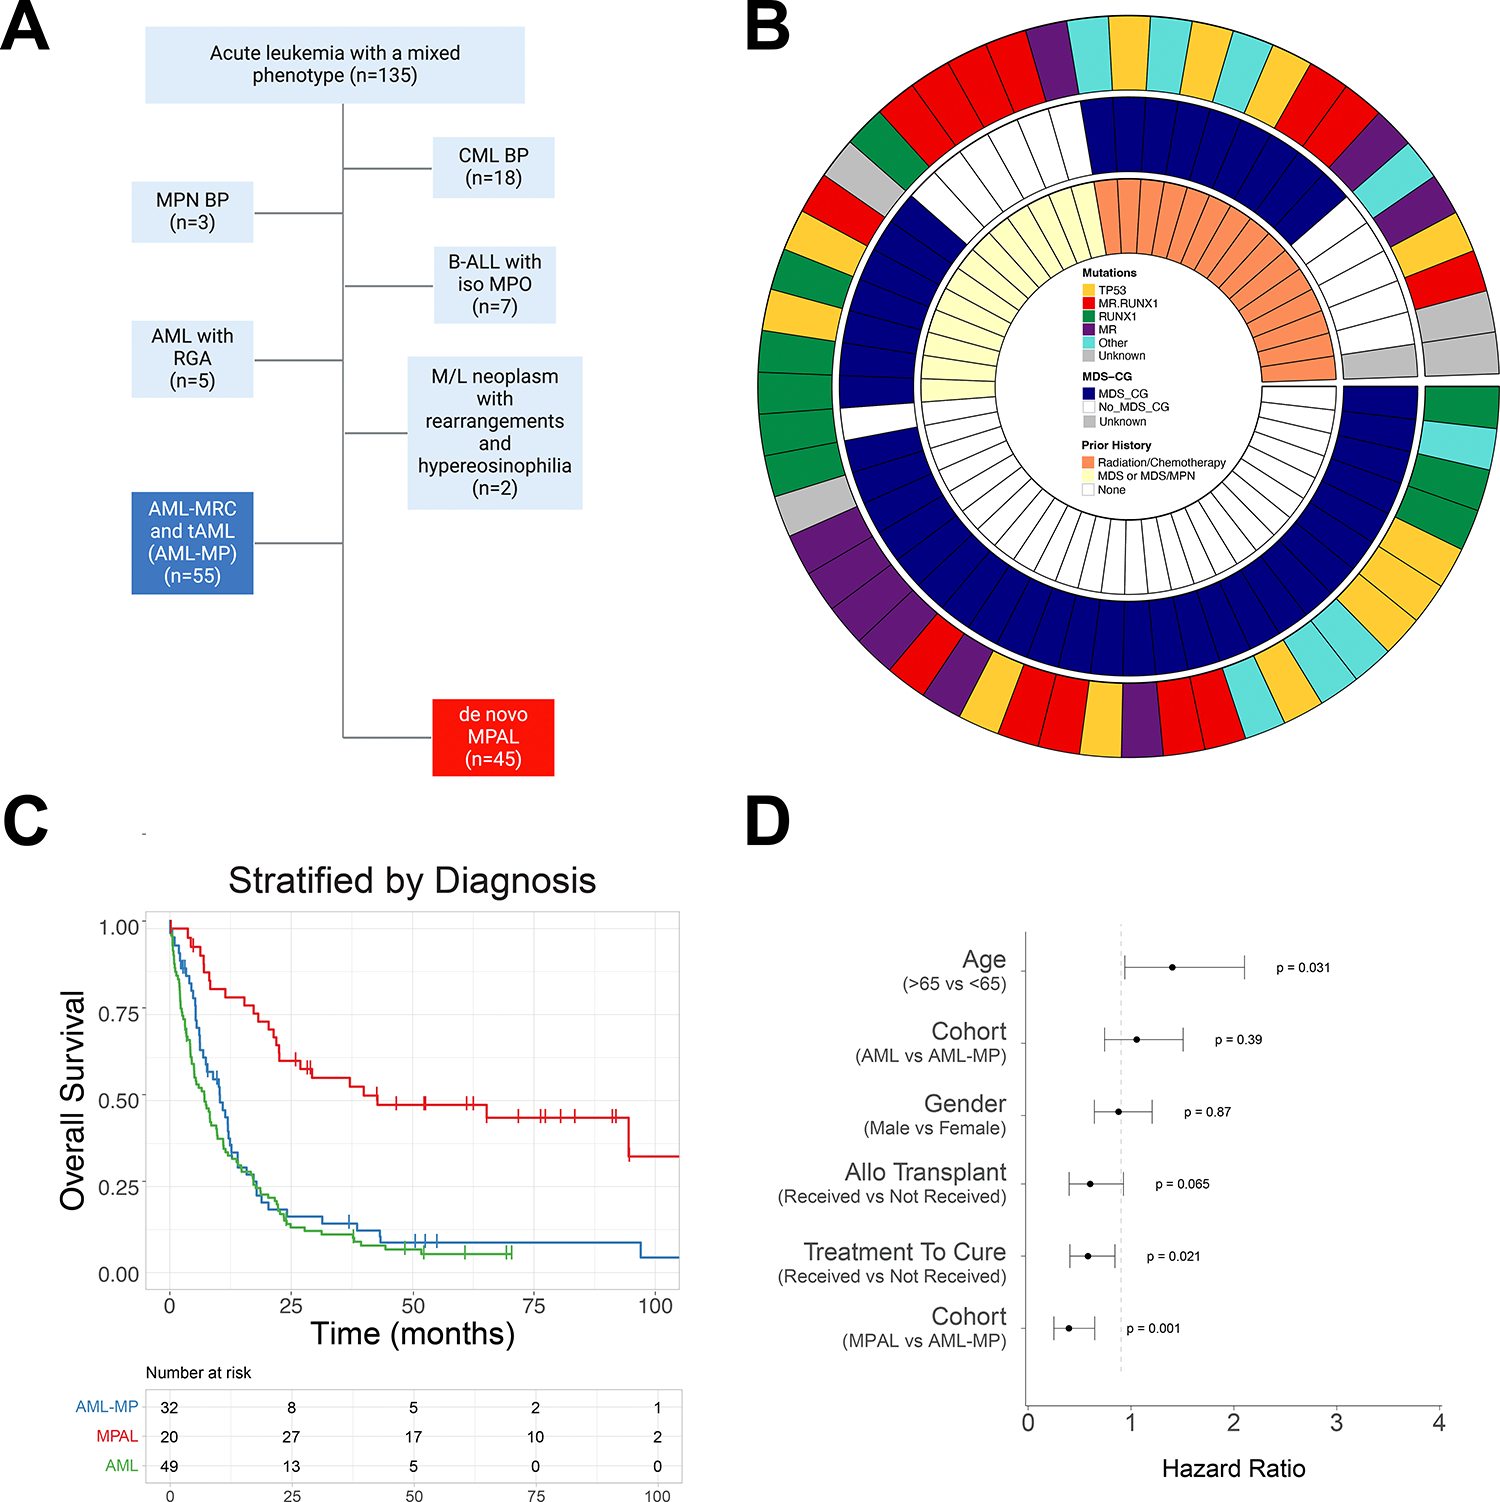
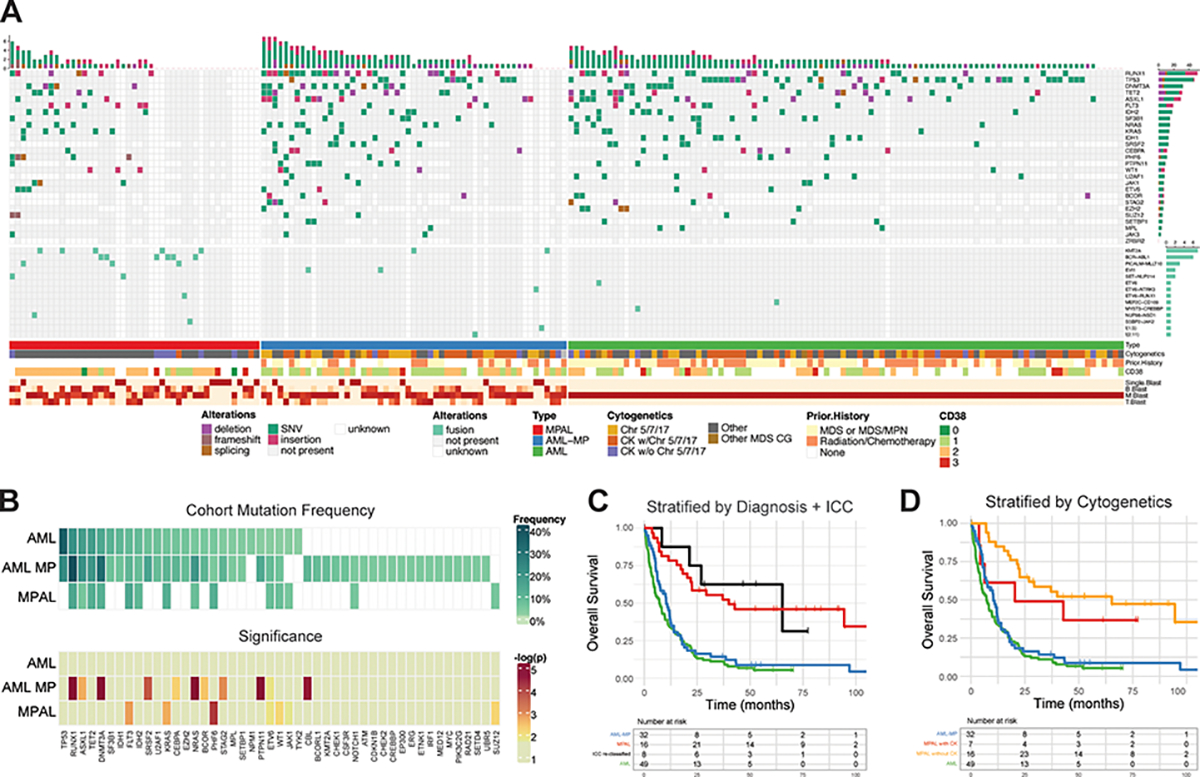
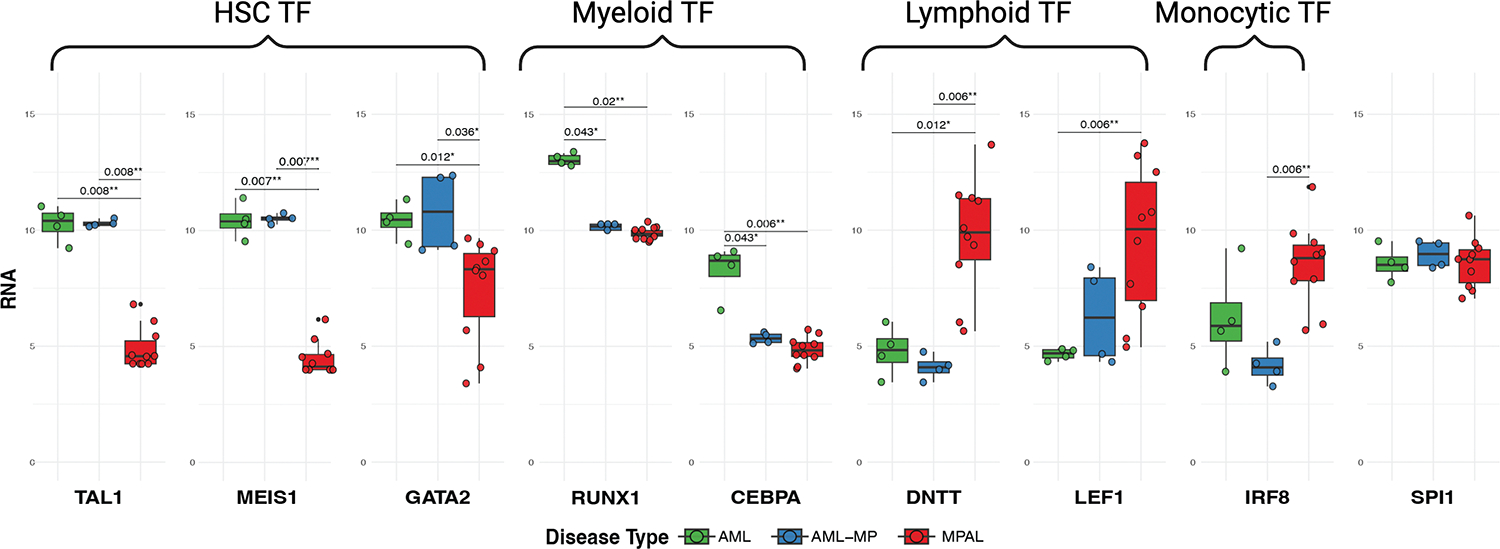
A mixed phenotype (MP) is a characteristic of de novo MP acute leukemia (MPAL), but it can also be found in other leukemias. It poses substantial classification and management dilemmas. Herein, we report a large cohort of acute leukemia with MP and define acute myeloid leukemia with MP (AML-MP) and MPAL as 2 distinct groups by characterizing clinical, genetic, and transcriptomic features. Clinically, patients with AML-MP and MPAL were both treated with either AML- or acute lymphoblastic leukemia (ALL)-directed induction regimens. AML-MP has inferior responses (hazard ratio, 12.5; 95% confidence interval, 2.72-57.8; P = .001), whereas MPAL has better responses to ALL-directed treatment. Genetically, AML-MP harbors more frequent RUNX1 (23/52 [44%]) and TP53 (12/52 [23.1%]) mutations. In contrast, RUNX1 mutations are less frequent in MPAL (8/35 [23%]; P = .01 vs AML-MP) and TP53 mutations as a driver are virtually absent in MPAL. Transcriptionally, AML-MP shows enrichment for stemness signatures and a relative deficit of transcription factors critical for myeloid and lymphoid differentiation. Furthermore, AML-MP rarely switches to a lymphoid immunophenotype after treatment, in contrast to MPAL (1/40 [2.5%] vs 10/28 [35.7%]; P = .0003). Last, a genomic classification framework is proposed for future studies. Together, these data support the designation of AML-MP as a diagnosis distinct from MPAL and provide novel insights into the pathogenesis and therapies of acute leukemia with MP.


Conflict of interest statement

Conflict of Interest:

M.A served as consultant for Janssen Global Services, Bristol-Myers Squibb, AstraZeneca, and Roche; and has received honoraria from Biocartis, Invivoscribe, physician educational resources (PER), Peerview Institute for medical education, clinical care options, RMEI medical education. RLL is on the supervisory board of Qiagen and is a scientific advisor to Imago, Mission Bio, Syndax. Zentalis, Ajax, Bakx, Auron, Prelude, C4 Therapeutics and Isoplexis for which he receives equity support. RLL receives research support from Ajax and Abbvie and has consulted for Incyte, Janssen, Morphosys and Novartis. He has received honoraria from Astra Zeneca and Kura for invited lectures and from Gilead for grant reviews. M.R. is on the scientific advisory board in Auron Pharmaceutical for which he received equity support. He receives research funding from Celularity, Roche-Genentech, Beat AML and NGM and travel fund from BD Biosciences. J.L.G. received consulting fees from GLG.W.X. has received research support from Stemline Therapeutics. P.G. has received research support from Paige.AI. M.B.G. has received research support from Sanofi, Amgen, and Actinium Pharmaceuticals, Inc., and has consulted for Novartis and Sanofi.

Figures

FIGURE 1:
FIGURE 1:. Diagnostic algorithm and clinical features for AML-MP and MPAL.
A. Inclusion and exclusion criteria of AML-MP and MPAL cohorts. Only 1/3 of patients presented with acute leukemia with a mixed phenotype had bona fide MPAL. Abbreviations: CML BP, chronic myeloid leukemia with blast phase; MPN BP, myeloproliferative neoplasm with blast phase; B-ALL with iso MPO, B-acute lymphoblastic leukemia with isolated myeloperoxidase expression; AML with RGA, acute myeloid leukemia with recurrent genetic abnormalities; M/L, myeloid and lymphoid; AML-MR, acute myeloid leukemia with myelodysplasia-related changes; t-AML, therapy-related AML; MPAL, mixed phenotype acute leukemia. B. Circos plot of the AML-MP cohort detailing the inclusion criteria namely prior history of cytotoxic chemotherapy and/or radiotherapy administered for a non-myeloid neoplastic or non-neoplastic disorder for t-AML (15 cases) and prior history of MDS and/or MDS/MPN and/or the presence of MDS defining cytogenetic abnormalities for AML-MR (39 cases; 6 cases with prior history of MDS and/or MDS/MPN only, 26 cases with MDS defining cytogenetic abnormalities only, and 7 cases with both). 1 case lacking both history of MDS and/or MDS/MPN and MDS defining cytogenetic abnormalities had met morphologic dysplasia criteria and had mutational profile typical for AML and was classified as AML-MRC. MR.RUNX1 represents patients with MR and RUNX1 comutations. MR represents patients with MR mutations (not including RUNX1). RUNX1 represents patients with RUNX1 mutations while no other MR mutations. MR mutations include mutations in any of these genes: ASXL1, BCOR, EZH2, STAG2, SF3B1, SRSF2, U2AF1, and ZRSR2. MDS-CG, MDS related cytogenetic abnormalities which included complex karyotype (≥ 3 abnormalities), 5q deletion or loss of 5q due to unbalanced translocation, monosomy 7, 7q deletion, or loss of 7q due to unbalanced translocation, 11q deletion, 12p deletion or loss of 12p due to unbalanced translocation, monosomy 13 or 13q deletion, 17p deletion or loss of 17p due to unbalanced translocation, isochromosome 17q and idic(X)(q13). Abbreviations: MDS, myelodysplastic syndrome/neoplasm; MDS/MPN, myelodysplastic and myeloproliferative overlap syndrome. C. Kaplan-Meier curves of overall survival stratified by disease types. Red line, MPAL; green line, AML without mixed phenotype; blue line, AML-MP. D. Multivariate cox proportional hazards analysis showing the influence of individual features on clinical outcomes. These include age over 65, gender, disease type (either AML-MP or MPAL with AML as the reference), treatment with intension to cure (intensive vs. non-intensive treatment), and receipt of an allogeneic stem cell transplant.
FIGURE 2:
FIGURE 2:. Differential clinical responses of AML-MP and MPAL.
A. Treatment regimens received by patients who screened into the cohort broken down by disease type and labeled according to the type of treatment regimen received. Intensive therapies are broken down into myeloid- and lymphoid targeted regimens. Low intensity regimens were predominantly myeloid based using a hypomethylating agent backbone (HMA) with or without the addition of venetoclax. Other lower intensity regimens are aggregated into the ‘Other’ category. B. Comparison of lymphoid blast proportion in patients treated with AML- vs ALL-directed regimens. C-D. Survival analyses of patients with AML-MP (C) and MPAL (D) treated with either AML (intensive myeloid)- or ALL (intensive lymphoid)-directed induction therapy.
FIGURE 3:
FIGURE 3:. Lineage dynamics in MPAL and AML-MP.
A. Bar graph comparing lineage shift post treatment (either post induction or relapse) split according to disease type. myeloid: myeloid lineage only blasts; lymphoid, lymphoid lineage only blasts. B-C. Alluvial plots of AML-MP (B) and MPAL (C) lineage dynamics between diagnosis, treatment, and relapse time points. Dx, diagnosis; B, B lineage blasts; B/M, blasts with B/myeloid mixed lineage phenotype; B/T, blasts with B/T mixed lineage phenotype; T, T lineage blasts; T/B/M, blasts with T/B/myeloid mixed lineage phenotype; T/M, blasts with T/myeloid mixed lineage phenotype; M, myeloid lineage blasts; NEG, no abnormal blasts detected; unknown, no information available.
FIGURE 4:
FIGURE 4:. Landscape of gene mutations and cytogenetic abnormalities in AML-MP and MPAL.
A. The oncoplot tabulates mutations, fusions, cytogenetics, prior history of cytotoxic chemotherapy and/or radiotherapy, prior history of MDS and/or MDS/MPN for all the 3 cohorts (AML-MP, MPAL and AML without MP) along with the blast lineage and CD38 expression intensity annotated on the bottom bar. The genes not included in the NGS panel during sequencing were marked as blank. B blasts, B-lineage blasts; M blasts, myeloid lineage blasts; T-blasts, T-lineage blasts. SNV, single nucleotide variant. Chr5/7/17, MDS-cytogenetic abnormalities involving chromosomes 5, 7 or 17 but not qualifying for complex karyotype; CK w/ Chr5/7/17, complex karyotype with MDS defining cytogenetic abnormalities involving chromosomes 5, 7 or 17; CK w/o Chr5/7/17, complex karyotype but not involving chromosomes 5, 7 or 17. B. Mutation frequency within the cohort and significance. The upper heatmap shows the frequency of each mutation within the cohort and the bottom panel shows the significance of the enrichment in each disease relative to the overall cohort using a one tailed Fisher’s exact test. The AML subset notably is does not have any mutations that are uniquely distinct from the combined non-AML cases in the cohort. D. Kaplan-Meier curves of overall survival after re-classifying MPAL cases according to the presence of RUNX1 with or without MR gene mutations. The black line (‘ICC reclassified’) contains MPAL patients harboring RUNX1 (with or without MR) mutations. The red line contains MPAL patients with no RUNX1 mutations. AML (green) and AML-MP (blue) are defined as before. E. Kaplan-Meier curves of overall survival after stratifying MPAL cases according to the presence or absence of complex karyotype. MPAL patients with complex karyotypes are shown in yellow and MPAL patients without complex karyotypes are shown in red.
FiGURE 5.
FiGURE 5.. Genomic classification of AML-MP vs MPAL.
A. Comparison between revised WHO 4th edition classification and newly proposed genomic classification approaches. Of note, this is after exclusion of well-defined entities listed in Fig 1A and Fig S1 such as CML BP, MPN BP, BALL with iso MPO, AML with RGA and M/L neoplasms with tyrosine kinase rearrangements and eosinophilia. B. Concordance of the two approaches. C. Overall survival of AML-MP vs MPAL classified by genomic approach.
FIGURE 6:
FIGURE 6:. Enriched stemness transcriptomic signatures in AML-MP.
A. Principal component analysis (PCA) conducted on RNA-seq of flow sorted leukemic blasts, colored by disease type. B. Gene set enrichment tests on transcriptome of flow sorted leukemic blasts comparing AML-MP and MPAL cases. The mean statistic for gene contrasts (in both positive and negative directions) is displayed per stage, with statistical significance (p= < 0.05) of the enrichment test indicated. Enrichment was conducted using contrived gene sets per hematopoietic lineage stage, indicating high HSC enrichment in AML-MP samples and high monocytic and CD4 positive T-cell lineage enrichment in myeloid and T- blasts in MPAL samples. HSC, hematopoietic stem cells; MPP, multipotent progenitors; LMPP, lymphoid myeloid potent progenitors; CMP, common myeloid progenitors; GMP, granulocytic and monocytic progenitors; MEP, megakaryocytic and erythroid progenitors; CLP, common lymphoid progenitors; Ery, erythroid; NK, nature killer cells; CD4, CD4 positive T cells; CD8, CD8 positive T cells; B, B cells. C. Gene set variation analysis (GSVA) clustered using hierarchical analysis (Euclidean distance, Ward’s method). AML-MP2 (a ~75–79-year-old female), clustering with MPAL, had therapy related history for breast cancer but presented with T-ALL in lymph nodes and T/myeloid leukemia in the marrow. Genetics showed normal karyotype and JAK3/NRAS mutations, and therefore best classified as MPAL rather than (AML-MP/t-AML). D. Selected RNA-seq gene expression stratified by disease type. Among the genes upregulated in AML-MP and AML without MP samples were several master regulators of HSC such as MEIS1, HOXB2, and HOXB3. RNA sequencing studies were performed on 4 cases each of AML-MP (flow sorted myeloid and T-lineage blast populations), MPAL (flow sorted myeloid and T-lineage blast populations), and AML without MP (flow sorted myeloid lineage blast population).
FIGURE 7:
FIGURE 7:. Comparison of gene expression for master regulators of lineage commitment in AML, AML-MP, and MPAL.
Significance values are adjusted p-values resulting from pairwise comparisons using DESeq2. HSC, hematopoietic stem cells; TF, transcription factor.

Comment in

References

    1. Weinberg OK et al. The International Consensus Classification of acute leukemias of ambiguous lineage. Blood 141, 2275–2277 (2023). 10.1182/blood.2022019493 - DOI - PubMed
    1. Haematolymphoid Tumours. WHO Classification of Tumours. 5th edn, Vol. 11 (2024).
    1. Kajal B & Chang H Acute myeloid leukemia with myelodysplasia-related changes demonstrating mixed-lineage phenotype. Blood 128, 1663–1663 (2016). 10.1182/blood-2016-06-723098 - DOI - PubMed
    1. Klairmont MM, Cheng J & Gradowski JF AML with MDS-related changes and blasts of mixed lineage: time for a new provisional entity? Leuk Lymphoma 59, 2752–2754 (2018). 10.1080/10428194.2018.1443451 - DOI - PubMed
    1. Matutes E et al. Mixed-phenotype acute leukemia: clinical and laboratory features and outcome in 100 patients defined according to the WHO 2008 classification. Blood 117, 3163–3171 (2011). 10.1182/blood-2010-10-314682 - DOI - PubMed

MeSH terms

Substances

LinkOut - more resources