. 2025 Mar 5;113(5):719-736.e5.
doi: 10.1016/j.neuron.2024.12.015. Epub 2025 Jan 14.

ApoE3 R136S binds to Tau and blocks its propagation, suppressing neurodegeneration in mice with Alzheimer's disease

Affiliations

ApoE3 R136S binds to Tau and blocks its propagation, suppressing neurodegeneration in mice with Alzheimer's disease

Guiqin Chen et al. Neuron. .

Abstract

PSEN1 E280A carrier for the APOE3 Christchurch variant (R136S) is protected against Alzheimer's disease (AD) symptoms with a distinct anatomical pattern of Tau pathology. However, the molecular mechanism accounting for this protective effect remains incompletely understood. Here, we show that the ApoE3 R136S mutant strongly binds to Tau and reduces its uptake into neurons and microglia compared with ApoE3 wild type (WT), diminishing Tau fragmentation by asparagine endopeptidase (AEP), proinflammatory cytokines by Tau pre-formed fibrils (PFFs) or β-amyloid (Aβ), and neurotoxicity. Further, ApoE3 R136S demonstrates more robust effects in attenuating AEP activation and Tau PFF spreading in the brains of both 5xFAD and Tau P301S mice than in ApoE3 WT, leading to improved cognitive functions. Thus, our findings support the idea that ApoE3 R136S strongly binds Tau and decreases its cellular uptake, abrogating Tau pathology propagation in AD brains.

Keywords: AEP; ApoE3 R136S; cognitive dysfunctions; neurofibrillary tangles; pre-formed fibrils.


Conflict of interest statement

Declaration of interests The authors declare no competing interests.

Figures
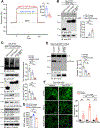
Figure 1.
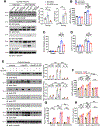
Figure 1.. ApoE3 R136S displays higher binding affinity to Tau and prevents cleavage and aggregation of Tau in vitro.
A. Biacore analysis demonstrated the interaction ApoE3 WT or ApoE3 R136S with Tau proteins. A two-tailed t-test was performed for Kd value and data are shown as means ± SEM. n = 3 each group; *p < 0.05. B. SY5Y cells were co-transfected with GST-Tau and GFP-tagged control vector, ApoE3, or ApoE3 R136S mutant. GST pulldown and immunoblot of lysates were conducted. Quantification of immunoblots showed that ApoE3 R136S displayed higher binding affinity to Tau than ApoE3. C&D. SY5Y cells were treated with DOPEGAL (60 μM) after co-transfection with GST-Tau (~75 kDa) and GFP-tagged control vector, ApoE3, or ApoE3 R136S mutant (~55–60 kDa). Immunoblot showed that Tau oligomerization and phosphorylation by DOPEGAL was decreased by ApoE3 R136S. GFP-ApoE3 significantly elevated AEP enzymatic activities vs GFP control or GFP-ApoE3 R136S. E. Recombinant Tau (5 μg) and active AEP (0.05 μg) proteins were incubated in the presence of ApoE3 WT or ApoE3 R136S proteins. Immunoblot and quantification demonstrated that cleavage of Tau by AEP was inhibited by ApoE3 R136S. F. HEK293 cells stably transfected with GFP-Tau RD were exposed to control, lipidated ApoE3 or ApoE3 R136S proteins, and then followed administration of Tau PFFs. Representative images showed the Tau inclusions in cells and quantification demonstrated the inhibition of Tau inclusions by ApoE3 R136S. Scale bar = 20 μm. One-way (B-E) or two-way ANOVA (F) was used for statistical analysis and data are shown as mean ± SEM. n = 3 (B, C, E), n = 4 (D), n = 5 (F) per group. *p < 0.05, **p < 0.01.
Figure 2.
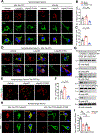
Figure 2.. ApoE3 R136S displays the protective effect against Aβ or Tau PFFs-induced toxicity in neurons.
Primary neurons were cultured and infected with AAV-Control, AAV-ApoE3 or ApoE3 R136S, followed by coinfection of AAV-Tau (2N4R) in the presence of aggregated Aβ. A. Western blot analysis showed that ApoE3 R136S inhibited Tau cleavage by AEP with the quantification of anti-Tau N368 (~37 kDa) and immunoprecipitated anti-ApoE (~34 kDa). B. The activation of AEP was confirmed by enzymatic assay. C. The change of Aβ levels by ApoE3 was measured by ELISA. D. LDH assay showed that ApoE3 R136S reduced cell death by Tau and Aβ. One-way ANOVA was used for statistical analysis and data are shown as mean ± SEM. n = 3 for A, n = 5 for B-D. *p < 0.05, **p < 0.01. Primary neurons were cultured and treated with vehicle, lipidated ApoE3 or lipidated ApoE3 R136S, followed by addition of Tau PFF and Aβ. E. Western blot analysis showed that lipidated ApoE3 R136S inhibited Tau expression and oligomerization. F. The activation of AEP was confirmed by enzymatic assay. G. The change of Aβ levels by ApoE3 or ApoE3 R136S was measured by ELISA. H. LDH assay showed that ApoE3 R136S reduced cell death by Tau and Aβ. Two-way ANOVA was used for statistical analysis and data are shown as mean ± SEM. n = 3 for E, n = 5 for F-H. *p < 0.05, **p < 0.01.
Figure 3.
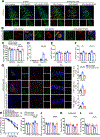
Figure 3.. ApoE3 R136S inhibits uptake of Aβ or Tau PFFs into NE neurons and neuronal death.
Primary LC neurons were prepared and treated with Atto-Tau PFF (2N4R) or Atto-Aβ in the presence of vehicle, lipidated ApoE3, or lipidated ApoE3 R136S. A. Upper panels showed representative immunofluorescent images for uptake of Atto-labeled Tau PFF or Aβ into neurons (red). Second panels showed NE neurons for DBH (green). Scale bar = 20 μm. B & C. Quantification of Tau PFF (B) or Aβ+ (C) cells demonstrated that neuronal internalization of Tau PFF or Aβ was inhibited by ApoE3 R136S. One-way ANOVA was used for statistical analysis and data are shown as mean ± SEM. n = 5. *p < 0.05, **p < 0.01. D. Representative immunofluorescent images for oligomeric Tau (T22, red) and endogenous Tau, including untagged Tau (green), in the upper panel. The lower panel shows aggregated Tau, Thioflavin S (ThS, green) and Tau (red). E&F. Immunofluorescent and quantification of TUNEL+ cells demonstrated that cell death by Tau PFF and Aβ was inhibited by ApoE3 or R136S. One-way ANOVA was used for statistical analysis and data are shown as mean ± SEM. n = 5. *p < 0.05, **p < 0.01. Lipoprotein receptor-related protein 1 (LRP1) inhibitor RAP blocks neuronal internalization of Tau fibrils. Primary LC neurons were prepared and treated with Atto-Tau PFFs and lipidated ApoE3 in the presence of vehicle or RAP (500 nM) recombinant proteins, an antagonist of lipoprotein receptor-related protein 1 (LRP1). G. Western blot analysis showed that RAP blocked the uptake of Tau into neurons. H. Representative immunofluorescent images for Atto-Tau PFF (red) and DBH (green). Scale bar = 20 μm. I. Quantification of uptake of Tau PFFs demonstrated that neuronal internalization of Tau PFF was prohibited by RAP. Two-way ANOVA was used for statistical analysis and data are shown as mean ± SEM. n = 5. *p < 0.05, **p < 0.01.
Figure 4.
Figure 4.. ApoE3 R136S promotes uptake of Aβ and decreases secretion of inflammatory factors by microglia.
A. Uptake of the Aβ-ApoE3 complex by HMC3 cells after incubation for 2 h. Atto550-labeled Aβ aggregates was incubated with wild-type and R136S mutant ApoE3, and then added to the medium of HMC3 cells. The images were captured after incubation for 2 h. Scale bar = 200 μm. B. Quantification of HMC3 cells containing atto550-labeled Aβ. C. ELISA analysis of Aβ in HMC3 cells after incubation for 2 h. D. ELISA analysis of Aβ in HMC3 cells after degradation for 18 h. The HMC3 cells after the 2-h phagocytosis were washed with PBS for 3 times, and followed by an 18-h incubation in conditioned medium without serum. Then the cells were harvested at 20 hours for ELISA test. E. Uptake of the Tau-ApoE3 complex by HMC3 cells after incubation for 2 h. Atto550-labeled hTau aggregates was incubated with wild-type and R136S mutant ApoE3, and then was added to the medium of HMC3 cells. The images were captured after incubation for 2 h. Scale bar = 200 μm. F. Quantification of HMC3 cells containing atto550-labeled hTau. G. ELISA analysis of hTau in HMC3 cells after incubation for 2 h. H. ELISA analysis of hTau in HMC3 cells after degradation for 18 h. The HMC3 cells after the 2-h phagocytosis were washed with PBS for 3 times, and followed by an 18-h incubation in conditioned medium without serum. Then the cells were harvested at 20 hours for ELISA test. I. Representative dot blots of neuroinflammatory factors in the conditioned medium after 18-h degradation for treated with Aβ-ApoE3 or Aβ-ApoE3 R136S complex. Cytokine levels were detected using the Proteome Profiler Human Cytokine Array. J. Quantification of expression levels of CCL2, CXCL2, CXCL12, IFN-γ, IL-β, IL-6, IL-8, and TNFα after HMC3 cells were incubated with Aβ-ApoE3 or Aβ-ApoE3 R136S complex. K. Representative dot blots of neuroinflammatory factors in the conditioned medium after 18-h degradation for treated with hTau-ApoE3 or hTau-ApoE3 R136S complex. Cytokine levels were detected using the Proteome Profiler Human Cytokine Array. L. Quantification of expression levels of CCL2, CXCL2, CXCL12, IFN-γ, IL-β, IL-6, IL-8, and TNFα after HMC3 cells were incubated with hTau-ApoE3 or hTau-ApoE3 R136S complex. Two-way ANOVA was performed for the analysis and data are shown as mean ± SEM. n = 4. *p < 0.05.
Figure 5.
Figure 5.. ApoE3 R136S inhibits Aβ/Tau secretion by microglia and ameliorates neuronal toxicity induced by Aβ and Tau.
The conditioned medium without serum after the 18-h incubation from the uptake and degradation experiments (Figure 4) was collected and extracted for extracellular vesicles. A. The secretion of AEP via extracellular vesicles after HMC3 cells were incubated with Aβ-ApoE3 or Aβ-ApoE3 R136S complex. Scale bar = 30 μm. B. The secretion of AEP via extracellular vesicles after HMC3 cells were incubated with Tau-ApoE3 or Tau-ApoE3 R136S complex. Scale bar = 30 μm. C. Western blot showing the levels of Aβ and AEP in extracellular vesicles from HMC3 cells treated with Aβ-ApoE3 or Aβ-ApoE3 R136S complex. D. Western blot showing the levels of pathologic Tau and AEP secreted in extracellular vesicles from HMC3 cells treated with Tau-ApoE3 or Tau-ApoE3 R136S complex. E. Primary neurons were exposed to extracellular vesicles derived from HMC3 cells pretreated with Aβ-ApoE3 or Aβ-ApoE3 R136S complex. The morphology of neurons and the levels of active caspase-3 are shown. Scale bar = 20 μm. F. Primary neurons were exposed to exosomes derived from HMC3 cells pretreated with hTau-ApoE3 or hTau-ApoE3 R136S complex. The morphology of neurons and the levels of active caspase-3 were shown. Scale bar = 20 μm. G & H. Western blots showed the levels of AEP-cleaved Tau and UNC5C, as well as active caspase-3. I & J. AEP activities were quantified in primary neurons treated by Aβ-ApoE3 or Aβ-ApoE3 R136S complex (I), by hTau-ApoE3 or hTau-ApoE3 R136S complex (J). A two-tailed t-test was performed and data are shown as mean ± SEM. n = 3. * P < 0.05.
Figure 6.
Figure 6.. ApoE3 R136S attenuates Tau pathology in Tau P301S mice.
AAV-Control, AAV-ApoE3 WT or AAV-ApoE3 R136S was injected into the hippocampus of three-month-old Tau P301S mice. Cytomegalovirus (CMV) promoter was used in the AAV experiment. The mice were sacrificed 3 months after injection. A. Immunohistochemistry showed the expression of AT100 in the brains of Tau P301S mice injected with AAV-Control, AAV-ApoE3 WT or AAV-ApoE3 R136S. Scale bar = 100 μm. B. Quantitative comparison of AT100 in the brain slides of Tau P301S mice injected with AAV-Control, AAV-ApoE3 WT or AAV-ApoE3 R136S. C. Quantitative comparison of p181-tau levels, measured via ELISA, in TBS and 2% SDS fractions of brain extracts of Tau P301S mice injected with AAV-Control, AAV-ApoE3 WT or AAV-ApoE3 R136S. D & E. Immunofluorescence showing AT8, Iba-1 and NeuN in the hippocampus of Tau P301S mice injected with AAV-Control, AAV-ApoE3 WT or AAV-ApoE3 R136S. Scale bar = 100 μm. Quantitative comparison of AT8, Iba-1 and NeuN was shown in F-H. One-way ANOVA followed by Tukey’s post-hoc test was performed for the analysis and data are shown as mean ± SEM. n = 9 per group. ** p<0.01. I & J. AEP and nSMase2 activity in the mouse hippocampus injected with AAV-Control, AAV-ApoE3 WT or AAV-ApoE3 R136S. K. Western blot showed the levels of ApoE (soluble and insoluble), p-C/EBP β, AEP, AEP-cleaved UNC5C, and active caspase-3 in the mouse hippocampus injected with AAV-ApoE3 WT or AAV-ApoE3 R136S. The cognitive function of above mice was evaluated before sacrifice. L. The latency to mount platforms during the training of the Morris water maze test. M. The percentage of time spent in the target quadrant in the probe test of the Morris water maze. N. The swim speed of mice in the Morris water maze test. O. The percentage of freezing in the contextual fear test of fear conditioning test. P. The percentage of freezing in the cued fear test of fear conditioning test. One-way ANOVA followed by Tukey’s post-hoc test was performed for the analysis and data are shown as mean ± SEM. n = 8 per group. * p<0.05, ** p<0.01.
Figure 7.
Figure 7.. ApoE3 R136S inhibits Tau propagation and LC neurodegeneration in AD mice model.
AAV-control, AAV-ApoE3, and AAV-ApoE3 R136S were injected with/without Tau PFFs into the LC of 3-month-old 5xFAD mice. The mice were assessed for Tau phosphorylation, propagation, and memory dysfunction 3 months after injection. A. Representative images of immunofluorescent staining for Tau AT8 (red), DBH (green), DAPI (blue) in the LC sections. Scale bars = 100 μm. B. Representative images showing colocalization of ApoE (green) and Tau (red) in LC neurons. Scale bars = 20 μm. C & D. Quantification of DBH+ cells (C) and AT8+ cells (D). E & F. The change of Aβ40 (E) and Aβ42 (F) by ApoE3 or ApoE3 R136S was measured by ELISA. One-way ANOVA was used for the analysis and data are shown as mean ± SEM. n = 8 for C & d, n = 5 for E & F. * p<0.05, ** p<0.01. G. Representative images of immunofluorescent staining for Tau AT8 (red), ThS (green), and DAPI (blue) in the LC, entorhinal cortex (EC), and hippocampus (HC) of virus-injected 5xFAD mice. Quantification of AT8+ cells demonstrated that propagation of AT8+ cells was inhibited by ApoE3 R136S. All scale bars = 100 μm. One-way ANOVA was used for the analysis and data are shown as mean ± SEM. n = 5. ** p<0.01. H-L. Morris water maze tests demonstrated alleviated memory dysfunctions by ApoE3 R136S mutation in 5xFAD mice treated by Tau PFFs. Shown are the latency travelled to the platform (H), area under the curve for total time travelled (I), and percent time spent in the quadrant platform during the probe trial (J). K & L. Fear conditioning tests. Shown are the percentage of freezing time during the contextual fear (K) and cued fear (L) tests following fear conditioning. One-way ANOVA was used for the behavior analysis and data are shown as mean ± SEM. n = 8 per group. *P < 0.05, **P < 0.01.

References

    1. Haass C (1996). Presenile because of presenilin: the presenilin genes and early onset Alzheimer’s disease. Curr Opin Neurol 9, 254–259. - PubMed
    1. Parhizkar S, and Holtzman DM (2022). APOE mediated neuroinflammation and neurodegeneration in Alzheimer’s disease. Semin Immunol 59, 101594. 10.1016/j.smim.2022.101594. - DOI - PMC - PubMed
    1. Martens YA, Zhao N, Liu CC, Kanekiyo T, Yang AJ, Goate AM, Holtzman DM, and Bu G (2022). ApoE Cascade Hypothesis in the pathogenesis of Alzheimer’s disease and related dementias. Neuron 110, 1304–1317. 10.1016/j.neuron.2022.03.004. - DOI - PMC - PubMed
    1. Georgiadou D, Chroni A, Vezeridis A, Zannis VI, and Stratikos E (2011). Biophysical analysis of apolipoprotein E3 variants linked with development of type III hyperlipoproteinemia. PLoS One 6, e27037. 10.1371/journal.pone.0027037. - DOI - PMC - PubMed
    1. Arboleda-Velasquez JF, Lopera F, O’Hare M, Delgado-Tirado S, Marino C, Chmielewska N, Saez-Torres KL, Amarnani D, Schultz AP, Sperling RA, et al. (2019). Resistance to autosomal dominant Alzheimer’s disease in an APOE3 Christchurch homozygote: a case report. Nat Med 25, 1680–1683. 10.1038/s41591-019-0611-3. - DOI - PMC - PubMed

LinkOut - more resources