Meta-Analysis
. 2025 Feb 6;188(3):640-652.e9.
doi: 10.1016/j.cell.2024.12.002. Epub 2025 Jan 14.

Trans-ancestry genome-wide study of depression identifies 697 associations implicating cell types and pharmacotherapies

Collaborators
Meta-Analysis

Trans-ancestry genome-wide study of depression identifies 697 associations implicating cell types and pharmacotherapies

Major Depressive Disorder Working Group of the Psychiatric Genomics Consortium. Electronic address: andrew.mcintosh@ed.ac.uk et al. Cell. .

Abstract

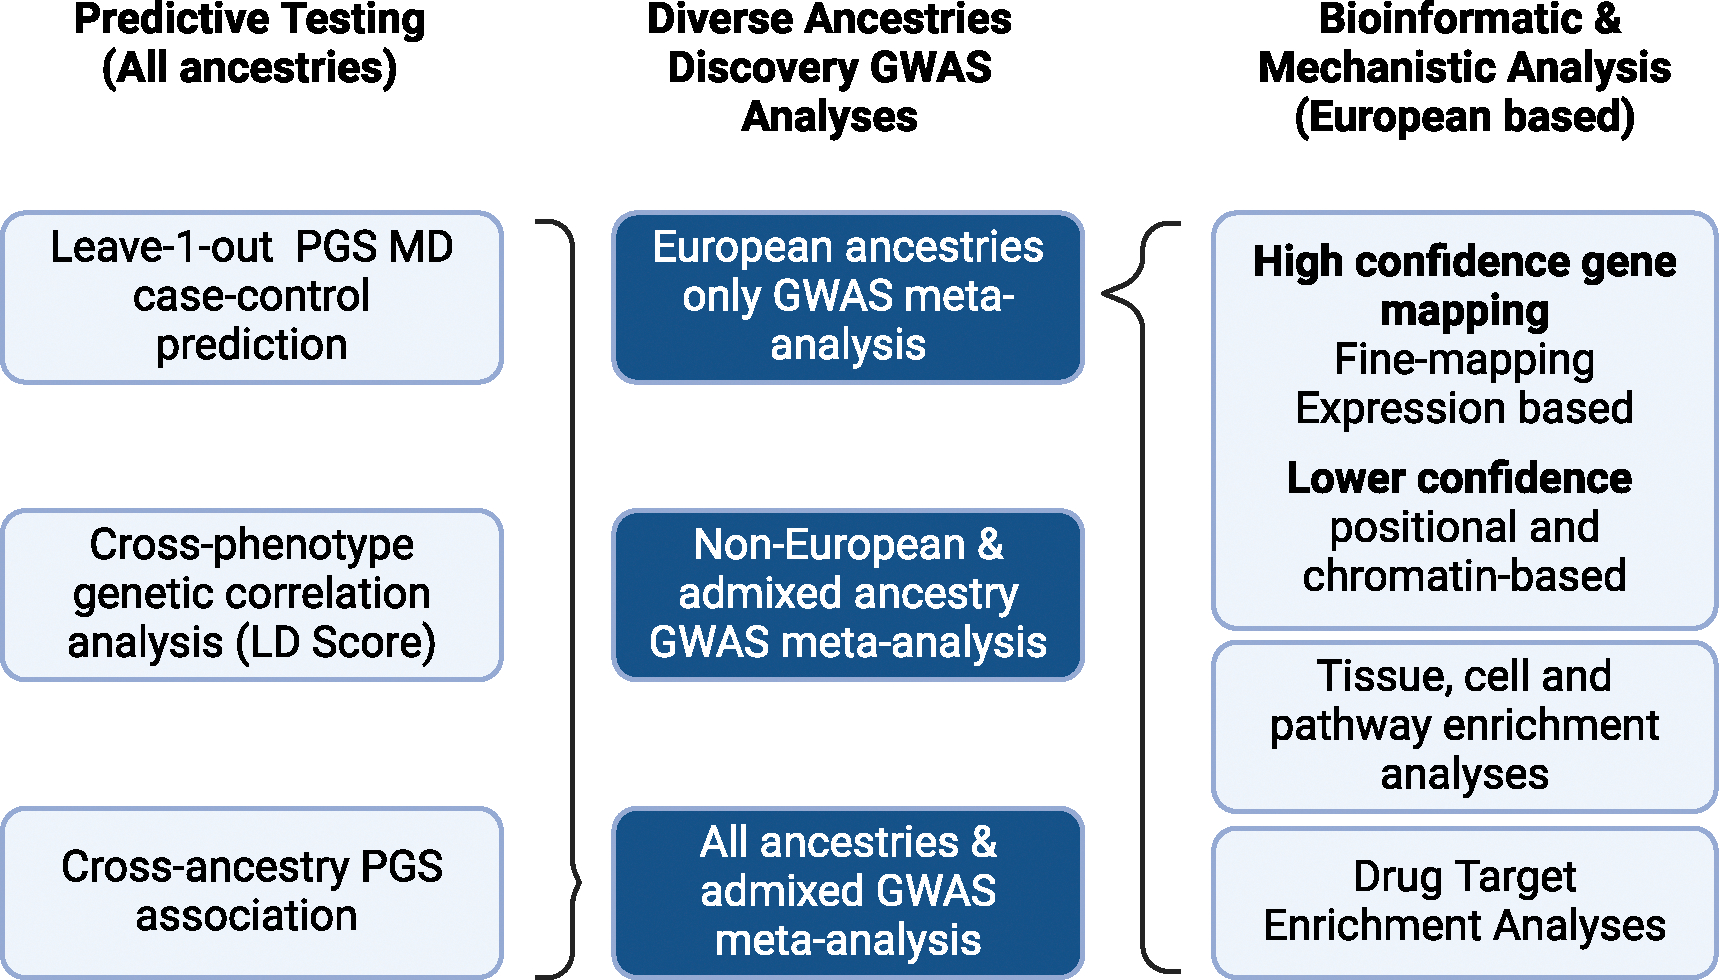
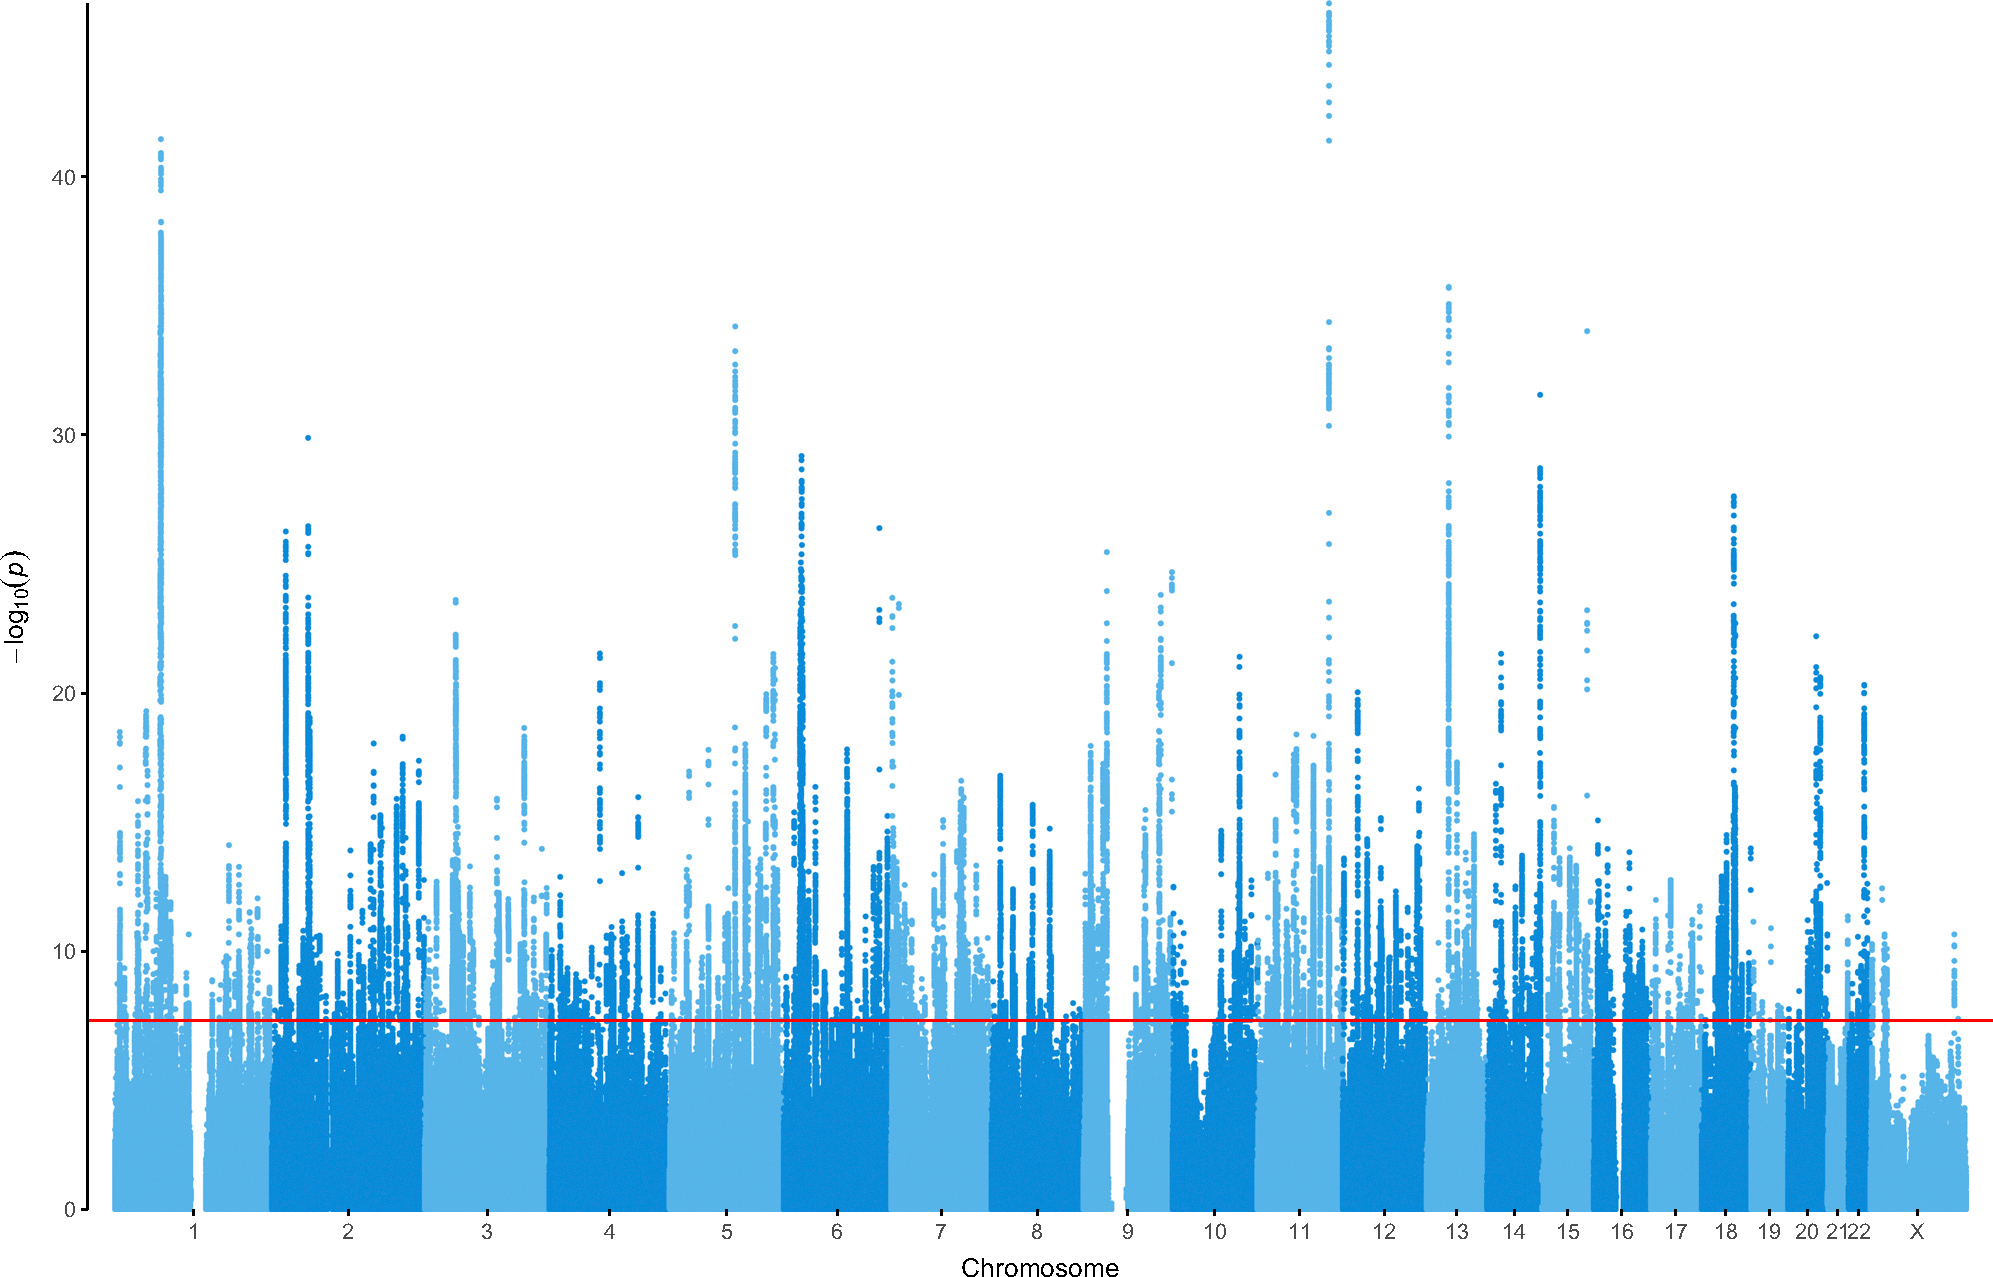
In a genome-wide association study (GWAS) meta-analysis of 688,808 individuals with major depression (MD) and 4,364,225 controls from 29 countries across diverse and admixed ancestries, we identify 697 associations at 635 loci, 293 of which are novel. Using fine-mapping and functional tools, we find 308 high-confidence gene associations and enrichment of postsynaptic density and receptor clustering. A neural cell-type enrichment analysis utilizing single-cell data implicates excitatory, inhibitory, and medium spiny neurons and the involvement of amygdala neurons in both mouse and human single-cell analyses. The associations are enriched for antidepressant targets and provide potential repurposing opportunities. Polygenic scores trained using European or multi-ancestry data predicted MD status across all ancestries, explaining up to 5.8% of MD liability variance in Europeans. These findings advance our global understanding of MD and reveal biological targets that may be used to target and develop pharmacotherapies addressing the unmet need for effective treatment.

Keywords: GWAS; depression; drugs; enrichment; genetic; genome-wide association study; neurons; pharmacotherapies; targets.


Conflict of interest statement

Declaration of interests C.M.L. is a member of the SAB for Myriad Neuroscience and has received consultancy fees from UCB.

Figures

Figure 1.
Figure 1.. Overview of MD GWAS and downstream analyses
Figure shows the 3 meta-analyses conducted (middle, deeper blue). Predictive testing using polygenic risk scores was conducted using both European and all ancestries GWAS summary statistics (left-hand side of the figure). Bioinformatic and mechanistic analyses were conducted using European-only GWAS summary statistics because many of the methods depend on a single suitable linkage equilibrium reference panel, and methods to generalize these approaches to trans-ancestry summary statistics were still in development at the time of submission.
Figure 2.
Figure 2.. Manhattan plot of GWAS meta-analysis of 688,808 MD cases and 4,364,225 controls
Manhattan plot displaying the significance of each SNP’s association with MD across the genome (vertical axis shows −log10 p value). Chromosomal position of each SNP is shown on the horizontal axis. The horizontal line at 7.3 (−log10(5 × 10⁻⁸)) indicates the genome-wide statistical significance threshold.
Figure 3.
Figure 3.. Broad brain cell category enrichment analysis
Cell-type enrichment analysis. 20 categories of brain cell types are listed (from a total of 39 broad brain cell-type categories tested) along the vertical axis, and horizontal bar size represents the significance of the enrichment measured using MAGMA gene set enrichment test or partitioned LDSC. Color encodes results that were significant after false discovery rate correction. Bars in salmon color represent enrichments significant using both methods; green, MAGMA only; blue, partitioned LDSC only; and purple when neither method showed significant enrichment. 19 broad categories not displayed were not significant using either method. Columns represent the results of each test using summary statistics from MDD2013, MDD2018, and this study. The dotted line shows threshold of nominal (uncorrected) statistical significance.
Figure 4.
Figure 4.. MD polygenic score prediction into European ancestry studies
(A) Comparison of liability R2 by input summary statistics by availability (full dataset with 23andMe versus public dataset without 23andMe, using p value clumping + thresholding at p ≤ 0.05 [P+CT]), PGS method (P+CT versus SBayesR), and discovery dataset (previous Howard et al. versus current MDD2024 SBayesR). The R2 are estimated across 42 cohorts with individual-level data. For the discovery panel, the R2 are estimated from the 20 cohorts with individual-level data contributed to the PGC after the Howard et al. study. The rl2 was calculated using a lifetime prevalence of 0.15. (B) Odds ratio by decile, with reference to decile 1, for clinical and community-ascertained studies (SBayesR). Bars reflecting the 95% confidence interval (CI) are based on estimates from the logistic regression.
Figure 5.
Figure 5.. Polygenic prediction of MD status from European and multi-ancestry GWAS into ancestrally diverse non-European studies
Details of cohorts found in Table S1. The rl2 was calculated using a prevalence of 0.15 with the P+CT method. The error bars are confidence intervals calculated using bootstrap. The training data did not include 23andMe because of access limitations. AFR, African ancestry; AMR, Hispanic and Latin American ethnicities; EAS, East Asian ancestries; EUR, European ancestries; SAS, South Asian ancestries.

References

    1. Polderman TJC, Benyamin B, de Leeuw CA, Sullivan PF, van Bochoven A, Visscher PM, and Posthuma D (2015). Meta-analysis of the heritability of human traits based on fifty years of twin studies. Nat. Genet. 47, 702–709. 10.1038/ng.3285. - DOI - PubMed
    1. Howard DM, Adams MJ, Clarke T-K, Hafferty JD, Gibson J, Shirali M, Coleman JRI, Hagenaars SP, Ward J, Wigmore EM, et al. (2019). Genome-wide meta-analysis of depression identifies 102 independent variants and highlights the importance of the prefrontal brain regions. Nat. Neurosci. 22, 343–352. 10.1038/s41593-018-0326-7. - DOI - PMC - PubMed
    1. Major Depressive Disorder Working Group of the Psychiatric GWAS Consortium, Ripke S, Wray NR, Lewis CM, Hamilton SP, Weissman MM, Breen G, Byrne EM, Blackwood DHR, Boomsma DI, et al. (2013). A mega-analysis of genome-wide association studies for major depressive disorder. Mol. Psychiatry 18, 497–511. 10.1038/mp.2012.21. - DOI - PMC - PubMed
    1. Howard DM, Adams MJ, Shirali M, Clarke T-K, Marioni RE, Davies G, Coleman JRI, Alloza C, Shen X, Barbu MC, et al. (2018). Genome-wide association study of depression phenotypes in UK Biobank identifies variants in excitatory synaptic pathways. Nat. Commun. 9, 1470. 10.1038/s41467-018-03819-3. - DOI - PMC - PubMed
    1. Hyde CL, Nagle MW, Tian C, Chen X, Paciga SA, Wendland JR, Tung JY, Hinds DA, Perlis RH, and Winslow AR (2016). Identification of 15 genetic loci associated with risk of major depression in individuals of European descent. Nat. Genet. 48, 1031–1036. 10.1038/ng.3623. - DOI - PMC - PubMed

Publication types

Substances

LinkOut - more resources