. 2025 Jan 15;8(3):e202403066.
doi: 10.26508/lsa.202403066. Print 2025 Mar.

UNC119 regulates T-cell receptor signalling in primary T cells and T acute lymphocytic leukaemia

Affiliations

UNC119 regulates T-cell receptor signalling in primary T cells and T acute lymphocytic leukaemia

Youhani Samarakoon et al. Life Sci Alliance. .

Abstract

T-cell receptor recognition of cognate peptide-MHC leads to the formation of signalling domains and the immunological synapse. Because of the close membrane apposition, there is rapid exclusion of CD45, and therefore LCK activation. Much less is known about whether spatial regulation of the intracellular face dictates LCK activity and TCR signal transduction. Moreover, as LCK is a driver in T acute lymphocytic leukaemia, it is important to understand its regulation. Here, we demonstrate a direct role of the ciliary protein UNC119 in trafficking LCK to the immunological synapse. Inhibiting UNC119 reduces localisation of LCK without impairing LCK phosphorylation and reduces T-cell receptor signal transduction. Although important for initial LCK reorganisation, activated CD8+ T cells retained their ability to kill target tumour cells when UNC119 was inhibited. UNC119 was also needed to sustain proliferation in patient-derived T-ALL cells. UNC119 may therefore represent a novel therapeutic target in T acute lymphocytic leukaemia, which alters the subcellular localisation of LCK in T acute lymphocytic leukaemia cells but preserves the function of existing cytotoxic lymphocytes.


Conflict of interest statement

The authors declare that they have no conflict of interest.

Figures

Figure 1.
Figure 1.. UNC119, ARL3, and ARL13b are broadly expressed in multiple T-cell subsets.
(A) UMAP of human scRNAseq of T cells from reference . (B) T-cell lineage markers as indicated on the right of the UMAP, indicating that clusters 1–8 are T cells. (C) Expression of ciliary UNC119, ARL3, and ARL13b in those T-cell clusters. (D) scRNAseq UMAP of P14 T cells from reference after challenge with lymphocytic choriomeningitis virus (top), and clustering of cells at naïve (d0), peak (d9), and memory (d129) post-challenge (bottom). (E) Markers to identify cell phenotype based on Il7r, Klrg1, and Gzmb expression. (F) Arl3, Arl13b, and Unc119 expression in clusters 1–6.
Figure 2.
Figure 2.. Primary CD8+ T cells express Unc119 at the protein level, which regulates LCK localisation at the steady state and during activation of the TCR.
(A) Western blot analysis of the OTI T whole-cell lysate, showing the expression of Arl (top), Arl13b (middle), and Unc119 (bottom). Western blots were done separately, and each was blotted with an internal loading control: either LCK, vinculin, or GAPDH. (B, C) Confocal imaging of in vitro–formed immune conjugates between OTI T cells and EG.7 lymphoma cells showing the subcellular localisation of Arl3 (red) and F-actin (grey) to visualise the cell borders (B) and Unc119 (green) (C). Representative imaging of immune conjugates from two independent experiments, with OTI T cells isolated from n = 2 OTI mice. (D) Structure of an LCK peptide (PDB: 6H6A) overlayed with the UNC119i structure highlights binding to the same hydrophobic pocket (grey, indicated by text) of UNC119. N-myristoylated LCK peptide is shown in purple stick representation and UNC119i in yellow stick representation. Cross section of UNC119 is shown in green in cartoon and surface form. (E) Confocal imaging of endogenous LCK (magenta) in CD8+ T cells at the steady state with either vehicle (DMSO) or 5 μm Unc119i treatment. Representative images are from three independent experiments. (F, G) Quantifications of total intensity in vehicle- and Unc119i-treated CD8+ T cells (F), and quantification of membrane to cytosol redistribution of LCK, which was calculated by subtracting LCK intensity at the cell border from LCK intensity of the whole cell. Each dot on the graph represents an individual cell pooled from three individual experiments. (H) Graphical representation of how polarisation of LCK to the immune synapse was calculated. This was done using an ImageJ plugin called Synapse, referenced in the main text. (I, J, K, L) Confocal imaging of in vitro–formed immune conjugates was visualised for endogenous total LCK (red) and pLCK Y394 (green) with vehicle or 5 μm Unc119i treatment, shown on the left of both panels. Intensity projections on the right of both panels show intensity of LCK and pLCK at the IS and the rest of the T-cell membrane. Representative images are from three independent experiments of OTI T cells expanded from n = 3 OTI mice. (J, M) Quantification of LCK (J) and pLCK (M) through a section of a CD8+ T cell with vehicle or Unc119i treatment showing the redistribution of both from IS to non-IS regions of the membrane. Representative quantifications are from three independent experiments of OTI T cells expanded from n = 3 OTI mice. (K, N) Localisation ratio of LCK and pLCK to the IS with vehicle (black dots) and Unc119i (red dots) treatment. Representative quantifications are from three independent experiments of OTI T cells expanded from n = 3 OTI mice, each dot representing an IS. All scale bars on confocal images represent 5 μm. All error bars represent the standard error of the mean. (K, L, M, N) Statistical significance on (K, L, M, N) was determined by the Mann–Whitney test. Source data are available for this figure.
Figure S1.
Figure S1.. Structure of UNC119 bound to the UNC119 inhibitor, squarunkin A.
UNC119 was purified as previously described reference . Before sparse matrix screening, the protein was incubated with a twofold molar excess of squarunkin. (A) Structure of UNC119 inhibitor, Squarunkin A. Crystals were obtained in the JBS Kinase screen in a condition containing 30% wt/vol PEG3350, 100 mM Sodium acetate, pH 4.6, and 200 mM ammonium acetate. Data processing was performed using the Xia2 pipeline. Molecular replacement was performed using Phaser (58) with a single chain from PDB: 6H6A (20) as a search model. Refinement was performed using REFMAC5 (52) and COOT (53) of the CCP4 program suite (54). Squarunkin library dictionary was performed using eLBOW from Phenix.refine (55). (B) Schematic showing key amino acid interactions between UNC119 and squarunkin A.
Figure 3.
Figure 3.. Inhibition of Unc119 dampens CD8+ T-cell effector functions.
(A) Flow cytometric quantification of in vitro–formed immune conjugates with vehicle- or Unc119i-treated OTI T cells. Quantifications are from two independent experiments. (B) Quantification of flow cytometry–based killing assay to assess the cytotoxic capacity of vehicle (DMSO)- and Unc119i-treated OTI T cells showing the percentage of dead target cells. Quantifications are from three independent experiments, each dot representing a technical replicate acquired after OTI T cells were isolated in vitro and plated individually in coculture with EG.7 target cells. (C) Schematic of an experiment to assess how Unc119i affects CD8+ T-cell effector functions. (D, E, F, G, H, I) Graphs showing the median fluorescence intensity of pLCK Y394, pZAP70 Y319, pERK, CD25, CD69, CD44, CD62L, and IFNγ, respectively, in CD8+ T cells after vehicle or Unc119i treatment. Data shown are from four to six independent experiments, each data point representing OTI cells isolated from one mouse. (J, K) CD62L and IFNγ median fluorescence intensity of OTI T cells activated in the presence of DMSO or UNC119i. Each dot represents technical replicates from two independent experiments. Statistical significance was determined by a paired t test. (L) Fold change in proliferation of CD8+ T cells with vehicle, Unc119i, or LCKi treatment. Each data point represents one biological replicate. Statistical significance was determined by one-way ANOVA. (M) Confocal imaging of intracellular IL-2 in CD8+ T cells with vehicle of Unc119i treatment. Representative images are from two independent experiments, each data point representing a cell. The scale bar represents 5 μm. (M, N) Quantification of IL-2 intensities shown in (M) done on ImageJ. All error bars represent the standard error of the mean.
Figure S2.
Figure S2.. Representative flow cytometry gating of phosphorylated LCK– and phosphorylated ZAP70–positive CD8α T cells with various drug treatments.
UNC119 inhibition reduces the activating phosphorylation of ZAP70 but not LCK. (A, B, C) Plots showing pLCK-positive CD8 T cells with either vehicle, UNC119 inhibitor, or LCK inhibitor (MedChemExpress–HY12072) treatment, respectively. (D, E, F) Plots showing p-ZAP70-positive CD8 T cells with either vehicle, UNC119 inhibitor, or LCK inhibitor treatment, respectively. All plots show p-kinase populations after pregating on all CD8α+ T cells. Cell cultures were expanded in the presence of either 5 μm UNC119 inhibitor or 2 μm LCK inhibitor for 24 h.
Figure S3.
Figure S3.. Representative flow cytometry gating of OTI TCR T-cell cultures and staining for T-cell kinases, activation markers, and cytokines.
(A) Gating done for CD8α+ T cells. (B) All plots show populations after pregating on all CD8α+ T cells and show staining for phosphorylated ERK, IFNγ, CD69, CD44, CD25, and CD62L. Cell cultures were expanded in the presence of either 5 μm UNC119 inhibitor or 2 μm LCK inhibitor for 48 h.
Figure S4.
Figure S4.. CD8α+ T-cell activation decreases with LCK inhibition.
OTI TCR T cells were cultured in the presence of 2 μm LCK inhibitor for 48 h. Activation markers were detected by flow cytometric analysis. (A, B, C, D, E, F, G, H) MFI of pLCK, pZAP70, pERK, CD25, CD69, CD44, CD62L, and IFNγ, respectively, on CD8α+ T cells. Each dot represents one biological replicate, and all error bars represent the standard error of the mean. Statistical significance was determined by a paired t test.
Figure 4.
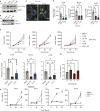
Figure 4.. UNC119 inhibition reduces proliferation in T-ALL cell lines and PDX samples.
(A) Western blot showing the expression of pLCK Y394 in healthy CD8+ T cells (OTI) compared with Jurkat, MOLT4, and CCRF T-ALL cell lines relative to cofilin as a loading control. (B) Western blot showing the expression of UNC119 in Jurkat, MOLT4, and CCRF cell lines relative to actin as the internal loading control. (C) Confocal imaging of endogenous pLCK in T-ALL cells treated with either DMSO or Unc119i. White arrows on images indicate intracellular LCK stores. Representative images are from two independent experiments. Scale bars represent 5 μm. (D) Graphs showing the median fluorescence intensity of pZAP70 Y319 in human T-ALL cell lines with either DMSO, 5 μm Unc119i, or 2 μm LCKi (MedChemExpress—HY12072). Data shown are from two independent experiments, where each dot represents technical replicates from two experiments. Statistical significance was determined with one-way ANOVA on Prism GraphPad. (E) Proliferation curves of Jurkat, MOLT4, and CCRF cells with increasing concentrations of Unc119i and a fixed concentration of LCKi at 2 μm. Each condition and time point was plated in triplicate, each data point representing the average of three technical replicates. Error bars represent the standard error of the mean. One dose–response experiment was conducted per T-ALL cell line. (F) Graphs showing the fold change in proliferation at endpoint of the same three human T-ALL cell lines. Four independent experiments were conducted. Each condition was plated in triplicate, and fold change was calculated by dividing the average cell concentration at 96 h by that at 0 h. Statistical significance was determined with one-way ANOVA on Prism GraphPad. (G) Graph showing the percentage of Annexin V+ Zombie NIR+ apoptotic T-ALL cells with increasing concentrations of Unc119 inhibitor. (H) Proliferation curves of four different PDX-derived human T-ALL cells in response to Unc119i and LCKi treatments. Each dot is the average of triplicate plating for each PDX sample. All error bars represent the standard error of the mean. Source data are available for this figure.
Figure S5.
Figure S5.. Quantification of Western blots from Figs 4 and 5.
(A) Quantification of Western blot band intensities normalised to loading control from Fig 4A. (B) Quantification of Western blot band intensities normalised to loading control from Fig 4B. (C) Quantification of Western blot band intensities normalised to loading control from Fig 5A.
Figure 5.
Figure 5.. Genetic depletion of UNC119 in human T-ALL cell lines phenocopies defective proliferation.
(A) Western blot showing depletion of UNC119 in CCRF cells that were engineered to express a doxycycline-inducible gRNA targeting UNC119, at two different time points post-doxycycline treatment. GAPDH was the internal loading control. (B) Growth curve of UNC119 WT and KO (CCRFUnc119 gRNA + DOX) cells over time. Data are representative of two independent experiments; each dot on the graph shows an average of three technical replicates plated per condition. (C) Graph showing fold change in proliferation of modified CCRF cells. Data are representative of two independent experiments where the graph shows three technical replicates from one representative experiment. (D) Percentage of Ki-67+ CCRF cells that are either sufficient or deficient for UNC119 as quantified by flow cytometry. (E, F) MFI of total LCK and pLCK Y394, respectively, in UNC119-sufficient (Dox+ UNC119 gRNA+) and UNC119-deficient CCRF cells (all other conditions). Data are representative of two independent experiments. All error bars represent the standard error of the mean. Statistical significance was determined using one-way ANOVA on Prism GraphPad. Source data are available for this figure.

Similar articles

References

    1. Hwang JR, Byeon Y, Kim D, Park SG (2020) Recent insights of T cell receptor-mediated signaling pathways for T cell activation and development. Exp Mol Med 52: 750–761. 10.1038/s12276-020-0435-8 - DOI - PMC - PubMed
    1. Courtney AH, Lo W-L, Weiss A (2018) TCR signaling: Mechanisms of initiation and propagation. Trends Biochem Sci 43: 108–123. 10.1016/j.tibs.2017.11.008 - DOI - PMC - PubMed
    1. Huse M, Klein LO, Girvin AT, Faraj JM, Li Q-J, Kuhns MS, Davis MM (2007) Spatial and temporal dynamics of T cell receptor signaling with a photoactivatable agonist. Immunity 27: 76–88. 10.1016/j.immuni.2007.05.017 - DOI - PubMed
    1. Chan AC, Desai DM, Weiss A (1994) The role of protein tyrosine kinases and protein tyrosine phosphatases in T cell antigen receptor signal transduction. Annu Rev Immunol 12: 555–592. 10.1146/annurev.iy.12.040194.003011 - DOI - PubMed
    1. Williams BL, Schreiber KL, Zhang W, Wange RL, Samelson LE, Leibson PJ, Abraham RT (1998) Genetic evidence for differential coupling of syk family kinases to the T-cell receptor: Reconstitution studies in a ZAP-70-deficient Jurkat T-cell line. Mol Cell Biol 18: 1388–1399. 10.1128/MCB.18.3.1388 - DOI - PMC - PubMed

MeSH terms

Substances

LinkOut - more resources