. 2025 Jan 15;16(1):709.
doi: 10.1038/s41467-025-56128-x.

The Toxoplasma rhoptry protein ROP55 is a major virulence factor that prevents lytic host cell death

Affiliations

The Toxoplasma rhoptry protein ROP55 is a major virulence factor that prevents lytic host cell death

Margarida T Grilo Ruivo et al. Nat Commun. .

Abstract

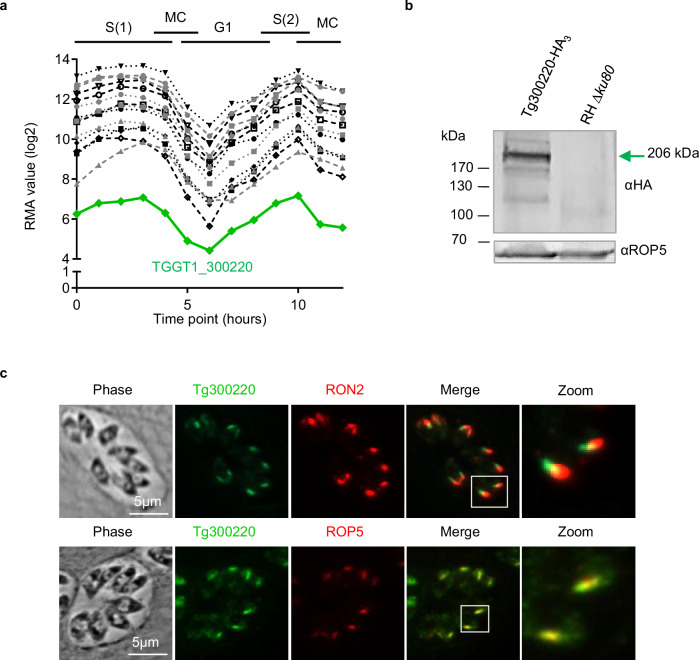
Programmed-cell death is an antimicrobial defense mechanism that promotes clearance of intracellular pathogens. Toxoplasma counteracts host immune defenses by secreting effector proteins into host cells; however, how the parasite evades lytic cell death and the effectors involved remain poorly characterized. We identified ROP55, a rhoptry protein that promotes parasite survival by preventing lytic cell death in absence of IFN-γ stimulation. RNA-Seq analysis revealed that ROP55 acts as a repressor of host pro-inflammatory responses. In THP-1 monocytes ΔROP55 infection increased NF-κB p65 nuclear translocation, IL-1β production, and GSDMD cleavage compared to wild type or complemented parasites. ΔROP55 infection also induced RIPK3-dependent necroptosis in human and mouse primary macrophages. Moreover, ΔROP55 parasites were significantly impaired in virulence in female mice and prevented NF-κB activation and parasite clearance in mBMDM. These findings place ROP55 as a major virulence factor, dampening lytic cell death and enabling Toxoplasma to evade clearance from infected cells.


Conflict of interest statement

Competing interests: The authors declare no competing interests.

Figures

Fig. 1
Fig. 1. ROP55 is a new rhoptry bulb protein.
a Expression pattern of known rhoptry proteins and TGGT1_300220 in green during the tachyzoite cell cycle. Data obtained from ToxoDB (Behnke et al. 2010). b Immunoblot of lysates from parental (RH Δku80) and Tg300220-HA3 lines using anti-HA antibodies. ROP55 migrates at the expected size of 206 kDa. Loading control using anti-ROP5 antibodies. n = 4 experiments (c) Colocalization of TGGT1_300220-HA3 (Tg300220) (green) with rhoptry neck RON2 or rhoptry bulb ROP5 (red). Inset: higher magnification. n = 6 experiments. Source data are provided as a Source Data file.
Fig. 2
Fig. 2. ROP55 is dispensable for the completion of the lytic cycle in vitro and is essential for virulence in mice.
a Western blot showing the absence of ROP55 in the ΔROP55 line and its re-expression in complemented strain (Compl). ROP55 was detected with an αHA antibody. n = 4 experiments. b Absence of ROP55 in ΔROP55 strain and correct localization of ROP55 (red) at the bulb of the rhoptries in the complemented strain. ROP5 (green), n = 4 experiments. c, d Plaque assay of RH Δku80 parental line (WT), ΔROP55 and complemented (compl.) lines on HFF monolayers after 6 days. Values are normalised relative to the percentage of lysis in the control strain and reported as mean ± SEM. c Lysis plaque areas of one representative experiment showing 3 technical replicates. Replicated experiments are shown in Supplementary Fig 2g, h. d Number of lysis plaques showing 3 independent experiments each having 3 technical replicates. e BALB/c mice were intraperitoneally infected with 100 tachyzoites of the WT and the complemented strains (5 mice per condition, n = 3), or with increasing doses of 104 tachyzoites (5 mice, n = 3), 105 tachyzoites (5 mice, n = 2) or 106 tachyzoites (10 mice, n = 1) of ΔROP55 knock-out parasites. Survival curves were compared using two-sided Log-rank (Mantel-Cox) test, p < 0,0001 for WT versus 106 ΔROP55 infected mice (f) Expression of TgSAG1 measured by qRT-PCR in spleens of BALB/c mice 4 days after infection. Representative graph of 3 independent experiments. Bars represent means ± SEM of three to five animals in each group. Replicated experiments are shown in Supplementary Fig. 2j, k. Statistical significance was determined using one-way ANOVA followed by Tukey’s post hoc test for (c). d, f Source data are provided as a Source Data file.
Fig. 3
Fig. 3. Absence of ROP55 induces cell death, resulting in decreased parasite burden.
a Percentage of invaded HFFs quantified after 5 min of invasion. Values are normalized relative to the percentage of cells invaded by the control strain and are reported as mean ± SEM (n = 6 biological replicates, each with 3 technical replicates). b Number of parasites per vacuole at 24 hpi. Plotted are the mean values of 6 independent experiments and bars represent SEM. c Percentage of egress events following A23187 treatment at 30 hpi. 200 vacuoles were counted per coverslip. Values are reported as mean ± SEM (n = 3 biological replicates, each with 3 technical replicates). d Parasite burden measured by qRT-PCR in HFFs infected for 24 hpi. One representative experiment out of 3 is plotted, replicated experiments are shown in Supplementary Fig. 3a, b. Bars represent mean ± SEM (n = 3 technical replicates). e Number of vacuoles per field in infected HFFs. Representative graph of 2 independent experiments with 2 technical replicates counting 48 microscopic fields in WT, 52 in ΔROP55 and 36 in complemented infected cells at 4hpi and 50 microscopic fields in WT, 49 in ΔROP55 and 40 in complemented infected cells at 24hpi. Values are absolute numbers. Replicated experiment is shown in Supplementary Fig. 3c. f Percentage of HFF nuclei staining positive for propidium iodide (PI) per field at 6 hpi. Graph showing one independent experiment counting 35 microscopic fields for WT and ΔROP55, and 20 microscopic fields for compl. coverslips, replicated independent experiment is shown in Supplementary Fig. 3f. g Quantification of LDH released into the medium of HFFs infected for 6 or 24 h. Representative graph of 3 independent experiments. Values were normalized to 100% of lysis control (with addition of supplier lysis buffer) and are reported as mean ± SEM (n = 3 technical replicates). Replicated experiments are shown in Supplementary Fig. 3g, h. Statistical significance was determined using a two-tailed paired t test for (a, c), one-way ANOVA for (d, f) and two-way ANOVA (b, g). followed by Tukey’s pos-hoc test. Source data are provided as a Source Data file.
Fig. 4
Fig. 4. ΔROP55 infected fibroblasts display a pro-inflammatory transcriptomic profile.
a Heatmap of HFFs infected with RH ∆ku80 parental strain (WT), ΔROP55 or complemented (compl.) strains for 6 h, or left non-infected (NI). b Volcano plot highlighting in black the genes that passed the cut off of a differential expression higher than a log2 fold change of 2 and an adjusted p value lower than 0.05. Genes labeled in red are amongst the top 25 DEGs. c Bar plot representing selected list of biological processes enriched after gene ontology (GO) analysis for the upregulated genes with an adjusted p value lower than 0.05. The number of genes in each category is indicated after the bars, and the scale shows the weighted Fisher p value. d IPA analysis representing top upstream regulators of the overexpressed DEGs. Numbers after the bars indicate the activation z-score and the scale shows the Benjamini-Hochberg (BH) corrected p value. All data represents analysis at 6 hpi. Statistical test used for data analysis were for (b). Two-sided Wald test using DESeq2; BH-adjusted p < 0.05 and |log2FoldChange | > 2, (c) Two-sided Fisher’s exact test and weight01 algorithm using topGO; BH-adjusted p < 0.05, and for (d). Two-sided Fisher’s exact test and Z-score algorithm using IPA; BH-adjusted p < 0.05 and |Z-score | >2.
Fig. 5
Fig. 5. ROP55 acts as a negative regulator of the NF-κB/IL-1β pathway.
a Expression of IL1B measured by qRT-PCR in HFFs infected for 6 h and 24 h or non-infected cells (NI). Representative graph from 3 independent experiments. Values are reported as mean ± SEM (n = 3 technical replicates), replicated experiments are shown in Supplementary Fig. 5a–d. b IL-1β secretion from HFFs infected for 6 or 24 h measured by ELISA. Values are reported as mean ± SEM (n = 3 independent biological replicates). c Representative immunofluorescence image of NF-κB p65 subunit nuclear translocation (red) in HFFs infected for 2 h with the indicated strains. Intracellular parasites are staining with anti-SAG1 antibody (green), nuclei are staining with DAPI (blue). Quantification of p65 nuclear signal intensity in HFFs infected for 2 (d) and 6hpi (e). Horizontal line represents the mean fluorescence of p65 staining in cells infected with the WT strain. (d) n = 210 nuclei in WT infected cells, 227 in ΔROP55, 227 in complemented and 205 in Pru. (e) nuclei n = 204 in WT infected cells 217 in ΔROP55, 194 in complemented and 228 in Pru. Representative violin plots from 2 independent experiments, replicated experiments are shown in Supplementary Fig. 5f, g. f Immunofluorescence image of GFP expression in HEK 293 NF-κB reporter cells, infected for 24 h with the indicated strains. Intracellular parasites are stained with anti-GAP45 antibody (red), nuclei are staining with DAPI (blue). Scale bar represents 10 µm. Quantification of GFP intensity of HEK 293 NF-κB reporter cells infected for 6 h (g) or 24 h (h) with the indicated strains. Horizontal line represents the mean GFP fluorescence of cells infected with the WT strain. (g) n = 426 nuclei in WT, 408 in ΔROP55, 403 in complemented and 406 in Pru infected cells. h nuclei n = 394 in WT, 396 in ΔROP55, 408 in complemented and 398 in Pru infected cells. Representative graphs of 2 independent experiments. Replicated experiments are shown in Supplementary Fig. 5h. Statistical significance was determined using a two-way ANOVA followed by Tukey’s post hoc test. Source data are provided as a Source Data file.
Fig. 6
Fig. 6. ROP55 prevents the lytic death of primary murine phagocytes.
a Quantification of LDH released into the medium of mBMDM at 2, 6 or 24 hpi. Representative graph of 2 independent experiments. Values were normalized to 100% of lysis control and are reported as mean ± SEM of 3 technical replicates. Replicated experiments are shown in Supplementary Fig. 6a. b Expression of TgGADPH in mBMDM at 3, 6 or 24 hpi measured by qRT-PCR. Representative graph of 4 independent experiments. Bars represent means ± SEM of three technical replicates. Replicated experiments are shown in Supplementary Fig. 6b, c, d. c Percentage of invaded mBMDM quantified after 1 h. Values are normalized relative to the percentage of cells invaded by the control strain and are reported as mean ± SEM of 3 technical replicates. Representative graph of 2 independent experiments. Replicated experiments are shown in Supplementary Fig. 6e. Quantification of p65 nuclear signal intensity in mBMDMs infected for 2 h (d) and 6 h. (e). Representative violin plots from 2 independent experiments quantifying in (d) 310 nuclei for WT and 336 for ΔROP55 infected BMDM, and in (e) n = 221 nuclei for WT and 201 for ΔROP55. Horizontal line represents the mean fluorescence of p65 staining in cells infected with the WT strain. Replicated experiments are shown in Supplementary Fig. 6f, g. Statistical significance was determined using one-way ANOVA for (c, d, e) and two-way ANOVA for (a, b). followed by Tukey’s post hoc test. Source data are provided as a Source Data file.
Fig. 7
Fig. 7. In THP-1 monocytes, ROP55 prevents NF-κB signaling and downstream inflammatory cell death.
a LDH released into the medium of THP-1 cells at 2 or 6 hpi or non-infected cells (NI). Representative graph of 3 independent experiments. Values normalized against 100% of lysis control showing means ± SEM of three technical replicates. Replicated experiments shown in Supplementary Fig. 7a, b. b TgSAG1 levels measured by qPCR in THP-1 at 2 and 24hpi. Bars represent means ± SEM of three technical replicates. Replicated experiments shown in Supplementary Fig. 7c, d. c Immunofluorescence assay showing NF-κB p65 nuclear translocation (red) in THP-1 infected for 2 h with WT, ΔROP55 and complemented parasites stained with anti-SAG1 antibody (green). Nuclei are labeled with DAPI (blue). d Quantification of p65 nuclear intensity in THP-1 from (c) counting 119 nuclei per condition. Representative violin plot from 2 independent experiments. Replicated experiment is shown in Supplementary Fig. 7f. e WB of IκBα levels in THP-1 lysates 16 hpi or non-infected (NI). f Densitometry quantification of IκBα bands observed in (c). Arbitrary units obtained after normalization to the βactin signal of each corresponding line. Pool of 3 independent experiments. g Expression of hIL1B in THP-1 at 2 and 6 hpi measured by qRT-PCR. Representative graph of 3 independent experiments. Bars represent means ± SEM of three technical replicates. Replicated experiments shown in Supplementary Fig. 7g, h. h ELISA measuring IL-1β secretion from supernatants of THP-1 after 2 and 6 hpi. Pooled results of 3 independent experiments. Bars represent means ± SEM of three biological replicates. i WB analysis mature (IL-1β) and immature (pro-IL-1β) forms of IL-1β present in cell lysates (cells) or supernatants of THP-1 cells infected for 6 h or left non-infected (NI). As a control, THP-1 were stimulated with LPS for 6 h, and ATP was added the last 30 min before harvesting. Loading control: human HSC70, representative result of three independent experiments. Statistical significance was determined using one-way ANOVA for (d, f) and two-way ANOVA (a, b, g, h). followed by Tukey’s or Sidak’s (b) post hoc test. Source data are provided as a Source Data file.
Fig. 8
Fig. 8. Activation of NLRP3 inflammasome and pyroptotic cell death in the absence of ROP55.
a Expression of NLRP3 measured by qRT-PCR in THP-1 cells infected for 2 and 6 h or non-infected cells (NI). Representative graphs of 3 independent experiments. Bars represent means ± SEM of three technical replicates. Replicated experiments are shown in Supplementary Fig. 8a, b. b Quantification by ELISA of IL-1β secreted in the culture supernatants of THP-1 cells pretreated with 5 µM MCC950 or DMSO 40 min before infection with the corresponding strains or left non-infected (NI). Pooled results of 2 independent experiments each one including 3 technical replicates. Bars represent means. c Quantification by ELISA of IL-1β secreted in the media of Δcaspase1 THP-1 cells (ΔCASP1) at 2hpi with the respective strains. Pooled results of 3 independent experiments. Bars represent means ± SEM three biological replicates, each with 2 technical replicates. d Western blot showing the full length-GSDMD (FL-GSDMD) and N-term-GSDMD (N-GSDMD) forms of gasdermin D in the cell lysates of THP-1 cells infected for 14 h with the respective strains. β-actin was used as loading control n = 4 experiments. e LDH released of Δcaspase1 THP-1 cells (ΔCASP1) 2hpi with the respective strains. Values represent means ± SEM of three technical replicates from one representative experiment. Replicated experiment in Supplementary Fig. 8d. f Fold change increase in PI positive cells after infection with the respective strains. Values of infected THP-1 WT and ΔGSDMD THP-1 cells (ΔGSDMD) were normalized to non-infected cells. Values are reported as mean ± SEM of 4 biological replicates. Statistical significance was determined using two-way ANOVA for (a, c, f), and one-way ANOVA for (e) followed by Tukey’s or Sidak post hoc for (c, f). Source data are provided as a Source Data file.
Fig. 9
Fig. 9. Necroptosis inhibition restores the viability of cells infected with ΔROP55 parasites.
a Percentage of Caspase 3/7 positive THP-1 cells infected for 2 or non-infected cells (NI), Staurosporine (Stau). Pooled results of 4 independent experiments. Bars represent means ± SEM. b Western blot showing the full length-GSDME (FL-GSDME) 55 kDa and N-term-GSDME (N-GSDME) 30 kDa forms in the cell lysates of THP-1 16hpi. β-actin as loading control. NS: nonspecific band at 25 kDa. One representative gel of 3 independent experiments, (quantification in Supplementary Fig. 8d). c Fold change in PI positive cells after infection with the respective strains. Values of infected THP-1 WT and ΔGSDME THP-1 cells (ΔGSDME) were normalized to non-infected cells and are reported as mean ± SEM of 3 biological replicates. LDH released of THP-1 cells pretreated with 40 µM Nec1, 5 µM GSK872, 40 µM Necrosulfonamide or DMSO 45 min before 2 hpi (d) or 6 hpi (e) with the corresponding strains or left non-infected (NI). Representative graph of 3 independent experiments. Values were normalized against 100% of lysis control and represent means ± SEM of three technical replicates. Replicated experiments are shown in Supplementary Fig. 9a–d. f Western blot of THP-1 WT (left side lines) and ΔCASP1 THP-1(right side lines) cell lysates 14 hpi showing full length pro-caspase8 (FL) and p43/41 and p18 subunits after TNFα and ciclohexamide (CHX) treatment. One representative of 3 independent experiments. g Fold change in PI positive hMDM 18hpi with the respective strains. Data were normalized to non-infected cells. hMDM were pretreated or not with 10 µM necrosulfonamide 40 min before infection. Values are reported as mean ± SEM of 3 biological replicates using primary hMDM from two different donors. Statistical significance was determined using one-way ANOVA for (a) and two-way ANOVA (c, d, e, g) or Sidak post hoc for (b, g). Source data are provided as a Source Data file.

Similar articles

References

    1. Flegr, J., Prandota, J., Sovičková, M. & Israili, Z. H. Toxoplasmosis–a global threat. Correlation of latent toxoplasmosis with specific disease burden in a set of 88 countries. PloS One9, e90203 (2014). - PMC - PubMed
    1. Pappas, G., Roussos, N. & Falagas, M. E. Toxoplasmosis snapshots: global status of Toxoplasma gondii seroprevalence and implications for pregnancy and congenital toxoplasmosis. Int. J. Parasitol.39, 1385–1394 (2009). - PubMed
    1. Montoya, J. G. & Liesenfeld, O. Toxoplasmosis. Lancet (Lond., Engl.)363, 1965–1976 (2004). - PubMed
    1. Demar, M. et al. Fatal outbreak of human toxoplasmosis along the Maroni River: epidemiological, clinical, and parasitological aspects. Clin. Infect. Dis.: Off. Publ. Infect. Dis. Soc. Am.45, e88–e95 (2007). - PubMed
    1. Blaizot, R. et al. Outbreak of amazonian toxoplasmosis: A one health investigation in a remote amerindian community. Front Cell Infect. Microbiol10, 401 (2020). - PMC - PubMed

MeSH terms