. 2025 Jan 15;16(1):699.
doi: 10.1038/s41467-025-56097-1.

Microglial NLRP3-gasdermin D activation impairs blood-brain barrier integrity through interleukin-1β-independent neutrophil chemotaxis upon peripheral inflammation in mice

Affiliations

Microglial NLRP3-gasdermin D activation impairs blood-brain barrier integrity through interleukin-1β-independent neutrophil chemotaxis upon peripheral inflammation in mice

Sung-Hyun Yoon et al. Nat Commun. .

Abstract

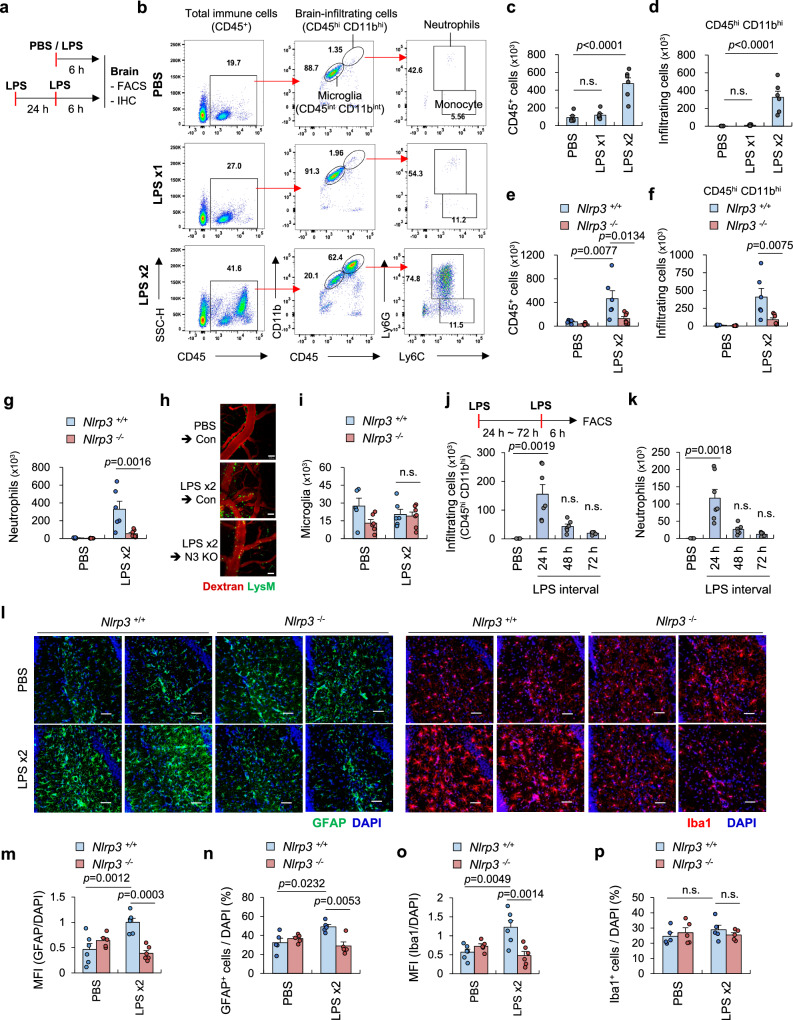
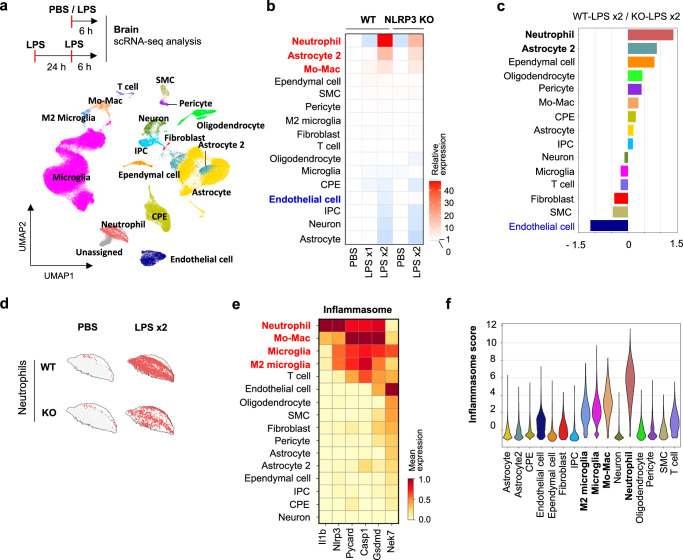
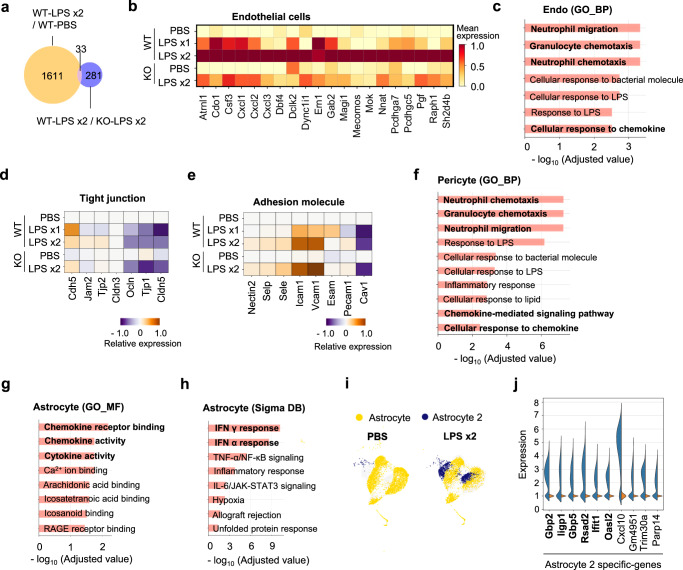
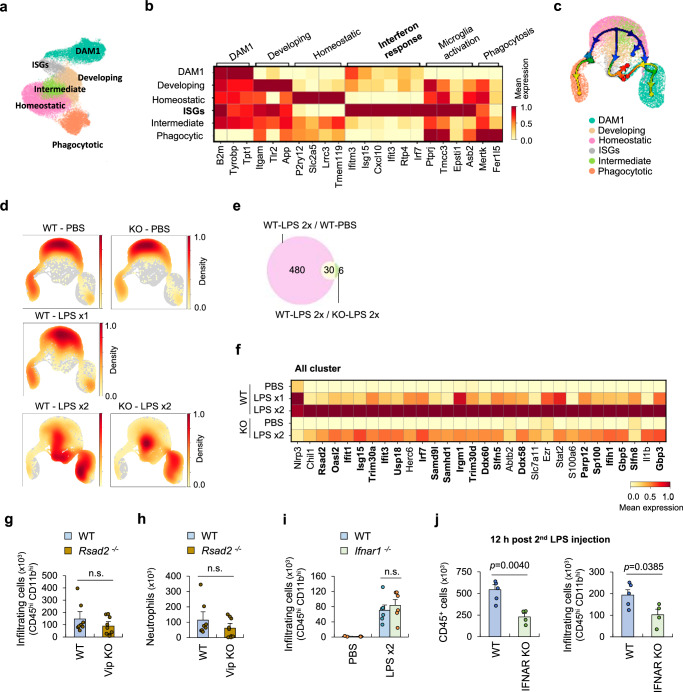
Blood-brain barrier (BBB) disintegration is a key contributor to neuroinflammation; however, the biological processes governing BBB permeability under physiological conditions remain unclear. Here, we investigate the role of NLRP3 inflammasome in BBB disruption following peripheral inflammatory challenges. Repeated intraperitoneal lipopolysaccharide administration causes NLRP3-dependent BBB permeabilization and myeloid cell infiltration into the brain. Using a mouse model with cell-specific hyperactivation of NLRP3, we identify microglial NLRP3 activation as essential for peripheral inflammation-induced BBB disruption. Conversely, NLRP3 and microglial gasdermin D (GSDMD) deficiency markedly attenuates lipopolysaccharide-induced BBB breakdown. Notably, IL-1β is not required for NLRP3-GSDMD-mediated BBB disruption. Instead, microglial NLRP3-GSDMD axis upregulates CXCL chemokines and matrix metalloproteinases around BBB via producing GDF-15, promoting the recruitment of CXCR2-containing neutrophils. Inhibition of neutrophil infiltration and matrix metalloproteinase activity significantly reduces NLRP3-mediated BBB impairment. Collectively, these findings reveal the important role of NLRP3-driven chemokine production in BBB disintegration, suggesting potential therapeutic targets to mitigate neuroinflammation.


Conflict of interest statement

Competing interests: The authors declare no competing interests.

Figures

Fig. 1
Fig. 1. Repeated peripheral LPS stimulation induces NLRP3-dependent blood-brain barrier disruption.
a Experimental scheme for LPS-induced brain inflammation in mice. b, c Quantification of IL-1β and IL-6 in the serum and brain extracts of mice administered with PBS or LPS (0.8 mg/kg) at 6 h post last injection. LPS x1, single injection; LPS x2, two consecutive injections with 24 h-interval. (b n = 6 (PBS, LPSx2), 5 (LPSx1); c serum, n = 4 (PBS, LPSx2), 3 (LPSx1), brain, n = 6 mice per group). d, e Representative organ images and quantification of Evans blue in the brain of mice injected with PBS or LPS at 6 h post last injection. Scale bars, 0.5 cm. Evans blue was intravenously injected 1 h before sacrifice. (n = 4 (PBS), 7 (LPSx1), 8 (LPSx2)). f Quantification of Evans blue in the brain tissue at 3−24 h post second LPS injection. (n = 4 (PBS, 3, 6, 24 h), 9 (9 h), 8 (12 h)). g Ex vivo imaging of active caspase-1 in the various tissues of mice injected with PBS or LPS and caspase-1-activatable probe at 6 h post last LPS injection. h Representative immunoblots from brain tissue extracts of wild-type (WT) and NLRP3 knockout (KO) mice injected with PBS or LPS at 6 h post last injection. i, j Quantification of Evans blue extravasation or representative images in the brain tissue of PBS- or LPS-injected WT (n = 5 (PBS), 7 (LPSx2)) and Nlrp3−/− (n = 9) mice. Scale bars, 0.5 cm. k Experimental scheme and representative images of two-photon intravital imaging of cerebral cortex of mice at 24 h post last PBS or LPS injection. Texas Red-dextran (10 kD) was intravenously injected before sacrifice. White arrows indicate the leakage of intravenous dextran. Scale bars, 50 μm. l Quantification of NaF extravasation in the brain tissue of WT or Nlrp3 −/− mice upon PBS or two consecutive LPS injections. (n = 5). m Quantification of Evans blue in the brain tissue of mice given multiple intravenous injection with PBS or cytokine cocktail (IL-1β 10 µg/kg + IL-6 35 µg/kg + TNFα 35 µg/kg). (n = 4) Error bars, s.e.m. One-way ANOVA with Dunnett post hoc test (b, c, e, f) and two-way ANOVA with Bonferroni post hoc test (i, l, m). Source data are provided as a Source Data file.
Fig. 2
Fig. 2. Repeated LPS stimulation induces NLRP3-dependent myeloid cell infiltration into brains and gliosis.
a Experimental scheme for flow cytometric analysis or immunohistochemistry of mice brain tissue upon PBS or LPS injection. b Representative flow cytometric gating strategy to identify total immune cells, microglia, brain-infiltrating myeloid cells, neutrophils (CD45hi, CD11bhi, Ly6Cint, Ly6G+), monocytes (CD45hi, CD11bhi, Ly6C+, Ly6G-) in the brain. c, d Flow cytometric analysis-based quantification of immune cells and brain-infiltrating myeloid cells in the brain tissue from PBS- or LPS-injected WT mice. (n = 6, PBS, LPSx2; 7, LPSx1). eg, i Quantification of immune cells, brain-infiltrating cells, neutrophils and microglia (i) in the brain tissue of PBS- or repeated LPS-injected WT (n = 5, PBS; 6, LPSx2) and Nlrp3−/− mice (n = 6, PBS; 7, LPSx2) by flow cytometric analysis. h Representative images of extravascular neutrophils of control (LysM-GFP) and NLRP3 KO (LysM-GFP; Nlrp3−/−) mice injected with PBS or repeated LPS at 24 h post last LPS injection. Mice were i.v. injected with 70 kDa Texas Red-dextran before sacrifice. Scale bar, 50 μm. j, k Quantification of brain-infiltrating cells and neutrophils in the brain of PBS- or repeated LPS-administered WT mice by flow cytometry. LPS interval represents the time gap between first and second LPS injection. (n = 3, PBS; 7, 24 h; 6, 48 h; 5, 72 h). l Representative immunofluorescence images of hippocampal regions of PBS- or repeated LPS-injected WT and Nlrp3−/− mice at 6 h post last injection. The brain coronal sections were stained with anti-GFAP (green) and anti-Iba1 (red). DAPI represents nuclei signal (blue). Scale bars, 50 µm. Quantification of the mean fluorescence intensity of GFAP (m) and the cell numbers of GFAP+ astrocytes (n) normalized by DAPI in WT and Nlrp3−/− mice upon LPS injections. (m, n = 5 for KO-PBS, 6 for all other group; n, n = 5). Quantification of the mean fluorescence intensity of Iba1 (o) and the cell numbers of Iba1+ microglia (p) normalized by DAPI in WT and Nlrp3−/− mice upon LPS injections. (o, n = 5 for KO-PBS, 6 for all other group; p, n = 5) Error bars, s.e.m. One-way ANOVA with Dunnett post hoc test (c, d, j, k) and two-way ANOVA with Bonferroni post hoc test (e, f, g, i, m, n, o, p). Source data are provided as a Source Data file.
Fig. 3
Fig. 3. IL-1R signaling is not required for peripheral inflammation-induced BBB disruption and myeloid cell infiltration into brains.
a Experimental scheme for pretreatment of MCC950 or IL-1RA (10 mg/kg) 30 min before PBS or LPS injection. b, c Representative images or quantification of Evans blue extravasation into the brain in response to the repeated LPS injection into mice pretreated with MCC950 or IL-1RA. Scale bars, 0.5 cm. (n = 9, PBS, LPSx2; 6, MCC, IL-1RA group). d Representative flow cytometric analysis depicting the population of immune cells (CD45+) in the mouse brains stimulated as in b and c. e, f Flow cytometric analysis-based quantification of brain-infiltrating myeloid cells and neutrophils in the brain of PBS- or LPS-treated mice with MCC950 and IL-1RA pretreatment. (n = 7 for MCC group; 5 for all other group). g, h Quantification and representative images of Evans blue extravasations in WT and Il1r1−/− mice brain upon LPS injections. Scale bars, 0.5 cm. (n = 5, PBS, 9, LPSx2, WT; n = 6, PBS, 8, LPSx2, Il1r1−/−). i Representative flow cytometric analysis of brain illustrating the population of immune cells (CD45+) in the WT and Il1r1−/− mice upon repeated LPS injections. j, k Flow cytometric analysis-based assessment of brain-infiltrating cells and neutrophils in the WT and Il1r1−/− mice brain upon repeated LPS injections. (n = 5). l Representative immunofluorescence images of brain hippocampal region from WT, Nlrp3−/−, and Il1r1−/− mice upon repeated LPS stimulation, followed by Texas red-dextran injection 1 h before sacrifice. DAPI represents nuclei signal (blue). Scale bars, 100 µm. m Quantification of dextran fluorescence normalized by DAPI in the hippocampal region of WT (n = 11), Nlrp3−/− (n = 7), and Il1r1−/− (n = 8) mice treated as in l. n Quantification of IL-18 in the brain extracts of WT (n = 4, PBS; 5, LPSx2) and Nlrp3−/− mice (n = 5, PBS; 6, LPSx2) upon repeated LPS injections. o Quantification of Evans blue deposition in the brain of WT (n = 3, PBS; 6, LPS x2) and Gsdmd−/− mice (n = 7, PBS; 12, LPS x2) upon repeated LPS injections. Error bars, s.e.m. One-way ANOVA with Dunnett post hoc test (c, e, f, m) and two-way ANOVA with Bonferroni post hoc test (g, j, k, n, o). Source data are provided as a Source Data file.
Fig. 4
Fig. 4. Single-cell RNA sequencing analysis of mouse brains following repeated LPS stimulation.
a UMAP plots of single-cell RNA sequencing data encompassing 105,838 genes, displaying a comprehensive single-cell map of the mouse brain. The merged dataset incorporates samples from PBS- or LPS-injected WT and NLRP3 KO groups. The UMAP visualization delineates the intricate cellular landscape into 17 distinct and color-coded clusters. b Representation of cell cluster ratios in each group relative to the WT-PBS group. Color intensity reflects the difference in ratio between the WT-PBS group and each respective group. c Bar plot depicting the log2 fold changes (log2FC) of each cell type when comparing the WT-LPS x2 group versus the KO-LPS x2 group. Bars on the right side indicates an increase in the WT-LPS x2 group, while those on the left side signify an increase in the KO-LPS x2 group. d UMAP plots of neutrophil clusters of PBS- or LPS-injected WT and NLRP3 KO mice. e Heatmap illustrating the expression of inflammasome marker genes in each cluster. Color intensity indicates scaled mean expression level. f VISION scoring of inflammasome genes on all cell clusters within all samples. The violin plot illustrates the inflammasome score using genes derived from e.
Fig. 5
Fig. 5. Contribution of microglial NLRP3 inflammasome activation to peripheral LPS-induced BBB disruption.
Summary of NLRP3 expression in Cx3cr1+ (a) or Aldh1l1+ cells (b) and other cell types of control and NLRP3 mutant (D301N)-expressing mice upon tamoxifen treatment (left panel). Quantification of Evans blue extravasation in the tamoxifen-treated control (a, n = 3, PBS, 8, LPS x2; b, n = 3, PBS, 5, LPS x2) and NLRP3 mutant (a, n = 3, PBS, 6, LPS x2; b, n = 3, PBS, 7, LPS x2) mice brain upon PBS or repeated LPS injection (right panel). c Summary of NLRP3 expressions in Tmem119+ cells and other cell types of control and NLRP3 mutant mice upon tamoxifen treatment (left panel). Quantification of Evans blue extravasation (right panel) in the tamoxifen-treated control and mutant mice brain upon PBS or repeated LPS injection. (n = 3, PBS, 11, LPS x2, control; n = 5, PBS, 13, LPS x2, mutant). d Representative images of brain as in c. e Representative flow cytometric analysis of brain illustrating the population of microglia and brain-infiltrating myeloid cells (CD45hi CD11bhi) in the control and NLRP3 mutant (Tmem119creER) mice upon PBS or repeated LPS injections. Scale bars, 0.5 cm. f Quantification of brain-infiltrating myeloid cells or neutrophils in e. (n = 4, PBS, 6, LPS x2, control; n = 6, mutant). g Quantification of Evans blue depositions in the tamoxifen-treated control mice (Gsdmdflox/flox, n = 5) and microglia (MG)-specific Gsdmd−/− mice (Tmem119creER/+; Gsdmdflox/flox, n = 3) upon repeated LPS injection. h Quantification of neutrophils in the brain of control and MG-Gsdmd−/− mice upon repeated LPS injection by flow cytometry. (n = 6) Error bars, s.e.m. Unpaired two-sided Student’s t test (g, h) and two-way ANOVA with Bonferroni post hoc test (ac, f). Source data are provided as a Source Data file.
Fig. 6
Fig. 6. NLRP3 inflammasome leads to the reprogramming of BBB-composing cells toward chemotaxis and cell migration.
a Venn diagram illustrating the number of genes specifically upregulated in brain endothelial cells following LPS x2-treated versus PBS-treated group in WT mice (orange, fold change >2, p < 0.05) and genes upregulated in WT-LPS x2 versus KO-LPS x2 (blue, fold change >1.4, p < 0.05). b Heatmap presenting 20 genes notably upregulated in the WT LPS x2 group from a excluding unannotated genes. Color intensity indicates scaled mean expression level. c Gene Ontology (GO) analysis results for 33 genes identified in a, depicting enriched terms in GO Biological Processes (BP). Heatmap illustrating the expression of major tight junction genes (d) or adhesion molecules (e) in the brain endothelial cells of WT and Nlrp3-deficient mice following PBS or LPS stimulations. Barplots illustrating WT LPS x2-specific terms identified in gene ontology: f pericyte in GO BP, g astrocytes in GO Molecular Function (MF), and h astrocytes in Sigma DB. These analysis utilized genes particularly increased in the WT LPS x2 group compared to both the WT PBS and KO LPS x2 group. i UMAP plot displaying astrocyte and astrocyte2 clusters in WT-PBS and WT-LPS x2 group. j Violin plot showing the expression of top 10-upregulated genes in astrocyte 2 compared to astrocyte cluster. Bold denotes IFN-related or stimulated genes.
Fig. 7
Fig. 7. NLRP3 inflammasome-dependent upregulation of type 1 interferon-related genes in microglia and all brain cell clusters.
a UMAP plot displaying 6 subclusters of microglia. b Heatmap illustrating categories presenting specific functional terms in microglia subclusters. c Trajectory analysis illustrating the microglial fate directions between distanced cluster lineages. UMAP visualization is color-coded to represent subclusters of microglia or outlining the trajectory from homeostatic microglia to distinct subtypes in ISGs and DAM1. d UMAP visualization depicting the density of microglia cells for each experimental group with density values scaled between 0 and 1. e Venn diagram showing the number of genes specifically increased in all clusters in WT LPS x2 group versus WT PBS group (fold change >1.5, p < 0.05) and versus KO LPS x2 group (fold change >1.5, p < 0.05). f Heatmap displaying NLRP3-specific increased 30 genes derived from e, with unannotated genes excluded. g, h Quantification of brain-infiltrating myeloid cells or neutrophils in the brain of repeated LPS-treated WT and Rsad2-deficient mice at 6 h post last injection. (n = 8, WT; n = 9, Rsad2-deficient mice). i, j Quantification of brain-infiltrating myeloid cells or total brain immune cells (CD45+) in the brain of PBS- or repeated LPS-treated WT and Ifnar1-deficient mice at 6 h (i) or 12 h (j) post last injection. (i, n = 3, PBS, 6, LPS x2; j, n = 5, PBS, 4, LPS x2). Color intensity indicates scaled mean expression level (b, f). Error bars, s.e.m. Unpaired two-sided Student’s t test (g, h, j) and two-way ANOVA with Bonferroni post hoc test (i). Source data are provided as a Source Data file.
Fig. 8
Fig. 8. Microglial NLRP3-GSDMD activation induces the production of Cxcr2-specific chemokines via releasing GDF-15.
a, b Heatmap illustrating the NLRP3-dependent increased expression of chemokine genes across all groups in all clusters or endothelial cells. Color intensity indicates scaled mean expression level. c, d Quantification of mRNA levels of Cxcl1 and Cxcl2 in the whole brain extracts of PBS- or repeated LPS-injected WT, Nlrp3−/−, Gsdmd−/−, and Il1r1−/− mice at 3 h or 6 h after the last injection. (The number of biological replicates was presented in the order of PBS, 3 h, 6 h; n = 3, 6, 5, WT; 4, 6, 4, Nlrp3−/−; 3, 4, 6, Gsdmd−/−; 4, 4, 6, Il1r1−/− mice). e Quantification of brain mRNA level of Cxcl1 in control and Tmem119-specific NLRP3 mutant (D301N)-expressing mice at 6 h post second LPS injection. (n = 4). f Quantification of brain mRNA levels of Cxcl1 and Cxcl2 in control (Gsdmdflox/flox) and MG-Gsdmd−/− mice (Tmem119creER/+; Gsdmdflox/flox) upon PBS (n = 3) or repeated LPS (n = 5) injection by flow cytometry. g Experimental scheme to isolate secretome from microglia treated with LPS (0.25 μg/ml, 3 h) followed by ATP treatment (2.5 mM, 20 min). h Heatmap illustrating the relative concentration of target proteins in the culture supernatant from WT or Gsdmd−/− (KO) microglia upon appropriate treatments as determined by mass spectrometric analysis. L + A denotes LPS + ATP treatment as in g. Color intensity indicates relative abundances of targeted proteins. i Quantification of Gdf15 mRNA levels in the brain tissues of PBS- or repeated LPS-treated WT and Nlrp3−/− mice. (n = 4, WT-PBS; 7, all other group). j Quantification of GDF15 protein levels in the brain tissues of PBS- or repeated LPS-treated WT and Nlrp3−/−, Gsdmd−/− mice at 3 h after the last injection. (n = 4). k Quantification of mRNA levels of multiple chemokines in the mixed glial cultures untreated or treated with GDF-15 (100 ng/ml, 6 h). (n = 4). l, m Quantification of CXCL1 and CXCL2 protein levels in the brain tissues of mice at 6 h post intravenous injection with PBS or GDF-15 (2 μg). (n = 4, PBS; 5, GDF-15). Error bars, s.e.m. One-way ANOVA with Dunnett post hoc test (c, d), two-way ANOVA with Bonferroni post hoc test (e, f, i, j) and unpaired two-sided Student’s t test (k, l, m). Source data are provided as a Source Data file.
Fig. 9
Fig. 9. Neutrophil recruitment contributes to BBB disruption following peripheral inflammatory stimulation.
a Representative immunoblots detecting pro-IL-1β, IL-1β, and NLRP3 in brain lysates of WT mice at different time points (0, 1 ~ 6 h) after the second LPS injection. b, c Quantification of brain-infiltrating myeloid cells or neutrophils in the brain of WT mice upon PBS or repeated LPS injection at different time points by flow cytometry. (1 ~ 6 h post second LPS injection, n = 5, PBS, 4 h; 6, 3 h; 4, all other group). d Violin plot showing chemokine receptor gene expression in neutrophils of all groups. e Circle plot visualizing cell-cell communication in the CXCL signaling pathways for each experimental group. The plot displays interactions among two cell types in the PBS group and 5 cell types (Endo Endothelial cell, Peri Pericyte, Astro Astrocyte, Micro Microglia, Neutro Neutrophil) in the LPS x2 group. The width and color of arrows represent the probability of interaction. f Quantification of Evans blue depositions in the WT mouse brains upon repeated LPS injection pretreated with IgG (n = 4) or anti-Ly6G (n = 6) antibodies (50 μg, i.p.) 1 h before 1st LPS injection. g Quantification of Evans blue depositions in the WT mouse brains upon repeated LPS injection in the presence of vehicle (n = 6) or anti-CXCR2 antagonist SB225002 (n = 8) treatment (2 mg/kg, i.p.). h Quantification of Evans Blue extravasation into the brain followed by LPS injections in WT and Ccr2−/− mice. n = 5 (WT) or 3 (Ccr2−/−) mice. Error bars, s.e.m. One-way ANOVA with Dunnett post hoc test (b, c) and unpaired two-sided Student’s t test (f, g, h). Source data are provided as a Source Data file.
Fig. 10
Fig. 10. NLRP3-GSDMD-dependent upregulation of matrix metalloproteinases and their contribution to BBB disruption.
a Heatmap displaying diverse matrix metalloproteinase (MMP) genes in the brain of all clusters of WT and NLRP3 KO mice upon PBS or LPS injection. b Dot plot visualizing MMP signaling markers for each cell cluster across all groups. c Quantification of brain Mmp9 mRNA levels in the WT mice at 1 ~ 6 h post second LPS injection. (n = 3, PBS, 5 h; 4, all other group). d, e Quantification of Mmp9 or Mmp8 mRNA levels in the WT and Nlrp3−/− mice at 3 or 6 h post second LPS injection. (d, n = 4; e, WT, n = 5 for PBS, 8 for 3 h, 3 for 6 h, KO, n = 5 for PBS, 3 h, 4 for 6 h). f, g Quantification of MMP9 levels in the brain extracts of WT and Nlrp3−/− (f) or microglia-specific Gsdmd−/− (g) mice at 6 h post repeated LPS injection. (n = 5, f; n = 4, g). h Quantification of brain mRNA level of Mmp9 in control and Tmem119-mutant mice (n = 5) upon PBS or single/repeated LPS injection at 6 h post last injection. i Quantification of Evans bue extravasations in the mouse brains upon repeated LPS injections in the presence of vehicle or MMP inhibitor Ilomastat (50 mg/kg, i.p.) at 6 h post 2nd LPS injection. (n = 8, Veh, n = 7, Ilomastat). j Representative images of Evans bue extravasations in the mouse brains following repeated LPS injections in the presence of Ilomastat treatment as in i. Scale bars, 0.5 cm. k Quantification of NaF extravasations in brain tissues of mice given repeated LPS injections in the presence of Ilomastat. (n = 4, Veh, n = 3, Ilomastat) Error bars, s.e.m. One-way ANOVA with Dunnett post hoc test (c), two-way ANOVA with Bonferroni post hoc test (df, h) and unpaired two-sided Student’s t test (g, i, k). Source data are provided as a Source Data file.

References

    1. Abbott, N. J., Ronnback, L. & Hansson, E. Astrocyte-endothelial interactions at the blood-brain barrier. Nat. Rev. Neurosci.7, 41–53 (2006). - PubMed
    1. Xiao, M., Xiao, Z. J., Yang, B., Lan, Z. & Fang, F. Blood-Brain Barrier: More Contributor to Disruption of Central Nervous System Homeostasis Than Victim in Neurological Disorders. Front. Neurosci.14, 764 (2020). - PMC - PubMed
    1. Galea, I. The blood-brain barrier in systemic infection and inflammation. Cell. Mol. Immunol.18, 2489–2501 (2021). - PMC - PubMed
    1. Bernardo-Castro, S. et al. Pathophysiology of Blood-Brain Barrier Permeability Throughout the Different Stages of Ischemic Stroke and Its Implication on Hemorrhagic Transformation and Recovery. Front. Neurol.11, 594672 (2020). - PMC - PubMed
    1. Qiu, Y. M. et al. Immune Cells in the BBB Disruption After Acute Ischemic Stroke: Targets for Immune Therapy? Front. Immunol.12, 678744 (2021). - PMC - PubMed

MeSH terms

LinkOut - more resources