. 2025 Jan 15;16(1):706.
doi: 10.1038/s41467-024-55770-1.

Chimeric antigen receptor macrophages (CAR-M) sensitize HER2+ solid tumors to PD1 blockade in pre-clinical models

Affiliations

Chimeric antigen receptor macrophages (CAR-M) sensitize HER2+ solid tumors to PD1 blockade in pre-clinical models

Stefano Pierini et al. Nat Commun. .

Erratum in

Abstract

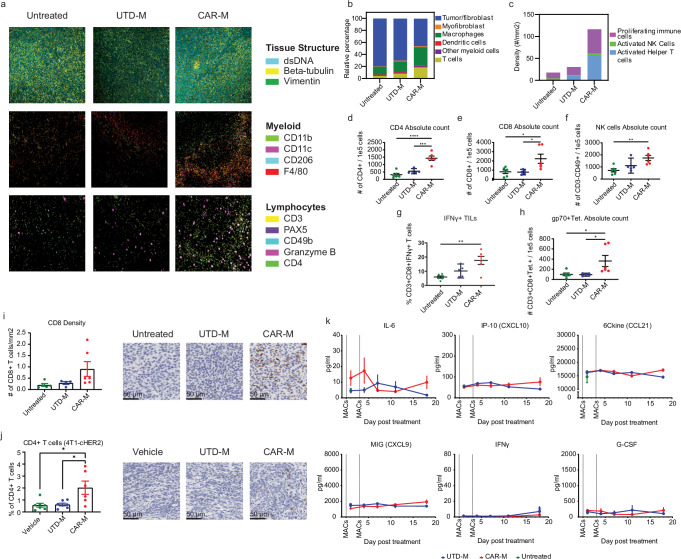
We previously developed human CAR macrophages (CAR-M) and demonstrated redirection of macrophage anti-tumor function leading to tumor control in immunodeficient xenograft models. Here, we develop clinically relevant fully immunocompetent syngeneic models to evaluate the potential for CAR-M to remodel the tumor microenvironment (TME), induce T cell anti-tumor immunity, and sensitize solid tumors to PD1/PDL1 checkpoint inhibition. In vivo, anti-HER2 CAR-M significantly reduce tumor burden, prolong survival, remodel the TME, increase intratumoral T cell and natural killer (NK) cell infiltration, and induce antigen spreading. CAR-M therapy protects against antigen-negative relapses in a T cell dependent fashion, confirming long-term anti-tumor immunity. In HER2+ solid tumors with limited sensitivity to anti-PD1 (aPD1) monotherapy, the combination of CAR-M and aPD1 significantly improves tumor growth control, survival, and remodeling of the TME in pre-clinical models. These results demonstrate synergy between CAR-M and T cell checkpoint blockade and provide a strategy to potentially enhance response to aPD1 therapy for patients with non-responsive tumors.


Conflict of interest statement

Competing interests: M.K. and S.G. are scientific co-founders of Carisma Therapeutics Inc, equity shareholders, and inventors of patents related to this work. S.P., R.G., M.C.O.-N., R.Q., A.W., S.H., K.N., C.G., L.L., Y.O., K.R., C.S., M.B., B.S., P.S., L.C., D.B., S.C., N.M., K.C., L.S., I.Z., D.C., S.C.D, S.A., T.C., and M.K. are employees of Carisma Therapeutics Inc and equity shareholders. H.L and S.G. are Scientific Advisory Board Members and shareholders of Carisma Therapeutics Inc. S.G. has patents related to CAR therapy with royalties paid from Novartis to the University of Pennsylvania. S.G. is a scientific co-founder and holds equity in Interius Biotherapeutics and Carisma Therapeutics Inc. S.G. is a scientific advisor to Carisma, Cartography, Currus, Interius, Kite, NKILT, Mission Bio, and Vor Bio. O.S. declares no competing interests. This work was funded by Carisma Therapeutics Inc which is pursuing the commercial development of related products.

Figures

Fig. 1
Fig. 1. Development of a syngeneic primary CAR-M model system.
a PCA clustering from HSCs, monocytes, and CAR-M cultures (n = 3). b Incucyte-based killing assays of UTD-M or CAR-M generated from monocytes (GM-CSF or M-CSF) and HSCs (M-CSF) cocultured with AU565 NLG at effector:target (E:T) ratio 1:1 for 40 h. Green fluorescence intensity (GFI) values were normalized to the 0 h timepoint, then further normalized to the target cells. Values were transformed to % cytotoxicity (1-GFI)*100 %). Data are representative of three experiments and shows the mean ± SD of n = 4 technical replicates. Statistical analysis was calculated using the ordinary one-way ANOVA test. c Viability, and sustained Ad5f35 CAR expression up to 13 days post-transduction of M-CSF-derived, HSCs-differentiated macrophage. Data are representative of several experiments and show the mean ± SEM of n = 3 technical replicates. d, Representative FACS plots showing CAR expression. e, f Expression of pro-inflammatory (e.g., CD80, CD86 and MHC-II) and anti-inflammatory (e.g., CD206) markers were measured 48 h. after macrophages transduction at the protein level (e, n = 3 technical replicates) by flow cytometry and at the gene level (f, n = 3 biological replicate) by RNA-Seq. Statistical analysis for (e) was calculated with the two-sided paired t test. g Killing assays with UTD-M or CAR-M cocultured with target (MC38-HER2 and CT26-HER2) and parental cell lines (WT, HER2 negative) at E:T 2:1. GFI values were first normalized to the 0 h. timepoint then normalized to the respective target cells. Data is shown as mean ± SEM of n = 2–3 technical replicates. Statistical significance was calculated via two-way RM ANOVA. Graph is representative of three experiments. h, i Cytokine and chemokine production by CAR-M after overnight stimulation with plate-bound recombinant human HER2 protein or recombinant mesothelin (Meso; irrelevant antigen control) was determined by cytokine multiplex assay (n = 3 biological replicate). h Data are represented as the mean ± SD. Statistical analysis was performed using the two-way ANOVA Tukey’s multiple comparisons test. i Heatmap comparing mesothelin- vs HER2-stimulated CAR-M cytokine and chemokine production. Two-sided unpaired Student’s t test was used to calculate significance. j Phagocytosis assay of MC38 cells by UTD-M or CAR-M determined by flow cytometry. Data represents the mean ± SEM of n = 3 technical replicates. Statistical significance was calculated via two-way ANOVA multiple comparisons. Graph is representative of two experiments. k MHC class I expression on MC38WT and MC38-HER2 cells co-cultured with UTD-M or CAR-M. Data show the mean ± SEM of n = 2 technical replicates and representative FACS plots show MHC-I (H2kB) MFI. Graph is representative of two experiments. l Killing kinetics of UTD-M and CAR-M co-cultured with MC38OVA+HER2+ and transgenic CD8+ T cells (OT−1), at E:T:T (Effector:Target:T cells), 2:1:6. GFI values were normalized to the 0 h. timepoint and then, further normalized to the target cells. Data represents the mean ± SEM of n = 3 technical replicates and is representative of two experiments. m UTD-M and CAR-M were co-cultured with MC38OVA+ and transgenic T cells (OT-1), at E:T:T (Effector:Target:T cells), 2:1:6. Flow cytometry was used to assess T cell activation at the 24 h timepoint (n = 3 technical replicates). Fold change was calculated by dividing the % expression of CAR-M by that of UTD-M. For all images: *p < 0.05, **p < 0.01, ***p < 0.001, ****p < 0.0001. Source data are provided as a Source Data file.
Fig. 2
Fig. 2. CAR-M therapy inhibits tumor growth, improves overall survival and induces long-term anti-tumor immunity.
CT26-hHER2 tumor was established SQ in BALB/c mice for 14 days prior to treatment with IT UTD-M (n = 9), CAR-M (n = 8) or left untreated (n = 8) to assess tumor burden. a Tumor growth curves are shown until the first mortality in the respective groups and represent the mean ± SEM. Statistical analysis was performed using the two-way RM ANOVA. Waterfall plot shows change in tumor volume on day 32 compared to baseline. c Kaplan–Meier survival curve over 118 days. Statistical significance was calculated using the log-rank Mantel–Cox test. Graphs are representative of 2 experiments. d CT26-hHER2 tumor was established SQ in BALB/c and mice were treated for three consecutive days with anti-CD8 (n = 7), anti-CD4 (n = 6) and anti-CD4 and anti-CD8 (n = 7) starting on day 14. IT CAR-M or UTD-M was administered on day 17 (CAR-M n = 6; UTD-M n = 7). Statistical analysis was performed using the two-way RM ANOVA. Data represents the mean ± SEM and the experiment was conducted once. e Schematic of mice post CAR-M (n = 3) therapy rechallenged with HER2-negative CT26WT tumors two months post CR. Created in BioRender. Pierini, S. (2024) https://BioRender.com/s22i371. f Kaplan–Meier survival curve over 40 days post CAR-M therapy rechallenged HER2-negative CT26WT with tumors. Naïve mice were included (n = 9). g Kaplan–Meier survival curve over 42 days post-CAR-M with concomitant anti-CD3 therapy and rechallenged with HER2-negative CT26WT tumors. Naïve mice were included (n = 9). h 4T1-cHER2 tumor was established orthotopically in the MFP of BALB/c mice for 13 days and treated with IV CAR-M. CAR-M (n = 5) controlled tumor growth in 4T1-cHER2 compared to untreated (n = 7) and UTD-M (n = 7). Data represents mean ± SEM. Statistical analysis was performed using the two-way RM ANOVA. i Waterfall plot shows change in tumor volume on day 31 from baseline. Graphs are representative of three experiments. j 5 × 10⁶ of fluorescently labeled (IVISense680) murine CAR-M were IV injected into 4T1-cHER2 tumor-bearing BALB/c mice. Fluorescence was monitored over a period of 12 days and localized in the livers and MFP tumors. Quantification is represented as the mean ± SEM (n = 4). Values are normalized by subtracting the baseline signal from the untreated mouse. The experiment was performed once. For all images: *p < 0.05, **p < 0.01, ***p < 0.001, ****p < 0.0001. Source data are provided as a Source Data file.
Fig. 3
Fig. 3. Regional CAR-M therapy remodels the tumor microenvironment (TME) and activates tumor-infiltrating lymphocytes (TILs).
CT26-hHER2 tumor was established SQ in BALB/c for 12 days and treated with IT UTD-M or CAR-M. Representative MIBI multiplexed IHC images showed tissue structure (dsDNA, Beta-tubulin, Vimentin), myeloid (CD11b, CD11c, CD206, F4/80), and lymphocyte (CD3, PAX5, CD49b, Granzyme B, CD4) markers within tumors harvested 25 days post inoculation (13 days post 1st macrophage dose). Untreated mice were included as controls (n = 3/group). b, c Relative percentage of cell populations and cell density by MIBI in UTD-M, CAR-M, and untreated mice. Data represents the mean values of n = 3 and, the experiment was conducted once. df Absolute count of CD4+, CD8+, and NK cells by flow cytometry from 1 × 10⁵ digested tumors. g Percentage of IFNγ+ CD8+ T cells determined by intracellular staining (ICS) after overnight stimulation of digested tumor suspension with AH1 peptide. h Absolute count of gp70+ T cells by tetramer assay within 1 × 10⁵ digested tumor suspension. Data in (dh) represents the mean ± SEM of n = 6 (Untreated and CAR-M) and n = 5 (UTD-M). Statistical analysis was performed using ordinary one-way ANOVA and data is representative of three experiments. i CD8+ T cell density by IHC in tumor sections of CAR-M (n = 6), UTD-M (n = 4) and untreated groups (n = 5). Data represents the mean ± SEM and graph is representative of two experiments. Representative IHC sections are shown at x40 high-power fields per slide. j 4T1-cHER2 tumor was allowed to grow in MFP in BALB/c for 13 days and was treated with IV CAR-M (n = 6), UTD-M (n = 7) or vehicle control (n = 7). Tumors were harvested on day 28 post tumor inoculation (15 days post 1st macrophage dose) and FFPE sections were stained in IHC. The percentage of CD4+ T cells are shown for all treatment groups. Data represents the mean ± SEM and is representative of two experiments. Statistical analysis was performed using ordinary one-way ANOVA. Representative IHC sections are shown at x40 high-power fields per slide. k Quantification of serum IL-6, IP-10 (CXCL10), 6Ckine (CCL21), MIG (CXCL9), IFNγ, and G-CSF levels in CT26-hHER2 tumor-bearing BALB/c mice by multiplexed Luminex assay up to 18 days post treatment with CAR-M and UTD-M (n = 6-7/group). Untreated mice (n = 7) were included. Dotted lines represent macrophage doses. Data represents mean ± SEM and is representative of two experiments. For all images: *p < 0.05, **p < 0.01, ***p < 0.001, ****p < 0.0001. Source data are provided as a Source Data file.
Fig. 4
Fig. 4. Regional CAR-M therapy in combination with PD1 blockade remodels the TME and drives anti-tumor T cell immunity.
CT26-hHER2 tumor was established SQ in BALB/c and treated with IT CAR-M starting at day 12. aPD1 was administered IP approximately every 3 days, starting at day 12 until day 36. a Tumor growth curves represent the mean ± SEM and are shown until the first mortality was reported in the respective groups. CAR-M (n = 10), aPD1 (n = 7), CAR-M + aPD1 (n = 9), or untreated (n = 9) groups were analyzed. b Tumor volume from individual mice is shown until day 76. Statistical analysis was calculated using the 2-way ANOVA, mixed-effects analysis. The experiment was performed once. To assess TME changes, CT26-hHER2 tumor-bearing BALB/c were treated with IT CAR-M starting on day 12 and aPD1 on day 15. Tumors were harvested 25 days post tumor inoculation. c, d Representative images of cell populations and quantification by relative fractions or cell density from MIBI multiplexed IHC analysis of tumor FFPE specimens from untreated, aPD1, CAR-M, CAR-M + aPD1 groups. Data shows mean values of n = 3. The experiment was conducted once. e,f CD4+ and CD8+ T cell absolute count from 1 × 10⁵ digested tumor cell suspensions. Untreated (n = 6), aPD1 (n = 5), CAR-M (n = 6) and CAR-M + aPD1 (n = 7) groups were evaluated by flow cytometry. Data represents mean ± SEM and is representative of two experiments. Statistical analysis was performed using ordinary one-way ANOVA. gj Tumor (n = 5/group) and matching peripheral blood (n = 5/group) samples were profiled for TCRB sequence to determine Morisita Index, peripheral T cells fraction, shared clone between subjects and tumor repertoire clonality in all treatment groups. Data is represented as median with wishers indicating the minimum and maximum values. Statistical analysis was calculated using the ordinary one-way ANOVA, multiple comparisons test. Data is representative of two experiments. For all images: *p < 0.05, **p < 0.01, ***p < 0.001, ****p < 0.0001. Source data are provided as a Source Data file.
Fig. 5
Fig. 5. Systemic CAR-M therapy in combination with PD-1 blockade enhances anti-tumor activity against established solid tumors.
a 4T1-cHER2 tumor was established orthotopically and treated with systemic IV CAR-M and IP aPD1, both starting on day 16. Tumor growth curves represent the mean ± SEM of n = 7 and data is representative of two experiments. Statistical analysis was performed using the two-way RM ANOVA. In a separate experiment, 4T1-cHER2 tumor was established orthotopically and treated with systemic IV CAR-M and IP aPD1, both starting at day 14 (n = 7/group except CAR-M n = 6). b Waterfall plot shows changes in tumor volume on day 28 relative to baseline. c, Frequency of CD4+ T cells by IHC in 4T1-cHER2 tumors on day 28. Data represents the mean ± SEM and is representative of two experiments. Statistical analysis was performed using ordinary one-way ANOVA. CT26-hHER2 tumor-bearing mice were treated with systemic IV CAR-M starting on day 10 and IP aPD1 on day 14. d Tumor volume shown as the mean ± SEM of n = 8/group except UTD-M + aPD1 n = 7. Statistical analysis was performed using the two-way ANOVA, mixed model. e Kaplan–Meier survival curve over 98 days shows the combined mice survival from three independent experiments (UTD-M n = 24; CAR-M, aPD1 and CAR-M + aPD1 n = 23, UTD-M + aPD1 n = 15). Statistical significance was calculated using the log-rank Mantel–Cox test. In a separate experiment, CT26-hHER2 tumors were collected on day 29 for TME analysis. f CD4+, CD8+, and gp70+ T cells absolute count from 1 × 10⁶ digested tumor tissue by flow cytometry. Data represents the mean ± SEM (n = 4/group except aPD1 n = 3 and CAR-M + aPD1 n = 5). Statistical analysis was performed using ordinary one-way ANOVA. g CD4 + T cells frequency by IHC. Data represents the mean ± SEM of n = 4. Statistical analysis was performed using ordinary one-way ANOVA. Representative IHC sections at x20 high-power fields per slide. h, i Serum IL-6, IFNγ, MCP-1 (CCL2), IL-16, G-CSF, MCP-5 (CCL12), IP-10 (CXCL10), IL-5, and MIG (CXCL9), 6Ckine (CCL21) levels were quantified by multiplexed Luminex assay up to 20 days post-treatment (n = 2-5/group). Dotted lines represent CAR-M doses. Data represents the mean ± SEM and is representative of two experiments. j Serum SAA-3 level was quantified by ELISA, presented as mean ± SEM of n = 2–4/group, and it is representative of a single experiment. For all images: *p < 0.05, **p < 0.01, ***p < 0.001, ****p < 0.0001. Source data are provided as a Source Data file.

References

    1. June, C. H., O’Connor, R. S., Kawalekar, O. U., Ghassemi, S. & Milone, M. C. CAR T cell immunotherapy for human cancer. Science359, 1361–1365 (2018). - PubMed
    1. Wang, X. et al. Metabolic Reprogramming via ACOD1 depletion enhances function of human induced pluripotent stem cell-derived CAR-macrophages in solid tumors. Nat. Commun.14, 5778 (2023). - PMC - PubMed
    1. Lei, A. et al. A second-generation M1-polarized CAR macrophage with antitumor efficacy. Nat. Immunol.25, 102–116 (2024). - PubMed
    1. Klichinsky, M. et al. Human chimeric antigen receptor macrophages for cancer immunotherapy. Nat. Biotechnol.38, 947–953 (2020). - PMC - PubMed
    1. Morrissey, M. A. et al. Chimeric antigen receptors that trigger phagocytosis. Elife7 (2018). - PMC - PubMed

MeSH terms