. 2025 Jan 15;15(1):2056.
doi: 10.1038/s41598-025-85780-y.

Two-photon NAD(P)H-FLIM reveals unperturbed energy metabolism of Ascaris suum larvae, in contrast to host macrophages upon artemisinin derivatives exposure

Affiliations

Two-photon NAD(P)H-FLIM reveals unperturbed energy metabolism of Ascaris suum larvae, in contrast to host macrophages upon artemisinin derivatives exposure

Zaneta D Musimbi et al. Sci Rep. .

Abstract

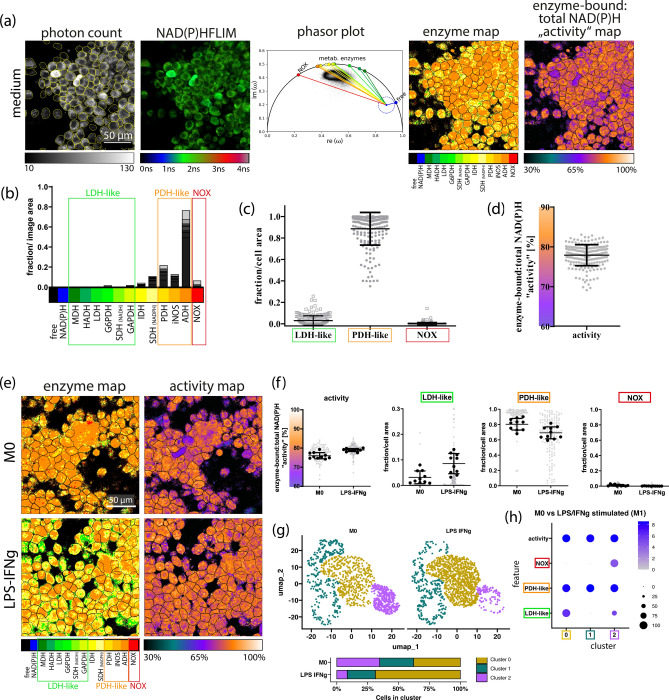
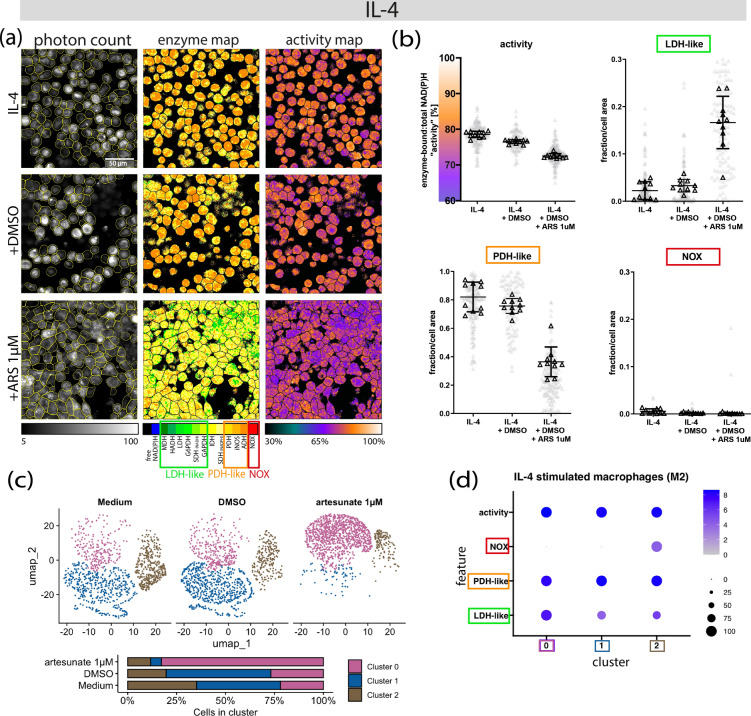
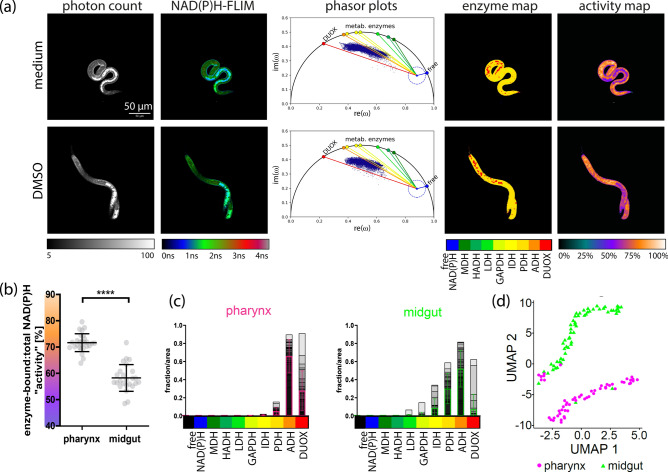
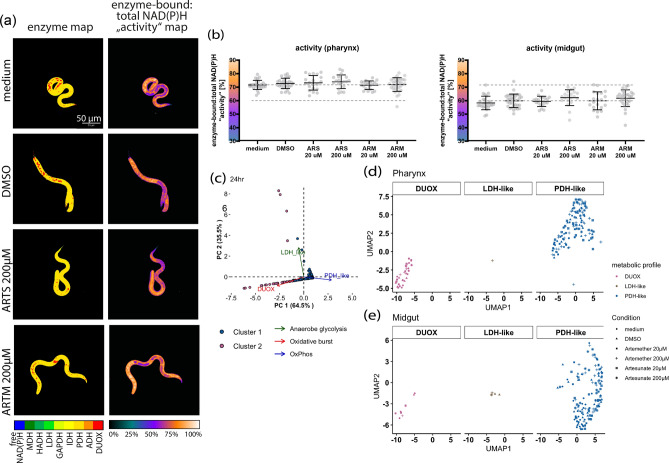
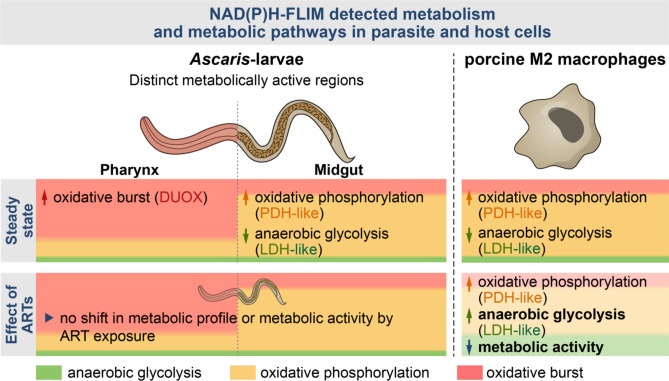
Soil-transmitted helminths (STH) are widespread, with Ascaris lumbricoides infecting millions globally. Malaria and STH co-infections are common in co-endemic regions. Artemisinin derivatives (ARTs)-artesunate, artemether, and dihydroartemisinin-are standard malaria treatments and are also known to influence the energy metabolism of parasites, tumors, and immune cells. Herein, we explore the potential of ARTs to influence ascariasis either by directly targeting larvae or indirectly by modifying macrophage responses. Ascaris suum third-stage larvae and porcine IL-4 polarized (M2-like) macrophages were exposed to ARTs in vitro, and their metabolism was evaluated using two-photon NAD(P)H-FLIM. Both larvae and M2-like macrophages exhibited a steady-state bioenergetic profile of high oxidative phosphorylation and low anaerobic glycolysis. In A. suum larvae, two metabolically distinct regions were identified, with particularly high DUOX activity in the pharynx compared to the midgut; however, ARTs did not alter these profiles. In contrast, exposure of M2-like macrophages to ARTs induced a metabolic shift towards high anaerobic glycolysis and reduced metabolic activity, suggesting a possible indirect effect of ARTs on the helminth infection. Overall, two-photon NAD(P)H-FLIM proved to be a powerful tool for studying specific metabolic pathways in Ascaris larvae and host macrophages, offering valuable insights into the metabolic mechanisms of drug action on both parasite and host.


Conflict of interest statement

Declarations. Competing interests: The authors declare no competing interests.

Figures

Fig. 1
Fig. 1
Metabolic profile of M0 and M1-like porcine alveolar-derived macrophage cell line. (a) Representative microscopic image (one out of ten) of M0 macrophages. From left to right: NAD(P)H fluorescence intensity—the scale bar indicates 50 µm and applies for all shown images; NAD(P)H fluorescence lifetime image in false colour representation ranging from 0 to 4 ns; corresponding phasor plot with enzyme vectors pointing from unbound “free” NAD(P)H to NAD(P)H bound to various enzymes, map of the allocated NAD(P)H-dependent enzymes; map of the enzyme-bound: total NAD(P)H activity in false colour representation ranging from 30 to 100%. (b) Superimposed enzyme histograms of ten FoVs, each averaged over the entire FoV with “LDH-like”, “PDH-like” and “NOX” groupings in M0 macrophages. (c) Plotted proportion of the pixel area of the assigned enzyme group in the pixel area (fraction/cell area) of the segmented M0 macrophages. (d) Averaged enzyme-bound: total NAD(P)H activity of the segmented M0 macrophages (c and d) Each gray dot represents a single cell. (e) Representative microscopic image of the enzyme map and activity map of resting M0 and LPS/IFNy polarised (M1-like) macrophages. (f) Dot plots depicting overall enzyme activity, LDH-like enzymes, PDH-like enzymes and NOX of M0 and LPS/IFNy. Each gray dot represents a single cells in one FoV while the black dots represent average over FoV (5 in 2 wells). (g) UMAP plot illustrating clusters 0, 1 and 2 (represented by goldenrod, cyan and purple respectively) within M0 and LPS/IFNy polarised macrophages. The stacked bar plot denotes the percentage distribution of cells withing each cluster in M0 and LPS/IFNy. (h) The dot plot illustrates the metabolic profiles (features) associated with each cluster. Features on the y axis and the clusters on the x axis. The increasing grey-blue gradient indicates the intensity of the metabolic profile within the cluster while the black dots denote the percentage size of cells associated with the metabolic profile within the cluster.
Fig. 2
Fig. 2
Artesunate increases LDH-like activity and decreases the overall metabolic activity of M2-like macrophages. Porcine M2-like macrophages were exposed to 1 μM of artesunate (ARS) for 24 h and evaluated using two-photon NAD(P)H-FLIM. (a) Representative microscopic image of M2-like macrophages. Left: map of the allocated NAD(P)H-dependent enzymes; right: map of the enzyme-bound: total NAD(P)H activity in false colour representation ranging from 30 to 100%. (b) Dot plots illustrating the overall metabolic activity, LDH-like, PDH-like and NOX enzyme activity respectively of IL-4 stimulated macrophages exposed to medium, DMSO and artesunate respectively. (c) The UMAP plot illustrates clusters of single cells exposed and unexposed to artesunate. Cluster 0, 1 and 2 are represented by magenta-pink, blue and brown respectively. The stacked bar plot denotes the percentage distribution of cells withing each cluster in respective conditions: Medium, DMSO and artesunate 1µM. (d) The dot plot illustrates the metabolic profiles (features) associated with each cluster. Features on the y axis and the clusters on the x axis. The increasing grey-blue gradient indicates the intensity of the metabolic profile within the cluster while the black dots denote the percentage size of cells associated with the metabolic profile within the cluster.
Fig. 3
Fig. 3
Spatially distinguishable NAD(P)H-dependent metabolic fingerprints in A. suum L3. A representative microscopic image of L3 (a) visually illustrating the NAD(P)H intensities, NAD(P)H-FLIM, phasor plots, enzyme maps and activity maps in ART unexposed larvae. The scatterplot (b) denotes NAD(P)H enzyme activity (%) with standard deviation within the pharynx (circles) and midgut (triangles) regions of larvae unexposed to ARTs. Activity was calculated as the ratio of enzyme bound NAD(P)H to total NAD(P)H; 0% indicating enzyme inactivity (only free NAD(P)H) to 100% indicating highly active, NAD(P)H completely bound to the enzymes). The plots (c) denote enzyme histograms normalized to pixel area for pharynx and midgut; grey to black show the overlapped histograms of all larvae, the magenta (pharynx) and green (midgut) bars show the average over all images with standard deviation. UMAP plot (d) illustrates the spatial distribution of the allocated bound enzymes and the enzyme-bound: total activity within the pharynx and midgut (represented by magenta dots and green triangles respectively) of ART unexposed larvae. Scale bar indicates 50 µm and applies for all shown images. Significance is represented by p < 0.0001: ****; Wilcoxon test.
Fig. 4
Fig. 4
Un-perturbed NAD(P)H-dependent metabolism in ARTs-exposed A. suum L3. A. suum L3 were exposed to 200 μM of artesunate (ARTS) and artemether (ARTM) for 24 h and evaluated using two-photon NAD(P)H-FLIM. A representative microscopic image of L3 (a) visually illustrating the NAD(P)H enzyme map and activity map in ART exposed larvae. The dot plots (b) depicting enzyme activity within the pharynx and midgut. Activity is calculated as the ratio of enzyme bound NAD(P)H to total NAD(P)H; 0% indicating enzyme inactivity (only free NAD(P)H) to 100% indicating highly active, NAD(P)H completely bound to the enzymes). Data dimension reduction was done using PCA and transformed data used for downstream analysis. The PCA biplot (c) represents the association between the clusters and the bound enzymes within PC1 and PC2. Cluster 1, 2 and 3 are represented by magenta-pink, brown and blue dots respectively whilst enzymes associated with LDH-like, PDH_like and DUOX-like enzyme activity are depicted in green, blue and red arrows and texts respectively. The UMAP plot and bar plots illustrating distribution of metabolic profiles within the pharynx (d) and midgut (e) of the larvae. Larvae exposed to artemether and artesunate at concentrations of 200- and 20 µM, DMSO and medium are represented by a star, an x marked square, a plus sign, a square, a triangle and a dot respectively. n Artesunate 200/20 µM = 38/40; n Artemether 200/20 µM = 58/40; n medium/DMSO controls = 52/60.
Fig. 5
Fig. 5
Steady state energy metabolism of high OxPhos/low anaerobe glycolysis in both Ascaris larvae and porcine M2 macrophages. NAD(P)H - FLIM detected distinct metabolically active regions in the A. suum L3. Although both regions were seen to have steady state energy metabolic profiles of high OxPhos (orange)/low anaerobe glycolysis (green), the anterior region referred to as pharynx was highly associated with oxidative burst (pink) when compared to the posterior region referred to as midgut. Similarly, the porcine M2 macrophages had a steady state energy metabolic profile of high OxPhos/low anaerobe glycolysis. Oxidative burst via NOX was however non-existent. Unlike A. suum L3, exposure to ARTs decreased the metabolic activity of porcine M2 macrophages and further induced a metabolic shift towards higher anaerobic glycolysis and lower oxidative mitochondrial metabolism.

Similar articles

References

    1. CDC. About Ascariasis | Soil-Transmitted Helminths | CDC. CDC. https://www.cdc.gov/sth/about/ascariasis.html (2024).
    1. Holland, C. et al. Global prevalence of Ascaris infection in humans (2010–2021): A systematic review and meta-analysis. Infect. Dis. Poverty11, 113 (2022). - PMC - PubMed
    1. IHME. Ascariasis—Level 4 cause | Institute for Health Metrics and Evaluation. https://www.healthdata.org/research-analysis/diseases-injuries-risks/fac... (2024).
    1. Holland, C. V. The long and winding road of Ascaris larval migration: The role of mouse models. Parasitology148, 1–9 (2021). - PMC - PubMed
    1. Nejsum, P. et al. Ascariasis is a zoonosis in Denmark. Am. Soc. Microbiol.43, 1142–1148 (2005). - PMC - PubMed

Publication types

LinkOut - more resources