. 2025 Jan 15;16(1):708.
doi: 10.1038/s41467-025-56081-9.

Syntalos: a software for precise synchronization of simultaneous multi-modal data acquisition and closed-loop interventions

Affiliations

Syntalos: a software for precise synchronization of simultaneous multi-modal data acquisition and closed-loop interventions

Matthias Klumpp et al. Nat Commun. .

Abstract

Complex experimental protocols often require multi-modal data acquisition with precisely aligned timing, as well as state- and behavior-dependent interventions. Tailored solutions are mostly restricted to individual experimental setups and lack flexibility and interoperability. We present an open-source, Linux-based integrated software solution, called 'Syntalos', for simultaneous acquisition and synchronization of data from an arbitrary number of sources, including multi-channel electrophysiological recordings and different live imaging devices, as well as closed-loop, real-time interventions with different actuators. Precisely matching timestamps for all inputs are ensured by continuous statistical analysis and correction of individual devices' timestamps. New data sources can be integrated with minimal programming skills. Data is stored in a comprehensively structured format to facilitate pooling or sharing data between different laboratories. Syntalos enables precisely synchronized multi-modal recordings as well as closed-loop interventions for multiple experimental approaches. Preliminary neuroscientific experiments on mice with different research questions show the successful performance and easy-to-learn structure of the software suite.


Conflict of interest statement

Competing interests: The authors declare no competing interests.

Figures

Fig. 1
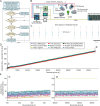
Fig. 1. Example experiment and modular design of Syntalos.
A Behavioral task, in which mice touch apertures of varying widths with their whiskers. Whisker-aperture interactions are recorded with a camera and electrophysiological data is recorded with a chronic tetrode array. Single unit spike patterns are identified offline. Spiking is aligned to the whisker touch and a classifier is trained with the spiking of several single units to predict the animal’s behavior. B If whisker touch and spikes are misaligned by systematic incremental shifts of 1 ms per second (leading to 0.5 s (middle panel) or 1 s (right panel) over the course of a 16 min long experimental session), the prediction accuracy drops to near chance levels. Additionally, the number of units whose firing correlates with whisker touch drops from 65% to 17% (pie charts, lower panels). Error bands of decoding accuracies indicate the standard error of the mean (SEM). Box plots represent the decoding accuracy in the time window ranging from trigger onset to 400 ms after trigger onset, with the respective values for each condition as median [lower quartile, upper quartile; whisker minimum, whisker maximum]: No time shift: 100 [99.12 100; 98.5 100]; 0.5 s time shift: 83 [63.38 86.12; 53.5 92.5]; 1 s time shift: 57 [52.62 60.88; 46 66]. Data is shown for 413 barrel cortex units (pooled from 6 animals). C Flowchart illustrating the logic of the behavioral-physiological experiment. This logic can be programmed in Python by the experimenter within the Syntalos Python Script module. The Python module can receive data from and send commands to the Firmata I/O module, which is an implementation of the Firmata serial interface API to ultimately control an Arduino board which reads the actual data from sensors and commands any connected effectors based on the rules programmed in the Python script. D Schematic representation of a complex example experiment. During the experiment, Syntalos will acquire a multitude of data, and perform some online analysis. The animal is recorded via a camera while it traverses a maze or any other behavior setting. The video recording is handled by a Syntalos camera module, which produces frames that are analyzed by a tracking module for their tracking information which is finally saved by the table module for later offline analysis. Electrophysiological data can be acquired by a module dedicated to the Intan hardware, while a Miniscope pipeline can be set up using the Miniscope module and a Video Recorder module to store the acquired frames for later calcium activity analysis. Icons/logos reproduced with permission (see Acknowledgements).
Fig. 2
Fig. 2. Architecture of the Syntalos engine and module run cycle.
A Shows how Syntalos manages parallelism with threads between modules. Module A runs in part in the UI thread to display for example a settings panel, and in part in a Syntalos worker thread (Thread 1) to acquire data from a DAQ device. This data is sent via a data stream to Module B, which is combined together with Module C in a different worker thread (Thread 2). Those two modules share the time provided by the given thread and are called by the event loop of Thread 2 at selected intervals. They also use a data stream to move data between two modules, as the stream itself does not care whether the modules live in the same thread. The DAQ data is also streamed to Module D, for which Thread 3 serializes communication for IPC (inter-process communication) with the actual Module D, which is written in Python and executed as a separate child process outside of the main Syntalos process. B Shows the states a module goes through during an experiment run, from left to right. The upper part (“Syntalos Module”) depicts the actions the module itself executes and the states it is in, while the lower part (“Syntalos Engine”) depicts the tasks Syntalos itself performs. The vertical arrows show communication between the two sides. Initially, when the module is created (“Initialize” phase) it submits basic information (which ports it supports etc.) to the engine. When the user runs an experiment, all modules set up their required data structures and devices in a prepare step, signal readiness to the engine and then are started at once. At that point they will also get access to the master timer, to acquire master timestamps. During the run, they will store experiment data and are monitored by the engine, until the experiment is eventually stopped and the modules finalizes its data and possibly state of a device that it manages. Icons/logos reproduced with permission (see Acknowledgements).
Fig. 3
Fig. 3. Timestamps assigned by Syntalos for various devices.
A Flow diagram of how Syntalos will adjust new timestamps to fall back in line with previous ones, even if two clocks of separate devices diverge in time [detailed explanation is in results text]. B Experimental setup to test the performance and accuracy of synchronization. In this configuration, various devices were used and synchronized by Syntalos: a standard USB UVC (Universal Video Capture) webcam (25 Hz sampling rate), a scientific camera (Basler, 25 Hz sampling rate), two identical scientific cameras (The Imaging Source, 60 Hz sampling rate), one controlled by a dedicated Syntalos module (TIS Camera), the other using the generic GenICam module (TIS GenICam), a UCLA Miniscope (sampling rate 30 Hz), an Intan RHD2000 electrophysiology USB interface board (sampling rate 20 kHz), an Arduino Firmata I/O serial interface connected via USB, and a Raspberry Pi Pico microcontroller connected via USB. The TIS Camera, UVC webcam and the Miniscope have no own independent clocks for timestamping individual frames and are time-synchronized by Syntalos based on driver timestamps. The Arduino and the Pi Pico devices are not time-synchronized in a strict sense but obtains their timestamps directly from Syntalos’ own Master clock. The Intan USB interface board is time synchronized but runs its own internal clock. For the experiment, a signal generator produces 3.3 V positive, 240 ms long square waves every second. This signal is directly fed into the Arduino, the Pi Pico, and Intan digital input port for sampling, while the cameras record an LED connected to the same signal line. C Recorded relative time points of the frames (or samples) in which the voltage signal produced by the CED board (or the LED light) is detected. D Time deviation of the recorded timestamps from the expected time points. Note that the external signal generator clock of the Intan device is slightly slower than the other clocks which adds up to an error of approximately 150 ms after 24 h of recording. Additionally, the Intan internal clock is also faster than the computer clock. The step-like characteristics of the UVC webcam and the fluctuating signals from the other devices are due to the respective frame rates and aliasing effects. Note that due to temperature fluctuations at the beginning of the recording, the computer clock fluctuates with respect to the Intan clock. E Close-up of an early time point (indicated by 1 in panel D) and a late time point (indicated by 2 in panel D) of the recording. Icons/logos reproduced with permission (see Acknowledgements).
Fig. 4
Fig. 4. Synchronization performance.
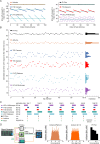
A Fluctuation of the mean detected onset times. Signals in panel D of Fig. 3 were low-pass filtered and deviations from the linear interpolation between the first 10 s to the last 10 s of recordings are displayed. Note that the devices (except from the original, uncorrected Intan data) fluctuate together, indicating that synchronization is accurate even if the internal clock speed varies. This variation is likely due to a combination of temperature shifts and workload differences of the computer. B Timestamps of the various devices relative to the low-pass filtered timestamps of the TIS camera (fastest device directly controlled by Syntalos). Left panel is from the time region marked as ‘1’ in panel A and right panel from the time region marked as ‘2’. C Distributions of the data depicted in B. The timestamps of the devices stay within their expected range i.e. within their frame rate limits. Intan timestamps fluctuate within a full range of 2 ms which are the limits of the Syntalos synchronization margin. Mean value deviation stays well below 1 ms (see Results section). D Sampling intervals of the Syntalos-synchronized Intan recordings depicted over recording time. Constant sampling intervals are assigned by Syntalos for periods of ≥24 s based on time differences between the computer clock and timestamps from Intan. Assigned sampling intervals fluctuate around the expected value of 50 µs (i.e. 20 kHz, dashed gray line) by ±5 ns. Mean value is 49.9998 µs (red line), due to slight differences in clock speed between the computer and Intan. E Quantification of the corrected sampling intervals. Left panel: distribution of the assigned sampling intervals for the data shown in D. Right panel: distribution of the duration of the step-wise correction of sampling intervals. The minimum duration for which constant sampling intervals are assigned is 24 s, a value determined by Syntalos based on the device type and sampling frequency.
Fig. 5
Fig. 5. Estimated start time of the devices upon multiple starts of a Syntalos recording.
The same Syntalos project configuration is started 60 times and the timestamps are evaluated over 10 min. A Example plots for the first 150 stimuli of a synchronization experiment. Times are depicted relative to the Intan time (highest sampling rate). As Syntalos and the independent clock of the signal generator are not synchronized, the first detected event occurs at a random time point (red circle). Sampling rate of the devices are not exact multiples of one second such that the relative detection onset times shift over time and are reset when the difference gets larger than one frame (especially well visible for the TIS camera and the UVC webcam). The exact start time of the device by Syntalos can be estimated by averaging the relative onset times (red line). B Scatter plots (left) and histograms (right) of the estimated start times of the devices with respect to the Intan recording (highest sampling rate). The start times of the different devices differ by up to ~40 ms. The jitter of the start times, however, is much smaller (~3 ms) well below the sampling intervals of the devices. C Sampling windows of different devices for seven trials. Due to the correction of offsets (shown in B) all sampling windows fall onto the correct time of a LED-emitted light signal (thin vertical line in each trial). D Roundtrip latencies for closed-loop experiments. Left panel: Schematic representation of the latency test. Signal generator sends an input pulse to the Pi Pico or Arduino, respectively. After detection, an output pulse is generated. The time lag between input- and output pulses is detected via Intan by Syntalos. Right panels: Distribution of the input-output latency for the Pi Pico running MicroPython, the Arduino board controlled by a Python script in Syntalos, and the Arduino board controlled by a module written in C++. Icons/logos reproduced with permission (see Acknowledgements).
Fig. 6
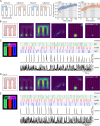
Fig. 6. Example application of a behavioral experiment with simultaneous recording of calcium signals with an UCLA Miniscope.
A M-maze rules for successful trials and learning curves for inbound (left) and outbound (right) trials over several days. B Experiment day 2, example analysis. First panel depicts the trajectory of the animal. Second panel: probability to find the animal at a certain location. Note that the animal spends more time at the reward points than on the different tracks/arms. Third panel: animal speed; in line with the previous panel. The speed in highest in the straight arms and lowest at the reward points Fourth panel: maximum intensity projection of the calcium imaging. Cells that were active during the experiment are visible in the image. Fifth panel: Conditional firing probability of the cell outlined in the previous panel. The cell is a place cell that is specific to the reward point at the middle arm. Last panel: mutual Shannon information of the location and the activity of the cell. C Visualization of the trajectory of the animal and the calcium signal. Left panel: color coding of the individual sections of the M-maze. Linear coordinates are additionally assigned to each arm. Right panel: linear coordinates of the animals position (three upper panels), the ‘raw’ calcium signal (quantified by Minian after motion correction and ROI assignment) of the cell highlighted in B, and the speed of the animal (two lower panels). Note that the cell is activated when the animal enters the reward location in the middle arm. D and E similar to B and C but on experimental day 4. Note that the cell from day 2 is also active on day 4 and has the same firing field and information content.

References

    1. Jensen, H. J. Self-Organized Criticality: Emergent Complex Behavior in Physical and Biological Systems (Cambridge University Press, 1998).
    1. Kim, C. Y., Kim, S. J. & Kloosterman, F. Simultaneous Cellular Imaging, Electrical Recording and Stimulation of Hippocampal Activity in Freely Behaving Mice. Exp. Neurobiol.31, 208–220 (2022). - PMC - PubMed
    1. Karimi Abadchi, J., Rezaei, Z., Knopfel, T., McNaughton, B. L. & Mohajerani, M. H. Inhibition is a prevalent mode of activity in the neocortex around awake hippocampal ripples in mice. Elife12, e79513 (2023). - PMC - PubMed
    1. Jadhav, S. P., Rothschild, G., Roumis, D. K. & Frank, L. M. Coordinated Excitation and Inhibition of Prefrontal Ensembles during Awake Hippocampal Sharp-Wave Ripple Events. Neuron90, 113–127 (2016). - PMC - PubMed
    1. Asth, L., Lobão-Soares, B., André, E., Soares, V. D. P. & Gavioli, E. C. The elevated T-maze task as an animal model to simultaneously investigate the effects of drugs on long-term memory and anxiety in mice. Brain Res. Bull.87, 526–533 (2012). - PubMed

LinkOut - more resources