. 2025 Feb;638(8050):469-478.
doi: 10.1038/s41586-024-08361-5. Epub 2025 Jan 15.

Specification of claustro-amygdalar and palaeocortical neurons and circuits

Affiliations

Specification of claustro-amygdalar and palaeocortical neurons and circuits

Navjot Kaur et al. Nature. 2025 Feb.

Abstract

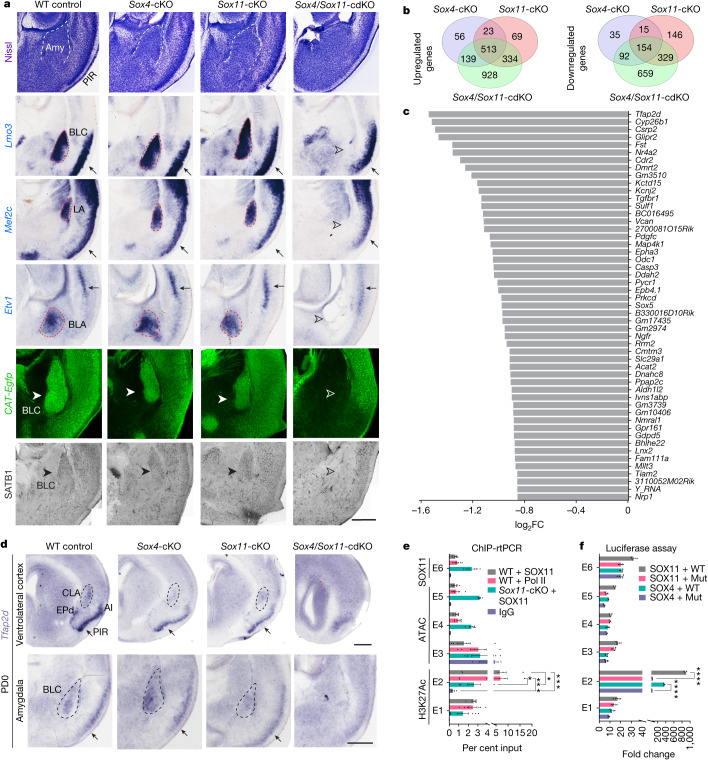
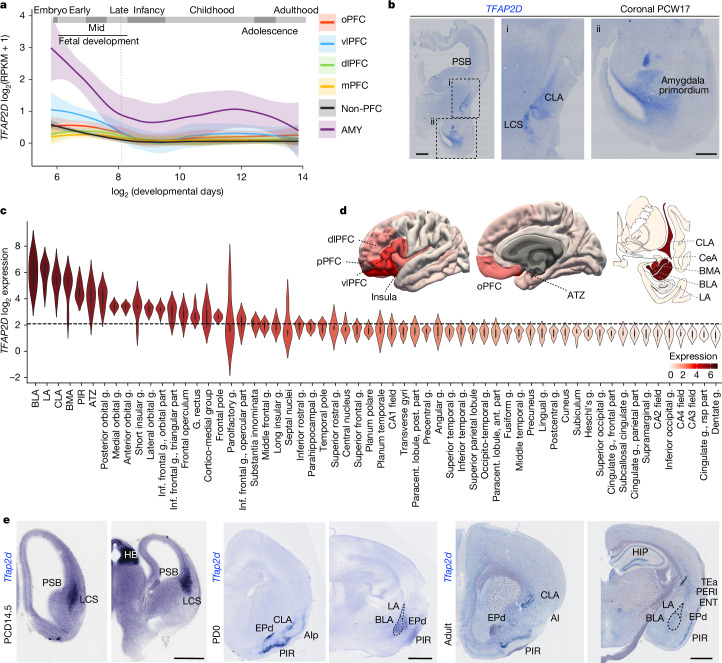
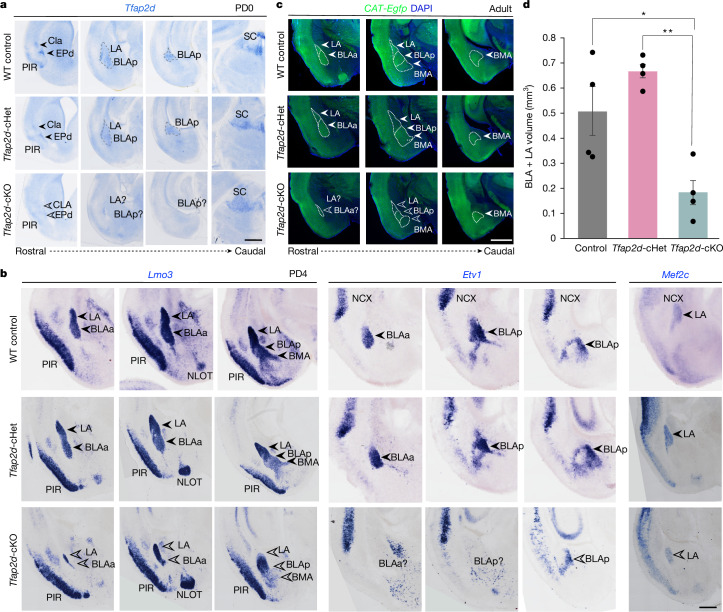
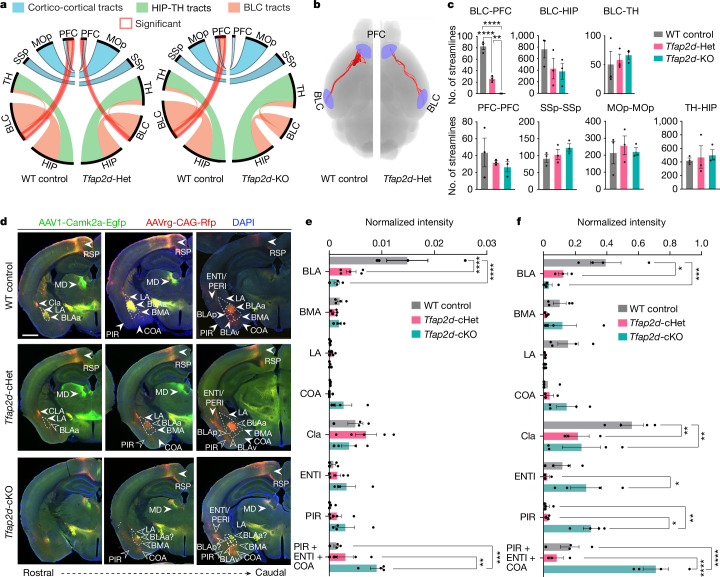
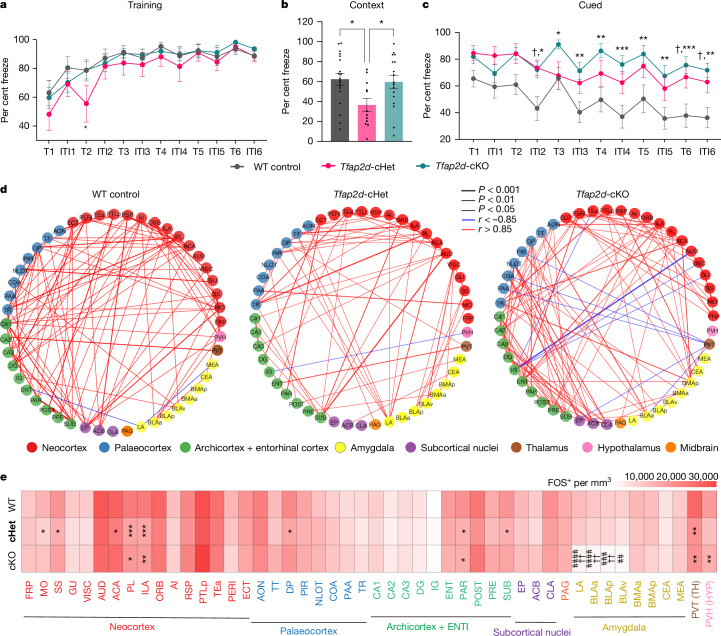
The ventrolateral pallial (VLp) excitatory neurons in the claustro-amygdalar complex and piriform cortex (PIR; which forms part of the palaeocortex) form reciprocal connections with the prefrontal cortex (PFC), integrating cognitive and sensory information that results in adaptive behaviours1-5. Early-life disruptions in these circuits are linked to neuropsychiatric disorders4-8, highlighting the importance of understanding their development. Here we reveal that the transcription factors SOX4, SOX11 and TFAP2D have a pivotal role in the development, identity and PFC connectivity of these excitatory neurons. The absence of SOX4 and SOX11 in post-mitotic excitatory neurons results in a marked reduction in the size of the basolateral amygdala complex (BLC), claustrum (CLA) and PIR. These transcription factors control BLC formation through direct regulation of Tfap2d expression. Cross-species analyses, including in humans, identified conserved Tfap2d expression in developing excitatory neurons of BLC, CLA, PIR and the associated transitional areas of the frontal, insular and temporal cortex. Although the loss and haploinsufficiency of Tfap2d yield similar alterations in learned threat-response behaviours, differences emerge in the phenotypes at different Tfap2d dosages, particularly in terms of changes observed in BLC size and BLC-PFC connectivity. This underscores the importance of Tfap2d dosage in orchestrating developmental shifts in BLC-PFC connectivity and behavioural modifications that resemble symptoms of neuropsychiatric disorders. Together, these findings reveal key elements of a conserved gene regulatory network that shapes the development and function of crucial VLp excitatory neurons and their PFC connectivity and offer insights into their evolution and alterations in neuropsychiatric disorders.


Conflict of interest statement

Competing interests: The authors declare no competing interests.

Figures

Fig. 1
Fig. 1. Regulation of VLp development and Tfap2d expression by SOX4 and SOX11.
a, Coronal sections from VLp of mouse brains from wild-type (WT), Sox4-cKO, Sox11-cKO and Sox4/Sox11-cdKO mice. Nissl staining highlights the BLC. In situ hybridization for Lmo3, Mef2c and Etv1 marks BLC, LA and BLA, whereas GFP and SATB1 immunostaining labels BLC. White and black filled arrowheads highlight normal phenotypes and open arrowheads highlight defective phenotypes. Scale bar, 200 μm. b, Intersection of differentially expressed genes in Sox4-cKO, Sox11-cKO and Sox4/Sox11-cdKO cortex and amygdala compared with controls (n = 3 per genotype). c, Top 50 genes with decreased expression in Sox4/Sox11-cdKO samples over Sox4-cKO, Sox11-cKO and control samples. FC, fold change. d, In situ hybridization for Tfap2d in the VLp of control, Sox4-cKO, Sox11-cKO and Sox4/Sox11-cdKO brains. Scale bars, 500 μm. e, Quantitative PCR showing the percentage of input of six potential Tfap2d enhancers (E1–E6) after ChIP on PCD15.5 wild-type and Sox11-cKO cortices, targeting IgG, SOX11 or Pol II. Two-way ANOVA with multiple comparisons and Tukey’s correction. Data are mean ± s.e.m. WT + SOX11 immunoprecipitation versus IgG: P = 0.0006; WT + Pol II immunoprecipitation versus IgG: P = 0.0003; WT + SOX11 immunoprecipitation versus Sox11-cKO: P = 0.033; WT + Pol II immunoprecipitation versus Sox11-cKO: P = 0.018. SOX11 and Pol II: n = 6; IgG: n = 3. f, Luciferase activity driven by the Tfap2d enhancers E1–E6 and mutants (Mut) for SOX4 and SOX11 binding sites in the presence SOX4 or SOX11 as measured by firefly luciferase/Renilla luciferase ratio. Data are normalized to enhancer activity in the absence of SOX4 or SOX11. Two-way ANOVA with Tukey’s correction. Data are mean ± s.e.m. n = 3 per condition. Detailed statistics are presented in Supplementary Table 6. AI, anterior insula; Amy, amygdala; EPd, EP, dorsal part. ****P < 0.0001. In a,d, slanted arrows point to PIR; horizontal arrows point to neocortex; and hollow arrowheads point to loss of BLC in Sox4/Sox11-cdKO.
Fig. 2
Fig. 2. Conserved expression pattern of TFAP2D in human and mouse brain.
a, Expression of TFAP2D across developmental ages in the human amygdala (AMY), orbital PFC (oPFC), ventral PFC (vPFC), dorsolateral PFC (dlPFC), medial PFC (mPFC) and non-PFC,. Data are mean ± s.e.m. b, Coronal section of a human brain at PCW17, showing the expression of TFAP2D in the LCS, CLA and amygdala primordium. Scale bars, 2 mm (left), 1 mm (right). c, TFAP2D expression pattern across frontal cortical regions, VLp and subcortical regions in adult human brain as derived from publicly available microarray data. The dashed line represents the mean of TFAP2D expression across all regions represented here. Ant., anterior; g., gyrus; inf., inferior; paracent., paracentral; post., posterior; rsp., retrospinal. d, Human brain images showing TFAP2D expression gradients across the adult brain. Correspondence between the Desikan–Killiany atlas and the Allen Brain Atlas probes was used to visualize TFAP2D expression. Subcortical regions were visualized using data from http://atlas.brain-map.org. ATZ, amygdalohippocampal transition zone; CEA, central nucleus of the amygdala. e, In situ hybridization for Tfap2d in coronal sections of wild-type mice at PCD14.5, PD0 and in adult. Scale bars, 200 μm. AIp, AI, posterior part; ENTI, entorhinal cortex; HB, habenula; HIP, hippocampus; PERI, perirhinal cortex; pPFC, polar PFC.
Fig. 3
Fig. 3. Post-mitotic deletion of Tfap2d in cerebral excitatory neurons leads to reduced BLC.
a, Coronal sections of wild-type control Tfap2d-cHet and Tfap2d-cKO mice, demonstrating that the specificity of deletion of Tfap2d expression is reduced in the VLp (encompassing CLA, EPd, PIR and BLC) but not in the SC in the midbrain. Scale bar, 500 μm. BLAp, BLA, posterior part; SC, superior colliculus. b, In situ hybridization for Lmo3, Etv1 and Mef2c in coronal sections of wild-type control, Tfap2d-cHet and Tfap2d-cKO VLp at PD4. Scale bar, 500 μm. NCX, neocortex; NLOT, nucleus of lateral olfactory tract. c, Coronal sections of adult wild-type control, Tfap2d-cHet and Tfap2d-cKO VLp showing the cytoarchitecture of the brain in adults. Scale bar, 1 mm. BLAa, BLA, anterior part. In ac, white and black filled arrowheads highlight normal Tfap2d expression and open arrowheads highlight loss of Tfap2d expression. d, Stereological measurements of the combined volume of BLA and LA in adult wild-type control, Tfap2d-cHet and Tfap2d-cKO brains. Data are mean ± s.e.m. Two-way ANOVA with Tukey’s correction. **P = 0.0022, *P = 0.024; n = 4 per genotype. Detailed statistics are presented in Supplementary Table 7.
Fig. 4
Fig. 4. Tfap2d loss or haploinsufficiency alters connections between BLC and PFC.
a, Streamlines generated as a connectivity measurement between the BLC and mPFC, HIP and TH at PD120–PD180 in Tfap2d-KO mice using DTI (n = 3 per genotype). MOp, primary motor cortex; SSp, primary somatosensory cortex. b, Visualization of streams connecting the BLC and mPFC in wild-type control and Tfap2d-Het brains. c, Number of streamlines between BLC and mPFC, HIP and TH and between contralateral cortical areas in wild-type control, Tfap2d-Het and Tfap2d-KO mice. One-way ANOVA with Bonferroni’s multiple comparisons test. ****P < 0.0001, **P = 0.0074; n = 3 per genotype. d, Representative images of wild-type control, Tfap2d-cHet and Tfap2d-cKO brains with efferent and afferent projections traced from the mPFC using AAV1-Camk2a-Egfp (anterograde) and AAVrg-CAG-Rfp (retrograde) at PD90. Open arrowheads indicate reduced or misdirected projections from and to the mPFC; filled arrowheads indicate typical projection pattern from mPFC. Scale bar, 500 μm. BLAv, BLA, ventral; MD, mediodorsal nucleus of the TH; RSP, retrosplenial cortex. e,f, Normalized intensity of retrograde tracings (e; AAVrg-CAG-Rfp labelling in d) and anterograde tracings (f; AAV1-Camk2a-Egfp labelling in d) in VLp, including BLC, CLA, COA, PIR and ENTI/PERI in wild-type control, Tfap2d-cKO and Tfap2d-cHet mice. Data are mean ± s.e.m. Two-way ANOVA with Tukey’s correction. e, PIR + ENTI + COA, Tfap2d-cHet versus Tfap2d-cKO: **P = 0.0028. ***P = 0.0002; ****P < 0.0001. n = 4 (wild type), 5 (cHet) and 4 (cKO) mice. f, BLA, wild type versus Tfap2d-cHet: *P = 0.0129; ENTI, Tfap2d-cHet versus Tfap2d-cKO: *P = 0.025; PIR, Tfap2d-cHet versus Tfap2d-cKO: *P = 0.0115; Cla, wild type versus Tfap2d-cHet: **P = 0.0012; Cla, wild type versus Tfap2d-cKO: **P = 0.0011; PIR, wild type versus Tfap2d-cHet: **P = 0.0051. ***P = 0.0002; ****P < 0.0001. n = 4 (wild type), 3 (cHet) and 4 (cKO). Detailed statistics are presented in Supplementary Table 8.
Fig. 5
Fig. 5. Tfap2d loss or haploinsufficiency increases threat responding in learned behaviours and alters functional connectivity.
a, The percentage of time wild-type control, Tfap2d-cHet and Tfap2d-cKO mice freeze during the learning (training) period of the fear conditioning test during inter-tone interval (ITI) and tone (75 decibels, 20 s) (T) followed by a 2-s shock at 0.5 mA. b, The percentage of time wild-type control, Tfap2d-cHet and Tfap2d-cKO mice freeze during conditioned responses while in the training context. One-way ANOVA with Tukey’s correction. *P < 0.05. c, The percentage of time wild-type control, Tfap2d-cHet and Tfap2d-cKO mice freeze during trial and ITI without shock during cued responses. Data are mean ± s.e.m. Two-way ANOVA with repeated measures and multiple comparison Tukey’s correction. ***P < 0.001, **P < 0.01, *P < 0.05 for wild type versus Tfap2d-cKO; P < 0.05 for wild type versus Tfap2d-cHet. n = 16 (wild-type control), 12 (Tfap2d-cHet) and 16 (Tfap2d-cKO). Detailed statistics are presented in Supplementary Table 9. d, Network graph depicting interregional correlation between brain regions as measured by the number of FOS-positive cells in wild-type control, Tfap2d-cHet and Tfap2d-cKO brains. Nodes, represent brain regions, edges indicate significant correlation scores (P < 0.05 and r > 0.85) and colours correspond to broader brain areas. Detailed statistics are presented in Supplementary Table 10. e, Heat map depicting the number of FOS-positive cells detected per unit area in the different brain regions of the wild-type control, Tfap2d-cHet and Tfap2d-cKO brains isolated after 60–90 min of cued test. Data are mean ± s.e.m. Two-way ANOVA with Tukey’s correction. ***P < 0.001, **P < 0.01, *P < 0.05 for n = 4 per genotype. LA, BLAa, BLAp and BLAv, wild type versus Tfap2d-cKO: ####P < 0.0001, ###P < 0.001, ##P < 0.01. Tfap2d-cHet versus Tfap2d-cKO: ††P < 0.01. Detailed statistics are presented in Supplementary Table 11. Brain region abbreviations for d,e are listed in Supplementary Table 4.
Extended Data Fig. 1
Extended Data Fig. 1. Loss of Sox4 and Sox11 disrupts laminar organization and axonal projections of cortical excitatory neurons.
a) Serial sections of control, Sox4-cKO, Sox11-cKO and Sox4; Sox11-cdKO mice brains at PD 0. Filled arrows point to normal phenotype and open arrowhead point to defective phenotypes in the knockouts. b) Representative images illustrate immunostaining for CUX1 and BCL11B in the cerebral cortex, highlighting disrupted laminar organization and decreased density nuclei with pronounced BCL11B immunosignal in the Sox4; Sox11-cdKO brains, in contrast to control, Sox4-cKO, and Sox11-cKO samples. AC, anterior commissure; CC, corpus callosum; CP, cerebral peduncles; CST, corticospinal tract; CTA, corticothalamic axons; HC, hippocampal commissure; HIP, hippocampus; IC, internal capsule; L, layer.
Extended Data Fig. 2
Extended Data Fig. 2. Sox4 and Sox11 orchestrate VLC formation by regulating Tfap2d expression for cell survival, and development of VLp.
a) Coronal sections of the in situ hybridization for Cyp26b1 (upper panel) and immunostaining for NR4A2 validating their downregulation in the ventrolateral cortical structures- including BLC, CLA, and ENTI in Sox4; Sox11-cdKO as compared to control, Sox4-cKO, and Sox11-cKO brains. In all genotypes, Cyp26b1 expression is robust in the CEA, the GABAergic inhibitory center of amygdala. b) Bar graph showing top 50 genes that have increased in expression in Sox4; Sox11-cdKO samples as compared to Sox4-cKO, Sox11-cKO and control within cortex and amygdala at PD 0. c) Representative images showing the immunostaining for GFAP and IBA1 along with TUNEL assay to depict the cell damage, astrocytes and microglia invasion in the Sox4; Sox11-cdKO as compared to the control and Sox4-cKO, Sox11-cKO cortices at PD 0. CEA, central nucleus of the amygdala; CLA, claustrum; ENTI, entorhinal cortex; LA, lateral nucleus of the amygdala. d) Line graphs showing the forebrain H3K27ac and ATAC peaks and SOX11 ChIP-seq sites from ages PCD 11-16, and PD 0 at the Tfap2d genomic locus ATAC peaks from heart (bottom tract) samples depict that the mechanism is forebrain specific. The blue boxes highlight putative enhancers (E) harboring predicted binding sites for SOX11, spanning from E1 to E6, with ChIP-seq confirmation of binding specifically within E6. e) Validation of the anti-SOX11 antibody involved examining coronal sections of PDC 15.5 brains. In WT control brains, SOX11 immunostaining (red) was observed, while in the SOX11-cKO, expression from all GFP+ excitatory neurons was lost (indicated by open arrowheads). Filled arrowheads point to SOX11 immunopositive nuclei within the cortical plate and in SVZ. ATAC; Assay for Transposase-Accessible Chromatin. SVZ, subventricular zone; VZ, ventricular zone; WT, wildtype.
Extended Data Fig. 3
Extended Data Fig. 3. Loss of SOX4 and SOX11 leads to extensive premature apoptosis in the LCS and VLp.
a) Quantifications of the cleaved caspase3 (CC3)- and ADGRE1-immunopositive cells compared to the DAPI-positive cells in the LCS, BLC and PIR of the WT controls, Sox4-cKO, Sox11-cKO and Sox4; Sox11-cdKO. The data is normalized to the WT controls. Two-way ANOVA with multiple comparisons and Tukey’s correction was applied. Mean ± s.e.m. depicted. ****, **, * represents P < 0.0001, 0.01, 0.05 respectively. n = 3/genotype. b) Coronal sections from the ventrolateral cortical region of WT controls, Sox4-cKO, Sox11-cKO and Sox4; Sox11-cdKO mice brains at PCD 16.5. The LCS, BLC and PIR are depicted using RNAscope for Tbr1, Ngn2, and Sema5a. Filled arrowheads point to normal phenotypes and open arrowheads point to defective phenotypes in the knockouts. c) Quantifications of the expression of Tbr1, Ngn2 and Sema5a over DAPI in the LCS, BLC and PIR. Two-way ANOVA with multiple comparisons and Tukey’s correction was applied. Mean ± s.e.m. depicted. ***, **,* represents P value < 0.001, 0.01, 0.05, respectively. n = 3/genotype. d) Coronal sections from the ventrolateral cortical region of WT controls, Sox4-cKO, Sox11-cKO and Sox4; Sox11-cdKO mice brains at PCD 16.5 stained for BHLHE22. Filled arrowheads point to normal phenotype and open arrowhead point to defective phenotypes in the knockouts. e) Quantifications of the expression of BHLHE22 over DAPI in the BLC and PIR. Two-way ANOVA with multiple comparisons and Tukey’s correction was applied. Mean ± s.e.m. depicted. **, * represents P value < 0.01 and 0.05, respectively. n = 3/genotype. For detailed statistics, please see Supplementary Table 12.
Extended Data Fig. 4
Extended Data Fig. 4. Expression of TFAP2D in the human brain.
a) TFAP2D expression pattern across frontal cortical regions, ventrolateral cortical structures, and subcortical regions in prenatal human brain. The dotted line represents the mean of TFAP2D expression across all the regions represented here. X-axis depicts the regions and y-axis depicts the log 2 value for the expression pattern. b) Barplot showing the expression of TFAP2D in the claustrum, amygdala, striatum and neocortex detected by dd-PCR in adult human tissue (n = 3). c) Violin plot generated using publicly snRNA-seq available data showing TFAP2D, SOX4, and SOX11 expression in the ExNs (Excitatory neurons) of the human amygdala with highest enrichment in the Excit_B class. y-axis depict the log2 expression values and x-axis depicts the different classes of neurons within the human amygdala. d) Dot plot showing the percentage of cells that express the top 30 genes within the Excit_B class. Color represents the average expression level and size of the circle represents the percentage of cells. For detailed statistics, please see Supplementary Table 13.
Extended Data Fig. 5
Extended Data Fig. 5. Expression of Tfap2d in the macaque and mouse brain.
a) Plot of TFAP2D expression across developmental ages in the macaque AMY, OFC, DFC, VFC, MFC and nonPFC areas within the forebrain,. Mean ± s.e.m depicted. b) Coronal section of a macaque brain at PCD 105 showing TFAP2D expression in the LCS, and amygdala primordium detected by in situ hybridization. c) Representative serial coronal sections showing Tfap2d expression within wildtype mouse PCD 14.5, PD 0 and adult brains detected by in situ hybridization. At PCD 14.5, Tfap2d expression is restricted to the LCS and Hb primordium. At PD 0 and in adults Tfap2d expression is seen in the BLC, CLA, EPd, EPv PIR, and SC. In adults, deep layer neurons in the AUD, GUS, and TEA show sporadic expression of Tfap2d. Representative images from this panel are used in Fig. 2e. d-e) UMAP showing the subclasses of glutamatergic neurons in the adult mouse cerebrum (left) and the expression of Tfap2d within the subclasses representing the BLC, PIR, AON, CLA. f) Coronal sections of the E17 chicken brain showing Tfap2d (red) expression in the nidopallium and arcopallial amygdala detected by RNAscope. AA, arcopallium amygdala; AON, anterior olfactory nucleus; AUD, auditory cortex; EPv, EP, ventral part; GUS, gustatory cortex; H, hyperpallium; LGE, lateral ganglionic eminence; M, mesopallium; MGE, medial ganglionic eminence; N, nidopallium; SC, superior colliculus; Se, septum; Str, striatum.
Extended Data Fig. 6
Extended Data Fig. 6. Conserved Tfap2d expression in BLC excitatory neurons across mammalian and non-mammalian Species.
a-d) Dot plot annotations showing the expression of Sox11, Sox4 and Tfap2d within 1) the major amygdala cell types in all species, 2) the amygdala nuclei in human, macaque, mouse (space annotations), and 3) ExN clusters within the BLC in human, macaque, mouse and within the caudal dorso-ventral ridge (DVR) of chicken, region homologous to mammalian amygdala. In all species, Tfap2d exhibited high expression in ExN within the amygdala. IA, intercalated cell masses; InN, Inhibitory neurons; MEA, medial nucleus of the amygdala; OPC, oligodendrocyte progenitor cells; PL, paralaminar nucleus of the amygdala.
Extended Data Fig. 7
Extended Data Fig. 7. Profiling of Sox4, Sox11 and Tfap2d expression in BLC excitatory neurons subclusters across mammalian and non-mammalian species.
a-d) Dot plot annotations showing the top 10 genes marker genes expressed by the ExN clusters Sox11, Sox4 and Tfap2d within human, macaque, mouse and chicken.
Extended Data Fig. 8
Extended Data Fig. 8. Conservation analysis of Tfap2d-associated enhancers across species.
a) Heatmap illustrating the pairwise alignment distances between various species of vertebrates for the six putative enhancers within the Tfap2d locus. X indicates the absence of orthologous sequence. b) Line graph for three SOX11 binding sites within the Tfap2d-E2 enhancer depicting their conservation across species using MULTIZ alignment. c) Line graph displaying the mouse E2 enhancer and the putative human E2 enhancer, obtained through lift-over of the human genome (hg38). Predictions for SOX4 and SOX11 binding sites are included, based on JASPAR 2022 and 2024 release.
Extended Data Fig. 9
Extended Data Fig. 9. Whole-body knockout of Tfap2d results in BLC deficits.
a) Schematic depicting the Tfap2d WT allele and the KO allele with the insertion of LacZ cassette within the exon (Ex) 1. b) Coronal sections of the ventrolateral pallial regions of the WT control, Tfap2d-Het and Tfap2d-KO brains showing the expression of Lmo3, Etv1 and Mef2c by in situ hybridizations and NR4A2 by immunostaining at PD 4. Reduction in the size of BLC is seen by Lmo3, the most affected region is the Etv1 labelled BLA. c) Nissl staining of the coronal sections of the adult WT control, Tfap2d-Het and Tfap2d-KO brains. d) Coronal sections of the ventrolateral cortical regions of the adult WT control, Tfap2d-Het and Tfap2d-KO brains showing the AChE staining used to label the BLA. e) Stereological measurements of the volume of LA and BLA in the adult WT control, Tfap2d-Het and Tfap2d-KO brains. Mean ± s.e.m. depicted. Two-way ANOVA with Tukey’s correction was applied. ** and * represents p values < 0.01, <0.05 respectively. n = 5 (WT), 6 (Het), 7 (KO). For detailed statistics, please see Supplementary Table 14.
Extended Data Fig. 10
Extended Data Fig. 10. Development of floxed Tfap2d allele for conditional post-mitotic deletion of Tfap2d in cerebral excitatory neurons that leads to BLC formation deficits.
a) Schematic depicting the Tfap2d wildtype allele (above) and the floxed allele (below) carrying the insertion of flox (fl) cassettes within intron (In) 1 and In 3 of the Tfap2d locus. The regions amplified by PCR using genotyping primers are indicated. b) Genotyping agarose gel showing the sizes of the amplified PCR products that can distinguish the fl/fl, fl/+ and +/+ genotypes. c) Serial coronal sections of WT control, Tfap2d-cHet and Tfap2d-cKO brains at PD 0 showing reduced expression of Tfap2d in the ventrolateral pallial structures (CLA, EPd, PIR, BLC) but not in the midbrain (SC, superior colliculus) of cKO mice. Representative images from this panel are also used in Fig. 3a. d) Serial sections of the WT control, Tfap2d-cHet and Tfap2d-cKO brains at PD 0 depicting their gross morphology via visualization of GFP expression driven by the Neurod6 (Nex1)-Cre driver. e) Immunostaining showing the expression of TBR1 and SATB1 in the WT control, Tfap2d-cHet and Tfap2d-cKO brains at PD 0, highlighting the deficits seen in the BLC. f) Immunostaining showing the expression of NR4A2 in the CLA of WT control, Tfap2d-cHet and Tfap2d-cKO brains at PD 0. Filled arrows indicate normal morphology whereas open arrows indicated altered BLC structure.
Extended Data Fig. 11
Extended Data Fig. 11. Loss of Tfap2d leads to premature apoptosis in the LCS and VLp downstream of Sox4 and Sox11.
a) Quantifications of the CC3-positive and ADGRE1-positive cells over the DAPI-positive cells detected in the LCS, BLC and PIR of the WT controls, Tfap2d-cHET, and Tfap2d-cKO. The data is normalized to the WT controls. Two-way ANOVA with multiple comparisons and Tukey’s correction was applied. Mean ± s.e.m. depicted. **, * represents P < 0.01, 0.05. n = 4 (WT), 3(cHET), 6(cKO) for CC3 and 4(WT), 3(cHET) and 5(cKO) for ADGRE1. b) Coronal sections from the ventrolateral cortical region of WT controls, Tfap2d-cHET, and Tfap2d-cKO mice brains at PCD 16.5. The LCS, BLC and PIR are depicted using RNAscope for Tbr1, Ngn2, and Sema5a. Filled arrowheads point to normal phenotype and open arrowhead point to defective phenotypes in the knockouts. c) Quantifications of the expression of Tbr1, Ngn2 and Sema5a over DAPI in the LCS, BLC and PIR. Two-way ANOVA with multiple comparisons and Tukey’s correction was applied. Mean ± s.e.m. depicted. **, * represents P < 0.01, 0.05. n = 3 (WT), 4(cHET), 4(cKO) for Tbr1 and 3(WT), 4(cHET) and 3(cKO) for Sema5a and Ngn2. d) Coronal sections from WT controls, Tfap2d-cHET, and Tfap2d-cKO mice brains at PCD 16.5 stained for BHLHE22. Filled arrowheads point to normal phenotype and open arrowhead point to defective phenotypes in the knockouts. e) Quantifications of the BHLHE22 intensity per bin normalized to total intensity with PIR. Two-way ANOVA with multiple comparisons and Tukey’s correction was applied. Mean ± s.e.m. depicted. Pinteraction < 0.0001 n = 8 (WT), 6(cHET), 10(cKO). f) Quantifications of the BHLHE22 intensity per 50 bins normalized to total intensity with PIR. Two-way ANOVA with multiple comparisons and Tukey’s correction was applied. Mean ± s.e.m. depicted. ***, ** represents P value < 0.001, 0.01. n = 8 (WT), 6(cHET), 10(cKO). g) Quantifications of the BHLHE22 ExNs over the DAPI-positive cells detected in the BLC and PIR of the WT controls, Tfap2d-cHET, and Tfap2d-cKO. Two-way ANOVA with multiple comparisons and Tukey’s correction was applied. Mean ± s.e.m. depicted. **, * represents P < 0.01, 0.05. n = 4 (WT), 3 (cHET), 5 (cKO). h) Coronal sections from Sox4 fl/fl; Sox11 fl/fl mice brains at PCD 16.5 stained for GFP, CC3 and ADGRE1 that were injected with p Neurod1-Cre and pCalnl-Gfp (negative control) or pCalnl-Tfap2d-ires-Gfp (Tfap2d rescue) at PCD 12.5 by in utero electroporation. Open arrowheads point to CC3 positive dying cells whereas filled arrowheads point to the GFP positive cells migrating along the LCS and reaching BLC. Double empty arrowheads point to CC3 and GFP positive dying cells in the adjacent cortex i) Quantifications of the CC3 positive and ADGRE1 positive cells over the GFP positive cells detected in the LCS, BLC, PIR and ventrolateral cortical regions (AUD/GUS + TEA). The data is normalized to the GFP positive cells seen in the negative controls. Multiple unpaired two-tailed t-test was applied. Mean ± s.e.m. depicted. **, * represents P < 0.01, 0.05. n = 3 (negative control), n = 4 (Tfap2d rescue). For detailed statistics, please see Supplementary Table 15.
Extended Data Fig. 12
Extended Data Fig. 12. Tfap2d loss or haploinsufficiency impairs BLC-mPFC connectivity.
a) Serial coronal sections of WT control, Tfap2d-Het and Tfap2d-KO adult brains whose efferent and afferent projections from the mPFC were traced using AAV1-Camk2a-Egfp (green; anterograde) and AAVrg-Cag-Rfp (red; retrograde), respectively. b-c) Bar graphs depicting the normalized intensity of the number of cells carrying AAVrg-Cag-Rfp tracer (b) or mean intensity fluorescence for the axons labelled with AAV1-Camk2a-Egfp (c) normalized to the intensity of the tracer at injection sites in various ventrolateral cerebral brain regions of control, Tfap2d-Het and Tfap2d-KO adult mice. Mean ± s.e.m. depicted. Two-way ANOVA with Tukey’s correction was applied. ****P < 0.0001,***P = 0.0001, **P = 0.0059 (PIR[b], HET vs KO; = 0.0039 BLAa[c], WT vs KO; =0.0034 BLAp[c], WT vs KO *P = 0.0208, 0.0124 (BLAa [b], WT vs HET, HET vs KO); =0.0309 (BLAp[b], 0.019 (BLAv[b] WT vs HET; = 0.0128 (BLAa [c] WT vs HET; = 0.0169 (BLAp [c] WT vs HET). (n = 5 (WT), 5 (Het), 4 (KO). Str, striatum; St, stria terminalis; PVT, paraventricular thalamus; ACA, anterior cingulate area. For detailed statistics, please see Supplementary Table 16.
Extended Data Fig. 13
Extended Data Fig. 13. Loss or Haploinsufficiency of Tfap2d alters non-Learned exploratory behaviors.
a) Bar graph showing the cumulative time spent (sec) and distance moved (cm) in the center vs border analysis. Tfap2d-KO spent significantly more time in the border and moved less in the center, as compared to the WT control, and Tfap2d-Het. Mean ± s.e.m. depicted. Two-way ANOVA with Tukey’s correction was applied. * represents p values, <0.05. n = 16 (WT control), 33 (Tfap2d-Het), and 29 (Tfap2d-KO). b) Cumulative time spent (seconds) and number (#) of entries in the open arm vs closed arm analysis of the o-maze test. Tfap2d-KO animals spent significantly more time in the closed arm and had more entries in the closed arm as compared to the WT control and or Tfap2d-Het animals. Mean ± s.e.m. depicted. Two-way ANOVA with Tukey’s correction was applied. ** represents p values < 0.05. n = 14 (WT control), 38 (Tfap2d-Het), 27 (Tfap2d-KO). c) Number of entries and cumulative amount of time that spent on the light side of the light-dark box. One-way ANOVA with Tukey’s correction was applied. ** and * represents p values < 0.01, <0.05 respectively. n = 10 (WT control), 10 (Tfap2d-Het), and 7 (Tfap2d-KO). d) Cumulative amount of time that animal spent immobile in the forced swim test. One-way ANOVA with Tukey’s correction was applied. n = 20 (WT control), 23 (Tfap2d-Het) and 13 (Tfap2d-KO). e) Cumulative amount of time that animal spent immobile in the tail suspension test. One-way ANOVA with Tukey’s correction was applied. n = 18 (WT control), 24 (Tfap2d-Het), and 13 (Tfap2d-KO). For detailed statistics, please see Supplementary Table 17. f) Representative heatmaps showing the cumulative movement of WT control, Tfap2d-cHet and Tfap2d-cKO animals in the open field test for 20 min. g-h) Cumulative time spent (b) and distance moved (c) in the center vs border analysis, showing the Tfap2d-cKO spent significantly more time in the border and moved less in the center, as compared to the WT control, and Tfap2d-cHet animals. Mean ± s.e.m. depicted. Two-way ANOVA with Tukey’s correction was applied. ** and * represent p values < 0.01, <0.05 respectively. n = 14 (WT control), 14 (Tfap2d-cHet) and 15 (Tfap2d-cKO). i) Representative heatmap showing the cumulative movement of WT control, Tfap2d-cHet and Tfap2d-cKO animals in the o maze test for 6 min. j-k) Cumulative time spent and number of entries in the open arm vs closed arm analysis, showing the Tfap2d-cKO and Tfap2d-cHet spent significantly more time in the closed arm and Tfap2d-cKO had more entries in the closed arm as compared to the WT control. Mean ± s.e.m. depicted. Two-way ANOVA with Tukey’s correction was applied. ** and * represents p values < 0.01, <0.05 respectively. n = 19 (WT control), 13 (Tfap2d-cHet) and 16 (Tfap2d-cKO). For detailed statistics, please see Supplementary Table 18.
Extended Data Fig. 14
Extended Data Fig. 14. Whole-body Tfap2d loss or haploinsufficiency alters threat response in the fear conditioning test.
a) Line plot showing that during learning phase WT control, Tfap2d Het and Tfap2d KO mice freeze for same amount of time by tone 6. Mean ± s.e.m. depicted. Two-way ANOVA with Tukey’s correction was applied. b) Bar plot showing conditioned responses of the WT control, Tfap2d-cHet and Tfap2d-cKO mice as percent of time the animals froze while in the training context. Mean ± s.e.m. depicted. One-way ANOVA with Tukey’s correction for multiple comparisons was applied. * represent p values < 0.05. c) Line plot showing cued responses of the WT control, Tfap2d-cHet and Tfap2d-cKO mice. Mean ± s.e.m. depicted. Two-way ANOVA with Tukey’s correction was applied. *** and ** represent p values < 0.001, <0.01 respectively for WT vs cKO and ^^^^, ^^^ and ^^ represent p values < 0.0001, <0.001 and <0.01 respectively for WT vs cHET. n = 27 (WT control), 38 (Tfap2d Het), 26 (Tfap2d KO). d) Representative image of the mPFC showing immunostaining for FOS performed on the WT control, Tfap2d-cHet and Tfap2d-cKO brains isolated after 60-90 min of cued memory test. e) Graph depicting the number of FOS positive cells per mm2 detected within the different brain regions of the WT control, Tfap2d-cHet and Tfap2d-cKO brains isolated after 60-90 min of cued test. Mean ± s.e.m. depicted. Two-way ANOVA with Tukey’s correction was applied. ***, **, * represents p values < 0.001, <0.01, <0.05 respectively. For detailed statistics, please see Supplementary Table 19.
Extended Data Fig. 15
Extended Data Fig. 15. Alterations in functional connectivity following cued testing due to Tfap2d deficiency in the post mitotic excitatory neurons.
a) Pearson correlation heatmap showing the functional connectivity between different brain regions measured by the FOS immunostaining of the WT control, Tfap2d-cHet and Tfap2d-cKO mice after the cued test. ***, **, * represents p values < 0.001, <0.01, <0.05, respectively (n = 4/genotype). Correlations were calculated using a two-tailed Pearson’s correlation test. For detailed statistics, please see Supplementary Table 10. b) Pearson correlation heatmap showing the functional connectivity between different brain regions measured by the FOS immunostaining of the WT control, Tfap2d-cHet and Tfap2d-cKO mice after the cued test. ***, **, * represents p values < 0.001, <0.01, <0.05, respectively (n = 4/genotype). Correlations were calculated using a two-tailed Pearson’s correlation test. c) Heatmap showing the differences seen in the Pearson correlations between WT controls, Tfap2d-cHet and Tfap2d-cKO calculated by Fisher’s z-transformations. ***, **, * represents p values < 0.001, <0.01, <0.05, respectively (n = 4/genotype). Highlighted in bold are the regions that express Tfap2d. Statistical significance of correlations was assessed using Fisher’s Z transformations, with a two-tailed test applied to compare correlation coefficients d. For abbreviations and details of regions grouped please refer to Supplementary Table 5. For detailed statistics, please see Supplementary Tables 20 and 21.

References

    1. Swanson, L. W. & Petrovich, G. D. What is the amygdala? Trends Neurosci.21, 323–331 (1998). - PubMed
    1. Amaral, D. G., Schumann, C. M. & Nordahl, C. W. Neuroanatomy of autism. Trends Neurosci.31, 137–145 (2008). - PubMed
    1. McDonald, A. J. Cortical pathways to the mammalian amygdala. Prog. Neurobiol.55, 257–332 (1998). - PubMed
    1. Schumann, C. M., Bauman, M. D. & Amaral, D. G. Abnormal structure or function of the amygdala is a common component of neurodevelopmental disorders. Neuropsychologia49, 745–759 (2011). - PMC - PubMed
    1. Janak, P. H. & Tye, K. M. From circuits to behaviour in the amygdala. Nature517, 284–292 (2015). - PMC - PubMed

Substances

LinkOut - more resources