. 2025 Feb;638(8050):479-489.
doi: 10.1038/s41586-024-08413-w. Epub 2025 Jan 15.

Cationic peptides cause memory loss through endophilin-mediated endocytosis

Affiliations

Cationic peptides cause memory loss through endophilin-mediated endocytosis

Eric G Stokes et al. Nature. 2025 Feb.

Abstract

The zeta inhibitory peptide (ZIP) interferes with memory maintenance and long-term potentiation (LTP)1 when administered to mice. However, mice lacking its putative target, protein kinase PKMζ, exhibit normal learning and memory as well as LTP2,3, making the mechanism of ZIP unclear. Here we show that ZIP disrupts LTP by removing surface AMPA receptors through its cationic charge alone. This effect requires endophilin-A2-mediated endocytosis and is fully blocked by drugs suppressing macropinocytosis. ZIP and other cationic peptides remove newly inserted AMPA receptor nanoclusters at potentiated synapses, providing a mechanism by which these peptides erase memories without altering basal synaptic function. When delivered in vivo, cationic peptides can modulate memories on local and brain-wide scales, and these mechanisms can be leveraged to prevent memory loss in a model of traumatic brain injury. Our findings uncover a previously unknown synaptic mechanism by which memories are maintained or lost.


Conflict of interest statement

Competing interests: The authors declare no competing interests.

Figures

Extended Data Fig. 1 |
Extended Data Fig. 1 |. Concentration dependence of various cationic and non-cationic peptides on SEP-GluA1 fluorescence.
(a) Sample flow cytometry image indicating side scatter vs. forward scatter, and selection of gates to isolate cells. (b) Distribution of cells by FITC signal, normalized to the maximum number of cells found within a given FITC range bin. ZIP shifts the distribution of this curve to the left. (c) Effect of heparin on the ZIP-induced reduction in SEP-GluA1 fluorescence, added either to the same tube as ZIP before adding to cells, or added to the cell culture independently before ZIP. Heparin completely blocked ZIP or TAT’s effects on SEP-GluA1 fluorescence, whether heparin was premixed with peptide – vehicle vs. heparin/ZIP p = 0.39; vehicle vs. heparin/TAT p = 0.93 – or first added to the cells – vehicle vs. heparin/ZIP p = 0.17; vehicle vs. heparin/TAT p = 0.79. (d) Ratio of SEP-GluA1 internalization as a function of the log concentration of scrZIP and myr-scrZIP. scrZIP all n = 3, myr-scrZIP all n = 3. (e) Effect of 100 μM V5 or FLAG peptides relative to 100 μM ZIP on SEP-GluA1 fluorescence. Vehicle vs. V5 p = 0.87; vehicle vs. FLAG p < 0.0001. (f) Concentration dependence of the AIP peptide on SEP-GluA1 fluorescence. Vehicle vs. 10 μM AIP p < 0.0001; vehicle vs. 100 μM AIP p < 0.0001; vehicle vs. 1 mM AIP p < 0.0001. (g) Concentration dependence of the scrZIP peptide on SEP-GluA1 fluorescence. Vehicle vs. 0.1 μM scrZIP p = 0.32; vehicle vs. 1 μM scrZIP p < 0.0001; vehicle vs. 10 μM scrZIP p < 0.0001; vehicle vs. 100 μM scrZIP p < 0.0001; vehicle vs. 1 mM scrZIP p < 0.0001. (h) Concentration dependence of the Arg9 peptide on SEP-GluA1 fluorescence. Vehicle vs. 10 μM Arg9 p < 0.0001; vehicle vs. 100 μM Arg9 p < 0.0001. (i) Concentration dependence of the non-cationic AA3H and AA3H-PLP peptides on SEP-GluA1 fluorescence. Vehicle vs. 10 μM AA3H p < 0.0001; vehicle vs. 100 μM AA3H p < 0.0001; vehicle vs. 10 μM AA3H-PLP p < 0.0001; vehicle vs. 100 μM AA3H-PLP p < 0.0001. (j) Relationship between the net charge of each peptide and the relative change in SEP-GluA1 fluorescence (at 100 μM peptide), r2 = 0.70, p < 0.0001. Error bars are centered at the mean, ± 1 s.e.m., and full statistics are provided in Supplemental Table 1.
Extended Data Fig. 2 |
Extended Data Fig. 2 |. Effects of endocytosis-modulating drugs at different concentrations in HEK-SEP-GluA1 cells.
(a) Effects of various drugs on HEK cells without SEP-GluA1, relative to vehicle-treated HEK-SEP-GluA1 cells. Data are presented as mean fluorescence in the FITC channel per sample. (b) Effect of bafilomycin at different concentrations, with and without subsequent ZIP administration. As bafilomycin A1 canonically inhibits vacuolar H + -ATPase, which is the main proton pump responsible for endosome acidification, this likely prevents pH-induced changes in GFP fluorescence upon endocytosis. Vehicle (saline) vs. 1% DMSO p = 0.069; vehicle vs. 0.1 μM bafilomycin/ZIP p = 0.097; vehicle vs. 1 μM bafilomycin/ZIP p = 0.0007; vehicle vs. 0.1 μM bafilomycin p = 0.0023; vehicle vs. 1 μM bafilomycin p < 0.0001. This indicates our assay is working properly. (c) Dynasore (80 μM), chlorpromazine (5 μM) or nystatin (5 μg/μL) were applied to HEK SEP-GluA1 cells 4 h prior to ZIP or vehicle application. Dynasore and nystatin partially but incompletely blocked ZIP’s effects. Vehicle vs. Dynasore/ZIP p < 0.0001; vehicle vs. Dynasore p = 0.0012; vehicle vs. nystatin/ZIP p < 0.0001; vehicle vs. nystatin p < 0.0001. (d) Effect of chlorpromazine at different concentrations, with and without subsequent ZIP administration. Vehicle vs. 0.5 μM chlorpromazine/ZIP p < 0.0001; vehicle vs. 5 μM chlorpromazine/ZIP p < 0.0001; vehicle vs. 0.5 μM chlorpromazine p = 0.0026; vehicle vs. 5 μM chlorpromazine p < 0.0001. (e) Effect of Dynasore at different concentrations, with and without subsequent ZIP administration. Vehicle vs. 8 μM Dynasore + ZIP p = 0.03; vehicle vs. 80 μM Dynasore + ZIP p < 0.0001; vehicle vs. 8 μM Dynasore p = 0.0015; vehicle vs. 80 μM Dynasore p < 0.0001. (f) Effect of nystatin at different concentrations, with and without subsequent ZIP administration. Vehicle vs. 0.5 μg/mL nystatin + ZIP p < 0.0001; vehicle vs. 5 μg/mL nystatin + ZIP p < 0.0001; vehicle vs. 0.05 μg/mL nystatin p = 0.03; vehicle vs. 0.5 μg/mL nystatin p = 0.0003; vehicle vs. 5 μg/mL nystatin p < 0.0001. (g) Amiloride blocked ZIP’s effects at concentrations typically used to block macropinocytosis in cell culture, but not at lower concentrations. Vehicle vs. 40 μM amiloride/ZIP p < 0.0001; vehicle vs. 400 μM amiloride/ZIP p < 0.0001; vehicle vs. 4 mM amiloride/ZIP p = 0.16. (h) Effect of rottlerin at different concentrations, with and without subsequent ZIP administration. Vehicle vs. 50 μM rottlerin/ZIP p = 0.15; vehicle vs. 0.5 μM rottlerin p = 0.57; vehicle vs. 5 μM rottlerin p = 0.0051; Vehicle vs. 50 μM rottlerin, p < 0.0001. (i) Effect of Ly294002 at different concentrations, with and without subsequent ZIP administration. Vehicle vs. 0.5 μM Ly294002/ZIP p = 0.62; vehicle vs. 5 μM Ly294002/ZIP p = 0.01; vehicle vs. 50 μM Ly294002/ZIP p < 0.0001; vehicle vs. 0.5 μM Ly294002 p = 0.43; vehicle vs. 5 μM Ly294002 p < 0.0001; vehicle vs. 50 μM Ly294002 p < 0.0001. (j) Effect of EIPA at different concentrations, with and without subsequent ZIP administration. Vehicle vs. 40 μM EIPA/ZIP p = 0.01; vehicle vs. 400 μM EIPA/ZIP p = 0.0098; vehicle vs. 4 μM EIPA p < 0.0001; vehicle vs. 40 μM EIPA p < 0.0001; vehicle vs. 400 μM EIPA p < 0.0001. Error bars are centered at the mean, ± 1 s.e.m., and full statistics are provided in Supplemental Table 1.
Extended Data Fig. 3 |
Extended Data Fig. 3 |. Effect of positively charged and neutral molecules on SEP-GluA1 fluorescence.
(a) Effect of an equivalent concentration of free lysine (100 μM) and arginine (500 μM) as is present in 100 μM ZIP. A minor reduction in SEP-GluA1 fluorescence was observed. Vehicle vs. L-lys/L-arg p = 0.0003. (b) Effect of dextrans on SEP-GluA1 fluorescence. No change in SEP-GluA1 fluorescence was observed. Vehicle vs. 0.05 mg/mL p = 0.90; vehicle vs. 0.01 mg/mL p = 0.75; vehicle vs. 0.5 mg/mL p = 0.40; vehicle vs. 1 mg/mL p = 0.57; vehicle vs. 5 mg/mL p = 0.67. Error bars are centered at the mean, ± 1 s.e.m., and full statistics are provided in Supplemental Table 1.
Extended Data Fig. 4 |
Extended Data Fig. 4 |. Additional primary neuronal culture data describing metric used and demonstrating applicability for multiple cationic peptides.
(a) Confocal micrograph of representative neuronal structures for each condition selected for quantitative analysis. A GFP-based cell-fill used to highlight dendritic structure is shown in green. GluA1 immunostaining is shown in blue. Scale bar, 20 μm. (b) Density of GluA1 puncta for each condition (per 10 mm of dendrite). One-way ANOVA p = 0.42. (c) Mean intensity of GluA1 puncta for each condition (AU). One-way ANOVA p = 0.91. (d) Mean size of GluA1 puncta for each condition (mm2). One-way ANOVA p = 0.0017; control vs. TTX p = 0.0032. (e) Normalized integrated puncta intensity for each condition. One-way ANOVA p < 0.0001; Control vs. TTX p < 0.0001. (f) AIP induced GluA1 endocytosis that was blocked by amiloride. Vehicle vs. TTX p < 0.0001; Vehicle vs. TTX/amiloride/AIP p = 0.0004; TTX vs. TTX/AIP p = 0.019; TTX/AIP vs. TTX/amiloride/AIP p = 0.033. (g) scrZIP induced GluA1 endocytosis that was blocked by amiloride. Vehicle vs. TTX p < 0.0001; Vehicle vs. TTX/amiloride/scrZIP p < 0.0001; TTX vs. TTX/amiloride/scrZIP p < 0.0001; scrZIP vs. TTX/amiloride/scrZIP p < 0.0001; TTX/scrZIP vs. TTX/amiloride/scrZIP p < 0.0001. (h) Penetratin induced GluA1 endocytosis that was blocked by amiloride. Vehicle vs. TTX p < 0.0001; Vehicle vs. TTX/amiloride/penetratin p < 0.0001; TTX vs. TTX/amiloride/penetratin p < 0.0001; Penetratin vs. TTX/amiloride/penetratin p < 0.0001; TTX/penetratin vs. TTX/amiloride/penetratin p < 0.0001. (i) Arg9 induced GluA1 endocytosis that was blocked by amiloride. Vehicle vs. TTX p < 0.0001; Vehicle vs. TTX/amiloride/Arg9 p < 0.0001; TTX vs. TTX/Arg9 p = 0.0012; Arg9 vs. TTX/amiloride/Arg9 p = 0.046; TTX/Arg9 vs. TTX/amiloride/Arg9 p = 0.0009. Error bars are centered at the mean, ± 1 s.e.m., and full statistics are provided in Supplemental Table 1.
Extended Data Fig. 5 |
Extended Data Fig. 5 |. Effects of ZIP, TAT, and amiloride on EPSC frequency in primary cultured neurons.
(a) Cumulative probability graph for the inter-event interval for each condition. (b) Bar graph comparison of EPSC frequency for each condition. One-way ANOVA p = 0.011; no pairwise comparisons are significant. (c) Cumulative probability graph for the inter-event interval for each condition. (d) Bar graph comparison of EPSC frequency for each condition. One-way ANOVA p = 0.09. (e) Cumulative probability graph for the inter-event interval for each condition. (f) Bar graph comparison of EPSC frequency for each condition. One-way ANOVA p < 0.0001; control vs. TTX/amiloride p < 0.0001; control vs. TTX/amiloride/TAT p = 0.0003; TTX vs. TTX/amiloride p < 0.0001; TTX vs. TTX/amiloride/TAT p = 0.0034; TTX/amiloride vs. TTX/TAT p < 0.0001; TTX/TAT vs. TTX/TAT/amiloride p = 0.0001. Error bars are centered at the mean, ± 1 s.e.m., and full statistics are provided in Supplemental Table 1.
Extended Data Fig. 6 |
Extended Data Fig. 6 |. Electrophysiological properties of TTX, ZIP, TAT, and amiloride-treated cultured neurons.
(a) Membrane resistance of ZIP and/or TTX-treated cultures. (b) Membrane capacitance of ZIP and/or TTX-treated cultures. (c) Sample EPSCs of each of the ZIP and/or TTX-treated cultures. (d) Weighted EPSC decay constant for ZIP and/or TTX-treated cultures. (e) Membrane resistance of TAT and/or TTX-treated cultures. (f) Membrane capacitance of TAT and/or TTX-treated cultures. (g) Sample EPSCs of each of the TAT and/or TTX-treated cultures. (h) Weighted EPSC decay constant for TAT and/or TTX-treated cultures. (i) Membrane resistance of TAT, amiloride, and/or TTX- treated cultures. (j) Membrane capacitance of TAT, amiloride, and/or TTX-treated cultures. (k) Sample EPSCs of each of the TAT, amiloride, and/or TTX- treated cultures. (l) Weighted EPSC decay constant for TAT, amiloride, and/or TTX-treatment groups. One-way ANOVA p < 0.0001; control vs. TTX/amiloride p < 0.0001; control vs. TTX/amiloride/TAT p = 0.0002; TTX vs. TTX/amiloride p < 0.0001; TTX vs. TTX/amiloride/TAT p = 0.0007; TTX/amiloride vs. TTX/TAT p < 0.0001; TTX/TAT vs. TTX/amiloride/TAT p = 0.0032. All other non-noted comparisons in this figure were non-significant. Error bars are centered at the mean, ± 1 s.e.m., and full statistics are provided in Supplemental Table 1.
Extended Data Fig. 7 |
Extended Data Fig. 7 |. Investigation of effects of cationic peptides on GluA1 nanoclusters using expansion microscopy.
(a) Schematic of Expansion Microscopy. (b) Sample Expansion Microscopy confocal images of Homer1, GluA1, and merged for control, TTX, ZIP, TTX/ZIP, TAT, TTX/TAT. (c) Total volume occupied by GluA1 in the synapse. One-way ANOVA p < 0.0001; control vs. TTX p < 0.0001; TTX vs. ZIP p < 0.0001; TTX vs. TTX/ZIP p < 0.0001; TTX vs. TAT p < 0.0001; TTX vs. TTX/TAT p < 0.0001. (d) Numbers of GluA1 nanoclusters per synapse. One-way ANOVA p < 0.0001; control vs. TTX p < 0.0001; TTX vs. ZIP p < 0.0001; TTX vs. TTX/ZIP p < 0.0001; TTX vs. TAT p < 0.0001; TTX vs. TTX/TAT p < 0.0001. (e) Volume of GluA1 nanoclusters. One-way ANOVA p = 0.0056; control vs. TAT p = 0.0032. Error bars are centered at the mean, ± 1 s.e.m., and full statistics are provided in Supplemental Table 1.
Extended Data Fig. 8 |
Extended Data Fig. 8 |. Histograms of GluA1 and GABARγ2 (GABAAR) volumes following ZIP application.
(a) Histogram of GluA1 volume in the synapse for control, TTX, ZIP, and TTX/ZIP conditions. (b) Histogram of GluA1 volume in the synapse for control, TTX, TAT, and TTX/TAT conditions. (c) Histogram of GABAAR nanocluster volume for control, PTX, ZIP, and PTX/ZIP conditions. (d) Histogram of GABAAR nanocluster volume for control, PTX, TAT, and PTX/TAT conditions.
Extended Data Fig. 9 |
Extended Data Fig. 9 |. ZIP’s removal of AMPAR nanoclusters is dependent on endoA2.
(a) shRNA-mediated knockdown efficiency of endoA2 mRNA. (b) Sample STED microscopy images of Homer1, GluA1, and merged for control, TTX, TTX/ZIP, shRNA, shRNA/TTX/ZIP. (c) Schematic for hypothesized mechanism of action. TTX induces homeostatic plasticity, largely through increasing the number of nanoclusters. Cationic peptides trigger remodeling of the membrane through endoA2-mediated endocytosis, which is activated only upon cationic peptide-mediated stimulation. This preferentially removes newly inserted AMPAR nanoclusters.
Extended Data Fig. 10 |
Extended Data Fig. 10 |. Effect of peptide injection on auditory fear conditioning recall, as a function of the number of cationic charges on the peptide.
Saline n = 15, V5 n = 8, FLAG n = 10, AIP n = 7, ZIP n = 8, scrZIP n = 9, TAT n = 7, Arg9 n = 6.
Extended Data Fig. 11 |
Extended Data Fig. 11 |. Additional behavioral data detailing effects of cationic peptides on memory.
(a) Schematic of behavioral experiments testing whether TAT-mediated memory loss was permanent or not. (b) Following TAT injection, recall memory was impaired in the first and all subsequent recall sessions. Two-way ANOVA group factor p = 0.0004. (c) ZIP or TAT infusion impaired recall of the tone/shock association, and animals were able to re-learn this association equally well as during the first learning period. (d) Comparison of the time spent freezing during the third tone/shock association before and after ZIP or TAT administration. ZIP p = 0.61; TAT p = 0.33. (e) Bafilomycin administration had no effect on ZIP-mediated memory disruption. ZIP vs. bafilomycin/ZIP p = 0.95. All statistical comparisons are provided in Supplementary Table 1. Note that 1 point for the bafilomycin group is above the y-axis. (f) Clathrin-mediated endocytosis inhibitor chlorpromazine did not impair ZIP-mediated memory disruption. ZIP vs. ZIP/chlorpromazine p > 0.99. (g) Clathrin-mediated endocytosis inhibitor Dynasore did not significantly impair ZIP-mediated memory disruption. ZIP vs. ZIP/Dynasore p = 0.67. (h) The caveolin-mediated endocytosis inhibitor nystatin did not significantly impair ZIP-mediated memory disruption. ZIP vs. ZIP/nystatin p = 0.85. (i) A combination of bafilomycin, chlorpromazine, Dynasore, and nystatin had no effect on ZIP-mediated memory disruption. ZIP vs. 4 drug cocktail p = 0.91. (j) Administration of positively charged amino acids did not disrupt recall of the tone/shock association. Saline vs. AAs p = 0.029. Note that 2 points for the +AAs are above the y-axis. Error bars are centered at the mean, ± 1 s.e.m., and full statistics are provided in Supplemental Table 1.
Fig. 1 |
Fig. 1 |. Cationic peptides trigger internalization of SEP-GluA1 in a charge- and dose-dependent manner.
a, Experimental schematic. Peptides or small molecules were added to confluent HEK SEP-GluA1 cells, and cellular fluorescence was assessed using flow cytometry. b, Application of ZIP triggered internalization of SEP-GluA1 in a dose-dependent manner, with significant effects observed starting from 1 μM. The y axis represents the mean of the fluorescein isothiocyanate (FITC) signal for the flow plot relative to that of untreated SEP-GluA1 cells. c, Application of TAT triggered internalization of SEP-GluA1 in a dose-dependent manner, with significant effects observed starting from 1 μM. d, Neutralizing the charge of ZIP or TAT using heparin completely blocked effects on SEP-GluA1 endocytosis. e, Ratio of SEP-GluA1 internalization as a function of the log concentration of ZIP and myr-ZIP. For ZIP 100 μM, n = 6; for all other concentrations, n = 3. For myr-ZIP 100 μM, n = 26; for all other concentrations, n = 3. f, Ratio of SEP-GluA1 internalization as a function of the log concentration of TAT and myr-TAT. For TAT 10 μM, n = 6; for 100 μM, n = 12; for all other concentrations, n = 3. For myr-TAT 100 μM, n = 6; for all other concentrations, n = 3. g, Ratio of SEP-GluA1 internalization as a function of the number of positive charges per peptide applied at 100 μM. SEP, n = 123; V5, n = 3; Flag, n = 3; AIP, n = 3; ZIP, n = 26; scrZIP, n = 3; TAT, n = 12; Arg9, n = 3. h, Macropinocytosis inhibitors including amiloride, EIPA, rottlerin and Ly294002 all completely blocked the effects of ZIP. i, Stimulation of macropinocytosis using AA3H or EGF significantly induced SEP-GluA1 endocytosis. Data are mean ± s.e.m.; full statistics are provided in Supplementary Table 1.
Fig. 2 |
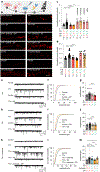
Fig. 2 |. ZIP and TAT eliminate stimulus-induced elevations in GluA1, an effect blocked by amiloride.
a, Experimental schematic. Primary hippocampal cells were grown for 14 DIV. Elevation of surface AMPARs was then induced either through homeostatic plasticity by means of a 2-day TTX application protocol or by forskolin plus rolipram application. Small molecules and/or cationic peptides were then added, and the effects on surface GluA1 levels were assessed. b, Representative examples of confocal images for quantitative analysis of puncta intensity. c, GluA1 levels after application of TTX plus drugs and/or cationic peptides. One-way analysis of variance (ANOVA) P < 0.0001. d, GluA1 levels after application of forskolin and rolipram plus drugs and/or cationic peptides. One-way ANOVA P < 0.0001. e, Sample traces of miniature EPSCs recorded from control (no TTX), TTX-treated, control/ZIP and TTX/ZIP conditions. f, Cumulative probability graph for EPSC amplitude for each condition. g, Bar graph comparison of data shown in f. One-way ANOVA P < 0.0001. h, Sample traces of miniature EPSCs recorded from control (no TTX), TTX-treated, control/TAT and TTX/TAT conditions. i, Cumulative probability graph for EPSC amplitude for each condition. j, Bar graph comparison of data shown in i. One-way ANOVA P < 0.0001. k, Sample traces of miniature EPSCs recorded from control (no TTX), TTX-treated, TTX/amiloride, TTX/TAT and TTX/amiloride/TAT conditions. l, Cumulative probability graph for EPSC amplitude for each condition. m, Bar graph comparison of data shown in l. One-way ANOVA P < 0.0001. Data are mean ± s.e.m.; full statistics are provided in Supplementary Table 1. Scale bar, 5 μm.
Fig. 3 |
Fig. 3 |. ZIP and TAT reverse synaptic upscaling of AMPAR and GABAAR nanoclusters.
a, Schematic of STED microscopy. b, Sample STED microscopy images of Homer1, GluA1, and merged for control, TTX, ZIP, TTX/ZIP, TAT and TTX/TAT. c, Total volume occupied by GluA1 in the synapse. One-way ANOVA P < 0.0001. d, Numbers of GluA1 nanoclusters per synapse. One-way ANOVA P < 0.0001. e, Volume of GluA1 nanoclusters. One-way ANOVA P = 0.022. f, Sample STED microscopy images of gephyrin, GABARγ2 (GABAAR) and merged for control, PTX, ZIP, PTX/ZIP, TAT and PTX/TAT. g, Total volume occupied by GABAAR in the synapse. One-way ANOVA P = 0.035. h, Numbers of GABAAR nanoclusters per synapse. One-way ANOVA P = 0.0004. i, Volume of GABAAR nanoclusters. One-way ANOVA P < 0.0001. j, Experimental schematic and timeline. k, Total volume occupied by GluA1 in the synapse. One-way ANOVA P < 0.0001. l, Numbers of GluA1 nanoclusters per synapse. One-way ANOVA P < 0.0001. m, Volume of GluA1 nanoclusters. One-way ANOVA P = 0.048. Data are mean ± s.e.m.; full statistics are provided in Supplementary Table 1.
Fig. 4 |
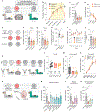
Fig. 4 |. Local injection of cationic peptides erases memories stored near the site of injection, an effect blocked by macropinocytosis inhibitors.
a, Experimental schematic. b, Time spent freezing during the tone alone, as well as tone–shock pairings on day 1, and the tone presentation alone (recall) on day 4. c, Infusion of ZIP, scrZIP and TAT strongly impaired recall of the tone–shock association. One-way ANOVA p < 0.0001. d, This effect was concentration-dependent. e, Schematic for auditory fear conditioning experiments testing the effects of ZIP or TAT when injected 2 or 7 days postconditioning. f, When ZIP or TAT was injected 2 days following conditioning, a milder but significant effect on recall was observed relative to when ZIP or TAT was injected 1 day following conditioning. One-way ANOVA P = 0.021. g, When ZIP or TAT was injected 1 week following conditioning, no significant effect on recall was observed. One-way ANOVA P = 0.25. h, Both ZIP and TAT impaired recall of CPP. One-way ANOVA P = 0.021. i, ZIP or TAT impaired recall of learned spontaneous alternation. j, As in i, but focusing on day 6. One-way ANOVA P = 0.05. k, Timeline of experiments. l, ZIP or TAT significantly impaired performance on the spontaneous alternation task. m, ZIP or TAT significantly impaired contextual fear recall. One-way ANOVA P = 0.012. n, ZIP or TAT had no effect on tone-induced recall. One-way ANOVA P = 0.90. o, Experimental schematic. p, Administration of amiloride, rottlerin and Ly294002 all blocked ZIP-mediated memory disruption. q, Heparin administration completely blocked ZIP-mediated memory disruption. r, Stimulation of macropinocytosis by means of AA3H or EGF application impaired recall of the tone–shock association. Data are mean ± s.e.m.; full statistics are provided in Supplementary Table 1.
Fig. 5 |
Fig. 5 |. Local and global memory modulation by cationic peptides and amiloride.
a, Experimental schematic of retro-orbital administration of cationic peptides. b, Retro-orbital administration of either ZIP or TAT significantly impaired recall of the tone–shock association. One-way ANOVA P = 0.0002. c, Impairment of the tone–shock association was concentration-dependent, with at least 10 mM being required to observe a significant effect. d, Mice could relearn the tone–shock association after retro-orbital administration, and ZIP or TAT could be repeatedly injected with a similar effect on the tone–shock association each time. e, Retro-orbital injection of ZIP or TAT interfered with recall of CPP. f, Schematic of retro-orbital TAT administration preceded by local infusion of amiloride into the BLA. g, This perturbation had no effect on the tone–shock association. One-way ANOVA P = 0.017. h, This perturbation resulted in significant loss of the CPP. One-way ANOVA P = 0.026. i, Schematic of retro-orbital TAT administration preceded by local infusion of amiloride into the NAc. j, This perturbation resulted in significant impairment of the tone–shock association. One-way ANOVA P = 0.0011. k, This perturbation had no significant effect on the CPP memory. One-way ANOVA P = 0.05. l, Schematic of experimental design. m, Coronal brain sections labelled for NeuN (blue) and GFAP (orange) in control animals, TBI animals, and TBI animals with amiloride injection into the BLA. n, Quantification of GFAP expression in neocortex. One-way ANOVA P < 0.0001. o, Time spent freezing during auditory fear recall after injury. One-way ANOVA P < 0.0001. p, Time spent in cocaine-paired chamber. Data are mean ± s.e.m.; full statistics are provided in Supplementary Table 1. q, Proposed mechanism of cationic-peptide-induced endocytosis of AMPARs. Scale bars, 1 mm (inset, 100 μm).

Update of

References

    1. Pastalkova E et al. Storage of spatial information of LTP by the maintenance mechanism. Science 313, 1141–1144 (2006). - PubMed
    1. Lee AM et al. Prkcz null mice show normal learning and memory. Nature 493, 416–419 (2013). - PMC - PubMed
    1. Volk LJ, Bachman JL, Johnson R, Yu Y & Huganir RL PKM-ζ is not required for hippocampal synaptic plasticity, learning and memory. Nature 493, 420–423 (2013). - PMC - PubMed
    1. Kelly MT, Crary JF & Sacktor TC Regulation of protein kinase Mζ synthesis by multiple kinases in long-term potentiation. J. Neurosci 27, 3439–3444 (2007). - PMC - PubMed
    1. Gao PP, Goodman JH, Sacktor TC & Francis JT Persistent increases of PKMζ in sensorimotor cortex maintain procedural long-term memory storage. iScience 5, 90–98 (2018). - PMC - PubMed

MeSH terms

LinkOut - more resources