. 2025 Feb;638(8050):490-498.
doi: 10.1038/s41586-024-08395-9. Epub 2025 Jan 15.

GZMK-expressing CD8+ T cells promote recurrent airway inflammatory diseases

Affiliations

GZMK-expressing CD8+ T cells promote recurrent airway inflammatory diseases

Feng Lan et al. Nature. 2025 Feb.

Erratum in

Abstract

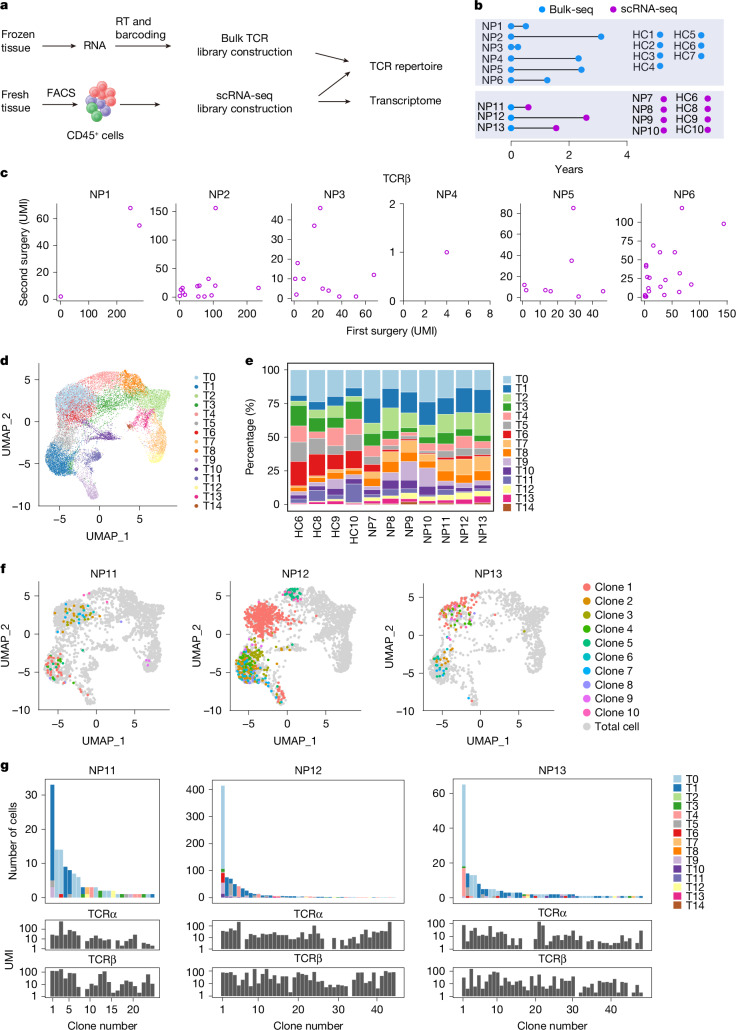
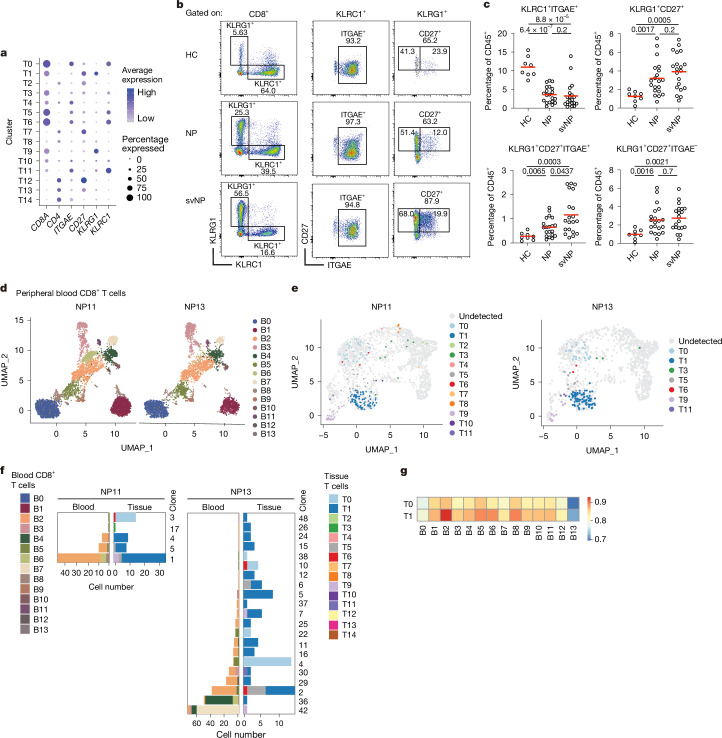
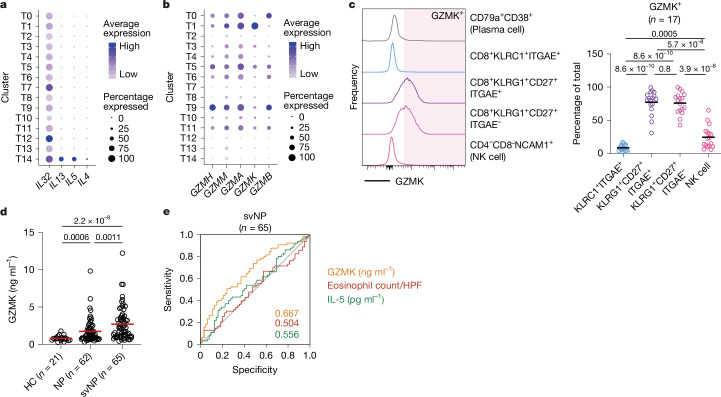
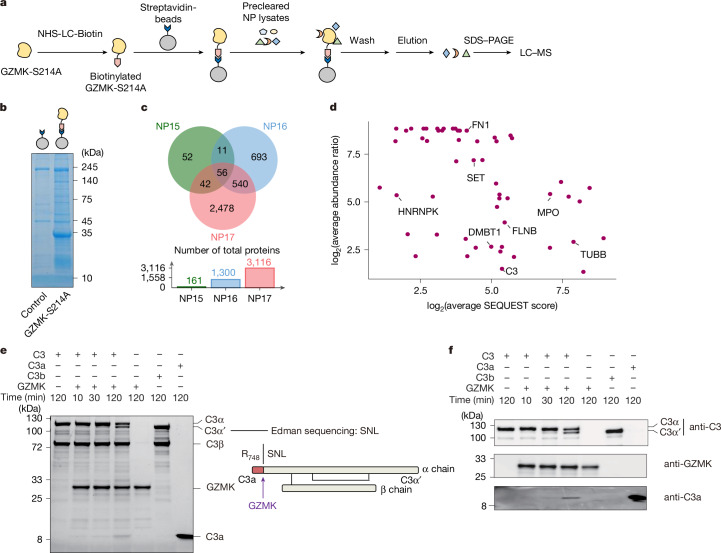
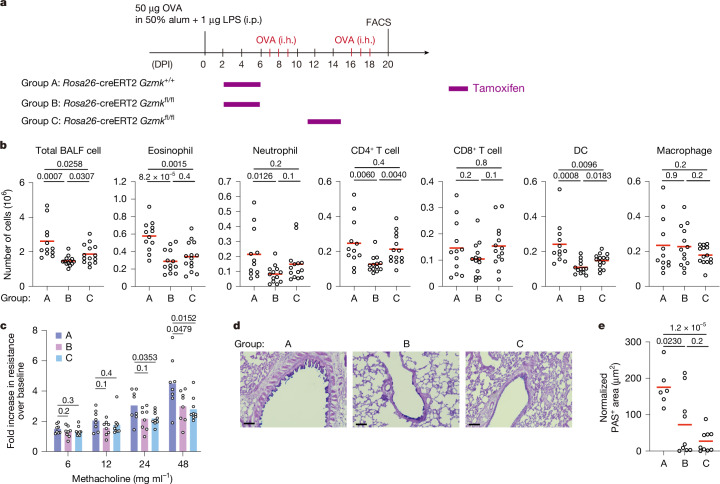
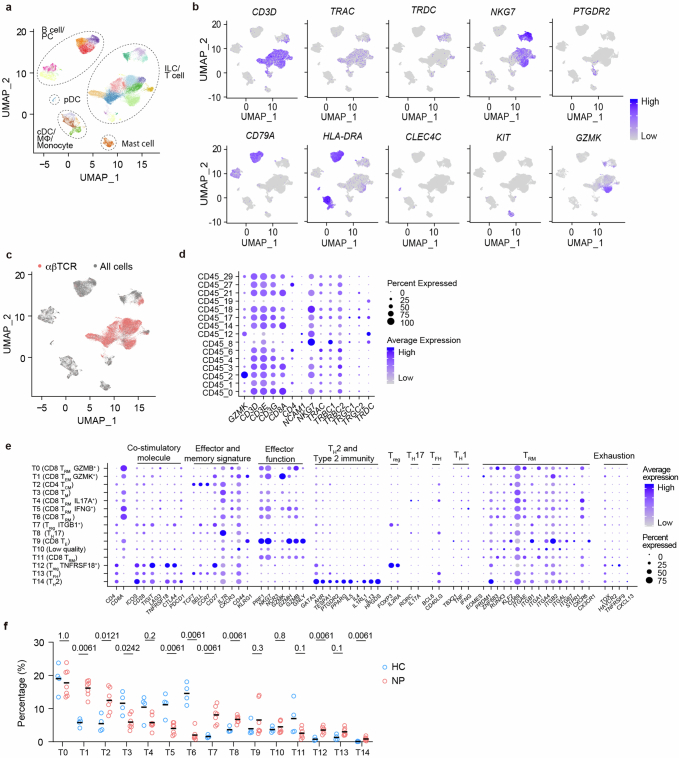
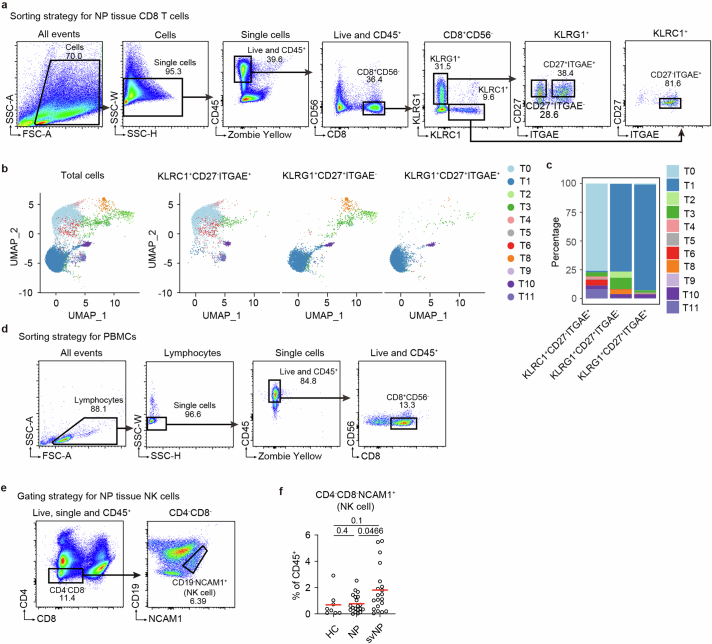
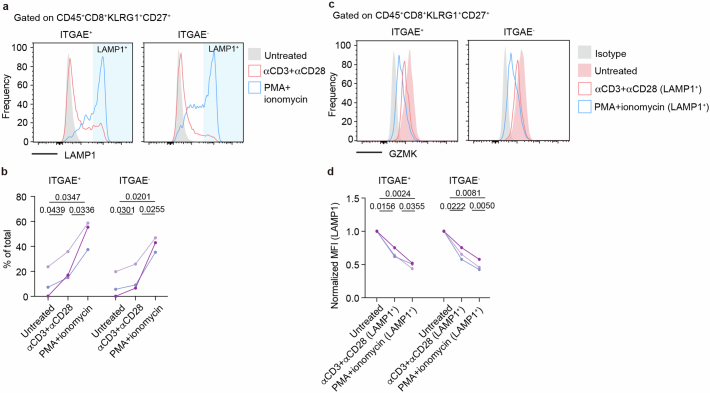
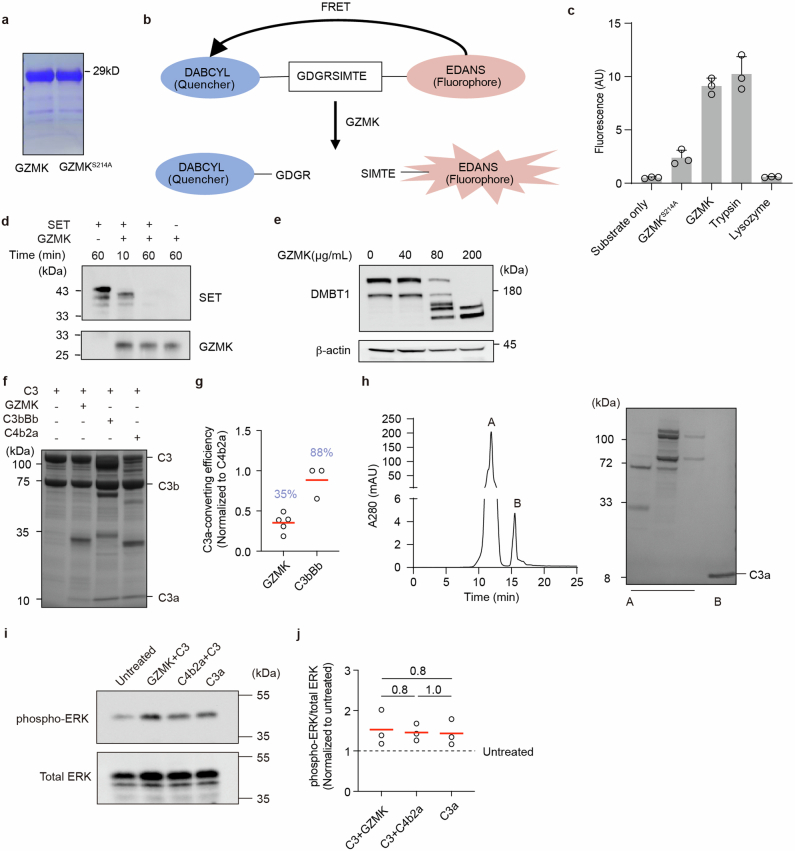
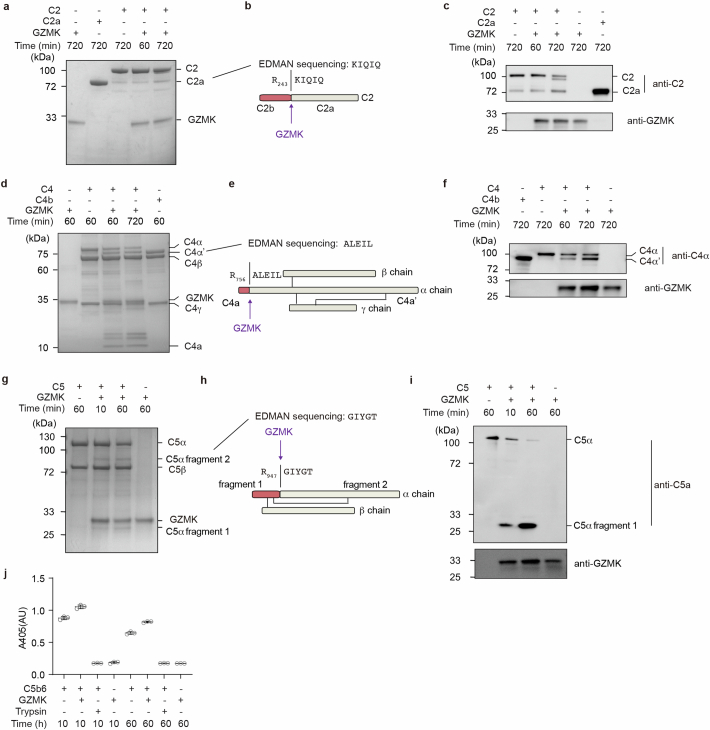
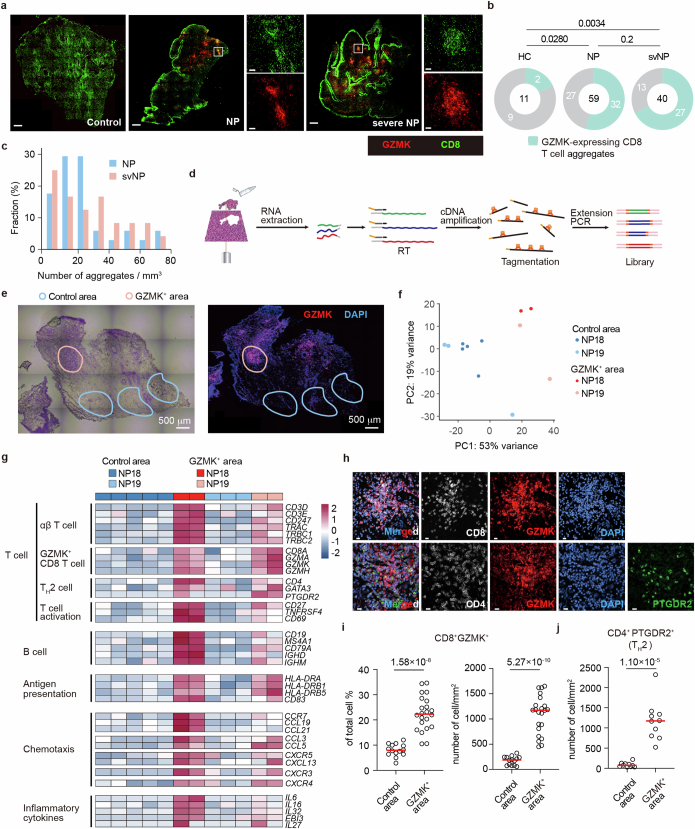
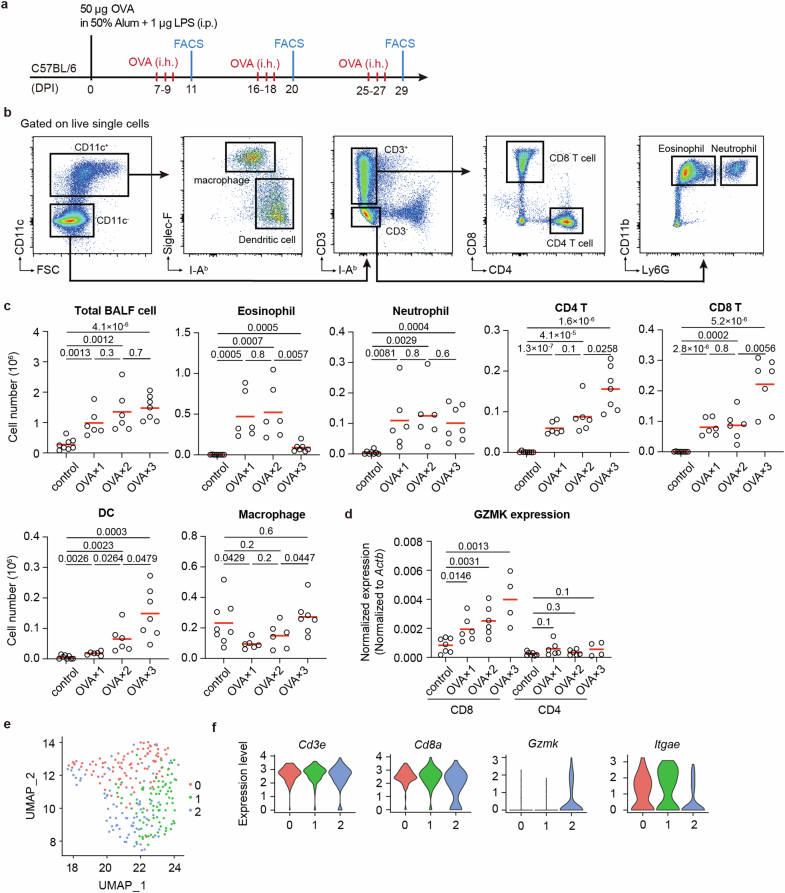
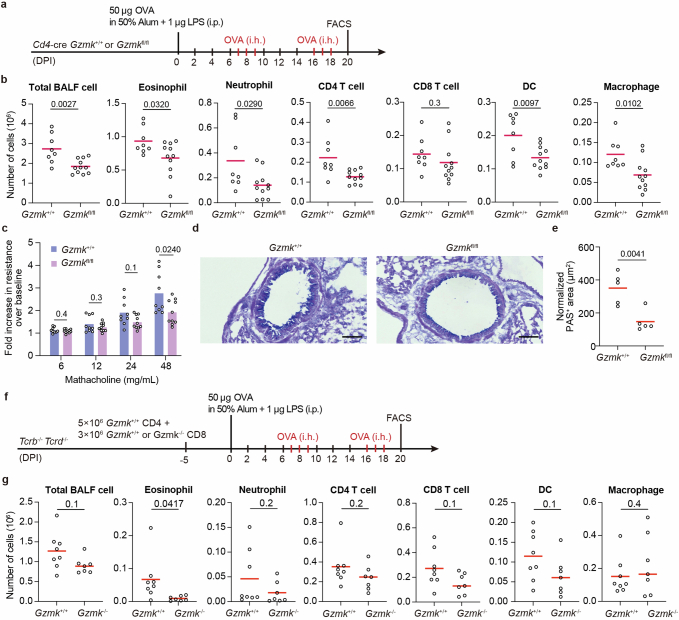
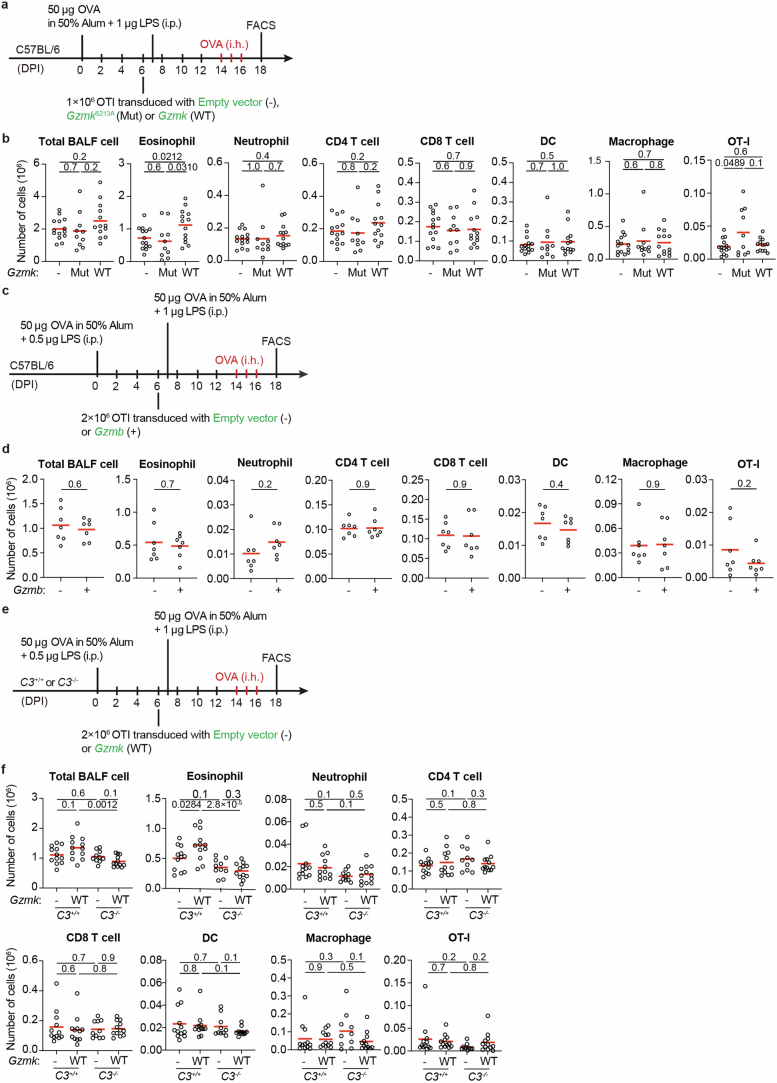
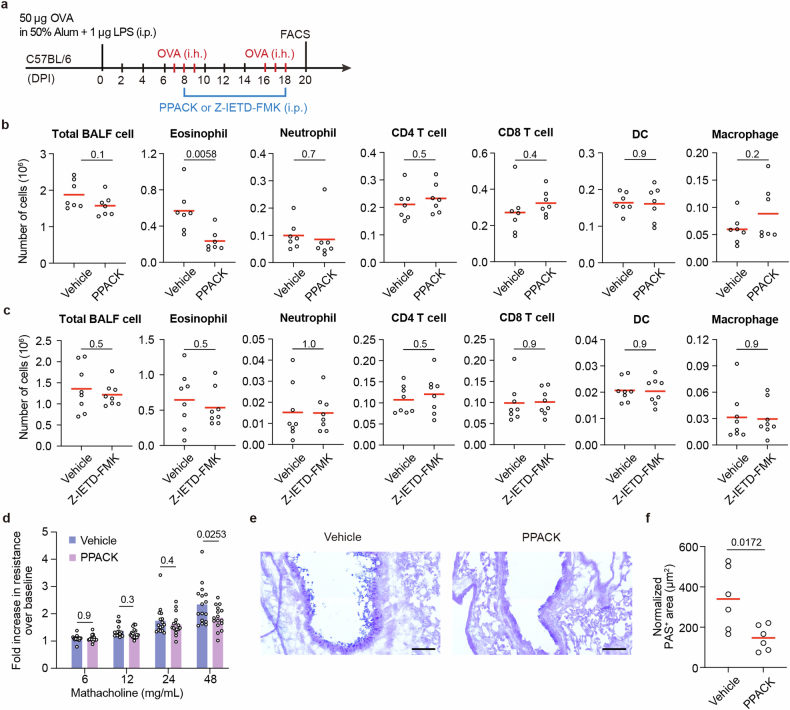
Inflammatory diseases are often chronic and recurrent, and current treatments do not typically remove underlying disease drivers1. T cells participate in a wide range of inflammatory diseases such as psoriasis2, Crohn's disease3, oesophagitis4 and multiple sclerosis5,6, and clonally expanded antigen-specific T cells may contribute to disease chronicity and recurrence, in part by forming persistent pathogenic memory. Chronic rhinosinusitis and asthma are inflammatory airway diseases that often present as comorbidities7. Chronic rhinosinusitis affects more than 10% of the general population8. Among these patients, 20-25% would develop nasal polyps, which often require repeated surgical resections owing to a high incidence of recurrence9. Whereas abundant T cells infiltrate the nasal polyps tissue10,11, T cell subsets that drive the disease pathology and promote recurrence are not fully understood. By comparing T cell repertoires in nasal polyp tissues obtained from consecutive surgeries, here we report that persistent CD8+ T cell clones carrying effector memory-like features colonize the mucosal tissue during disease recurrence, and these cells characteristically express the tryptase Granzyme K (GZMK). We find that GZMK cleaves many complement components, including C2, C3, C4 and C5, that collectively contribute to the activation of the complement cascade. GZMK-expressing CD8+ T cells participate in organized tertiary lymphoid structures, and tissue GZMK levels predict the disease severity and comorbidities better than well-established biomarkers such as eosinophilia and tissue interleukin-5. Using a mouse asthma model, we further show that GZMK-expressing CD8+ T cells exacerbate the disease in a manner dependent on the proteolytic activity of GZMK and complements. Genetic ablation or pharmacological inhibition of GZMK after the disease onset markedly alleviates tissue pathology and restores lung function. Our work identifies a pathogenic CD8+ memory T cell subset that promotes tissue inflammation and recurrent airway diseases by the effector molecule GZMK and suggests GZMK as a potential therapeutic target.


Conflict of interest statement

Competing interests: H.Q. is a cofounder of Emergent Biomed Solutions, Ltd.

Figures

Fig. 1
Fig. 1. Persisting T cell clones in recurrent NP.
a, Workflow for analysis of surgically removed nasal tissues. RT, reverse transcription. b, Overview of surgical intervals for paired samples. See Extended Data Table 1 for more patient information. c, Persistent clones, identified by matched TCRβ sequences, found in paired surgical samples by bulk sequencing analyses. Each symbol represents a single clone. UMI, unique molecular identifier. d,e, UMAP visualization of 15 αβ T cell clusters (T0–T14) found in NP tissues (d) and their relative abundances in each individual (e). f,g, Persistent T cell clones in patients NP11–13. f, Clones with both TCRα and β chains identified in paired samples are superimposed on the UMAP of total T cells from the same patient. Only the top ten clones are shown. g, Abundance and cluster composition of individual persistent clones detected in the scRNA-seq analysis of the most recent NP resection (top) and bulk-seq analysis of the previous resection (bottom). Clones are ranked and numbered by their abundance in the scRNA-seq data.
Fig. 2
Fig. 2. CD8+ T cell subsets in association with NP recurrence.
a, Dot plots showing the expression of selected surface markers by different T cell clusters. Dot size and colour intensity indicate the percentage and the level of expression, respectively. b,c, Representative FACS plots (b) and summary statistics (c) of indicated CD8+ T cell subsets found in HC (n = 8), patients with NP (n = 20) and patients with svNP (n = 20). P values by two-sided Mann–Whitney tests. d, UMAP showing 14 peripheral blood CD8+ T cells clusters (B0–13). Cells isolated from NP11 and NP13 are shown, respectively. e, Clones commonly found in tissue and blood CD8+ T cells, projected onto total tissue T cells from the same individual. f, Abundance and cluster composition of clones found in the blood and paired surgical samples. Clones are numbered as in Fig. 1g. g, Heat maps showing Spearman’s correlation coefficient between T0, T1 and blood CD8+ T cell clusters.
Fig. 3
Fig. 3. Tissue GZMK levels predict NP recurrence and asthma comorbidity.
a,b, Dot plots showing the expression of cytokines (a) and granzymes (b) in NP tissue T cell clusters. c, Representative FACS plots (left) and summary statistics (right) showing GZMK expression in different CD8+ T cell subsets and natural killer (NK) cells from NP tissues, in comparison to plasma cells (CD79a+CD38+) as the negative control. d, Nasal tissue GZMK levels in HC, patients with NP and patients with svNP measured by ELISA. Each circle indicates one patient and lines denote means. P values from two-sided Mann–Whitney tests. e, Receiver-operating characteristics (ROC) curves for predicting svNP on the basis of GZMK levels, IL-5 levels and number of eosinophils in NP tissues, respectively (n = 127). Areas under the curves are indicated and colour-coded. HPF, high-power magnification field.
Fig. 4
Fig. 4. Identification of GZMK substrates.
a, Workflow for the GZMK pull-down assay. b, Representative Coomassie Blue-stained gel showing proteins pulled down by enzymatically inactive GZMK-S214A. Data are representative of three independent experiments using different samples from patients. c, Unique and overlapping GZMK-interacting proteins identified in patients NP15–17. d, Dot plots showing the normalized abundance and SEQUEST scores of the 56 common GZMK-interacting proteins found in all patients. See Methods for more details. e, Cleavage of serum-purified C3 by GZMK. A Coomassie Blue-stained gel (left) and the schematic graph showing the cleavage site (right), as determined by Edman sequencing, are shown. S, serine; N, asparagine; L, leucine. f, Immunoblots showing GZMK cleavage of serum-purified C3. Data are representative of at least three independent experiments (e and f). Source images for gels and blots are presented in Supplementary Fig. 1.
Fig. 5
Fig. 5. GZMK removal reduces inflammation and restores lung function in asthma.
a, Experimental setup. b, Numbers of indicated immune cells in the BALF. Each symbol indicates one mouse, and lines denote means. DC, dendritic cell. c, Lung function and airway hypersensitivity in response to increasing doses of methacholine, measured by the forced oscillation technique (see Methods for more details). Each symbol indicates one mouse and bars denote means. d,e, Lung histology. d, Representative AB-PAS staining of lung tissue sections. e, PAS+ areas in the airway (see Methods for more details). Each symbol indicates one mouse, and lines denote means. Data were pooled from three independent experiments, with at least two animals included in each group. P values by two-sided unpaired t-tests. Scale bars, 100 μm. i.p., intraperitoneal; i.h., inhalation; DPI, days postimmunization.
Extended Data Fig. 1
Extended Data Fig. 1. The sc-RNAseq and Profiling of αβ T cells in nasal tissues.
a, UMAP visualization of total CD45+ cells in nasal tissues from all HCs and NP patients analyzed (related to Fig. 1b). b, Expression levels of CD3D, TRAC, TRDC, NKG7, PTGDR2, CD79A, HLA-DRA, CLEC4C, KIT and GZMK. c, Cells with fully assembled TCRα and β chains are superimposed on total CD45+ cells, visualized by UMAP. d, Dot plots showing expression of the indicated genes in innate lymphoid cells (ILCs)/T cells. The percentage and the level of expression are shown by the dot size and color intensity, respectively. e, Dot plots showing the expression of effector and memory T cell signature genes, based on which the αβ T cell subsets were annotated. The percentage and level of expression are indicated by dot size and colors, respectively. f, Statistics summarizing the relative abundance of different αβ T cell subsets in the nasal tissue from HC (n = 4) and NP (n = 7) patients. Each symbol indicates one patient, and lines denotes means. HC, healthy control; NP, nasal polyp. P values by Mann-Whitney tests.
Extended Data Fig. 2
Extended Data Fig. 2. Analyses of CD8 T cells and NK cells from NP tissue and peripheral blood.
a, Gating strategies for sorting CD8 T cell subsets from NP tissues. b-c, Validation of different NP tissue CD8 T cells subsets by scRNA-seq. b, Clustering of total sorted cells (left) or individual subsets (right). Data were matched to the reference dataset in Fig. 1d. c, Composition of each sorted subset. d, Sorting strategy for blood CD8 T cells. e, Gating strategies for NP tissue NK cells. f, Statistics summarizing the abundances of NK cells in the nasal tissue in HC (n = 8), NP (n = 20) and svNP (n = 20) patients. Each symbol indicates one patient, and lines denote means. P values by Mann-Whitney tests.
Extended Data Fig. 3
Extended Data Fig. 3. Secretion of GZMK by KLRG1+CD27+ T cells.
a-b, Representative FACS plots (a) and summary statistics (b) showing the surface expression of LAMP1 in the indicated cell subsets upon stimulation. c-d, Intracellular levels of GZMK in the LAMP1+ cells within each subset. Representative FACS plots (c) and summary statistics are shown (d). PMA, phorbol 12-myristate 13-acetate; MFI, mean fluorescence intensity. Data are representative of (a and c) or pooled from (b and d) three patients. P values by paired t-tests.
Extended Data Fig. 4
Extended Data Fig. 4. Characterization of GZMK substrates and Comparison between GZMK and other C3 convertases.
a, A representative Coomassie blue-stained gel showing the purified GZMK and GZMKS214A. b, Schematic of a fluorescence resonance energy transfer (FRET)-based protease assay for determining GZMK activity. c, Measurements of GZMK activity using the assay in (b). Lysozyme and Trypsin were included as negative and positive controls, respectively. Each symbol denotes a technical replicate (n = 3), and data are presented as mean±S.D. AU, arbitrary unit. d, Representative immunoblots showing cleavage of SET by GZMK. e, Representative immunoblots showing cleavage of tissue DMBT1 by different doses of GZMK, with β-actin as a sample processing control. Data are representative (a-e) of at least two independent experiments. f, Representative Coomassie Blue-stained gel showing the cleavage of serum-purified C3 by GZMK, C3bBb and C4b2a. g, Statistics summarizing the level of C3a converted by GZMK and C3bBb, as normalized to C4b2a. Each symbol denotes one experiment, and lines denote means. h, Representative HPLC trace (left) and commassie blue-stained gels (right) showing the isolation of C3a. Serum-purified C3 was incubated with recombinant human GZMK or C4b2a assembled from serum-purified components. mAU, milli-absorbance unit. i-j, Immunoblots (i) and summary statistics (j) showing the activation of ERK in THP1 cells by C3a from different sources. Data are representative (f, h and i) or pooled (g and j) from three independent experiments. Each symbol denotes one experiment, and lines denote means. P values by two-sided unpaired t tests. Source images for gels and blots are presented in Supplementary Fig. 1.
Extended Data Fig. 5
Extended Data Fig. 5. GZMK cleavage of additional complement components.
Representative Coomassie Blue-stained gels showing GZMK cleavage of serum-purified C2 (a), C4 (d) and C5 (g), as confirmed by Edman sequencing (b, e and h) and immunoblots (c, f and i). The incubation times are indicated. j, Hemolytic assays to measure the activity of serum-purified C5b6 with or without GZMK cleavage (See Methods for more details). Lysis of chicken erythrocytes were induced by the addition of C5b6 and an excess amount of serum-purified C7, C8 and C9. AU, arbitrary unit. Error bars indicate means± S.D. Each symbol denotes a technical replicate (n = 3), and lines denote means. Data are representative of at least two independent experiments. Source images for gels and blots are presented in Supplementary Fig. 1.
Extended Data Fig. 6
Extended Data Fig. 6. GZMK-expressing CD8 T cells localize to tertiary lymphoid structures.
a-c, IHC analyses of GZMK-expressing CD8 T cells in nasal tissues surgically removed from HCs or different groups of NP patients. a, Representative images of GZMK and CD8 staining. White squares indicate areas containing GZMK-expressing CD8 T cell aggregates; magnified display of the white-square areas provided as insets. Scale bar, 500 μm for the overall view and 50 μm for insets. b, Pie charts classifying individuals in each group into those who’s surgically removed tissues did or did not contain GZMK-expressing CD8 T cell aggregates. Numbers of individuals are indicated. c, Densities of GZMK-expressing CD8 T cell aggregate in NP and svNP patients, presented as fractional distributions. d-g, Expression profiling of tissue areas containing GZMK and cell aggregates by bulk mRNA sequencing analysis. d, Experimental setup. e, A brightfield image of one NP tissue section (Left, crystal violet-stained) and a fluorescent image of an adjacent section (Right, stained with DAPI and an anti-GZMK antibody) section, with pink and cyan circles indicating GZMK+ cell aggregates and control areas excised by laser-capture microdissection. Scale bar, 500 μm. f, Principal component analysis. Each symbol indicates one tissue area. g, Selected differentially expressed genes in the control and GZMK+ areas. h-j, IHC staining of indicated markers (h) and summary statistics of abundance of indicated cell types in control (n = 14) and GZMK+ areas (n = 22) are shown (i and j). Scale bar, 50 μm. Each symbol indicates one selected area, and lines denote means. Tissue sections from three (j) or four (i) patients were included in the analysis, and at least three control and GZMK+ areas were selected for each patient. P values by Mann-Whitney tests.
Extended Data Fig. 7
Extended Data Fig. 7. The murine asthma model.
a, Experimental setup. b, Gating strategies for different immune cell populations in BALF. c, Summary statistics showing the quantifications of BALF cell subsets. d, Expression of Gzmk in CD8 and CD4 T cells sorted from the lung tissue by quantitative RT-PCR. Data were normalized to the expression of Atcb. Data were pooled from two independent experiments, with at least 2 animals included in each group in a single experiment. P values by two-sided unpaired t tests. e-f, sc-RNA sequencing analyses of BALF CD8 T cells collected from C57BL/6 mice after the second OVA challenges as shown in a. e, UMAP visualization of 3 BALF CD8 T cell subsets. f, Violin plots showing the expression of Cd3e, Cd8a, Gzmk, Itgae. Data were combined from two biological replicates, each contains BALF cells pooled from 3 mice.
Extended Data Fig. 8
Extended Data Fig. 8. Functions of CD8 T cell-derived GZMK.
a-e, Induction of airway inflammation in Cd4-cre Gzmk+/+ and Gzmkfl/fl mice. a, Experimental design. b, Numbers of indicated immune cells. c, Lung function of the indicated mice as measured by airway hypersensitivity in response to an increasing dose of methacholine using the forced oscillation technique. Each symbol indicates one mouse, and bars denote means. d, Representative images of Alcian Blue-Periodic acid Schiff (AB-PAS) staining of lung tissue sections. Scale bar, 100 μm. e, Quantifications of PAS+ areas in the airway. f-g, CD8 T cell intrinsic role of GZMK. f, Experimental setup. g, Statistics summarizing the number of immune cells detected in BALF. i.p., intraperitoneal; i.h., inhalation; DPI, days post immunization. Each symbol indicates one mouse, and lines denote means. Data were pooled from two (d-e) or three (b, c and g) independent experiments, with at least two animals included in each group. P values by two-sided unpaired t tests.
Extended Data Fig. 9
Extended Data Fig. 9. CD8 T cell-derived GZMK promotes airway eosinophil recruitment through C3.
a-d, Induction of airway inflammation based on adoptive transfer of OT-I T cells over-expressing Gzmk, GzmkS213A (a and b) and Gzmb (c and d). a and c, Experimental setup. b and d, Numbers of indicated immune cell subsets in BALF. e-f, Asthma induction in C3-/- animals. d, Experimental schedule. e, Statistics summarizing the number of different immune cells in the BALF. Each symbol indicates one mouse, and lines denote means. Data were pooled from two (d and f) or four (b) independent experiments, with at least two animals included in each group. P values by two-sided unpaired t tests.
Extended Data Fig. 10
Extended Data Fig. 10. Effect of granzyme inhibitors.
a, Experimental schedule. PPACK or Z-IETD-FMK was administered intraperitoneally every two days during the indicated period of time. b and c, Summary statistics showing the number of different immune cells in the BALF of PPACK (b) or Z-IETD-FMK (c) treated mice. Each symbol indicates one mouse, and lines denote means. d, Airway hypersensitivity of the vehicle or PPACK treated mice measured using the forced oscillation technique. Each symbol indicates one mouse, and bars denote means. e, Representative AB-PAS staining of lung tissue sections of vehicle or PPACK treated mice. Scale bar, 100 μm. f, Statistics summarizing the PAS+ areas in the airway of indicated mice. Each symbol indicates one mouse, and lines denote means. Data were pooled from two (b, c, e and f) or four (d) independent experiments, with at least two animals included in each group. P values by two-sided unpaired t tests.

Similar articles

Cited by

References

    1. McInnes, I. B. & Gravallese, E. M. Immune-mediated inflammatory disease therapeutics: past, present and future. Nat. Rev. Immunol.21, 680–686 (2021). - PMC - PubMed
    1. Matos, T. R. et al. Clinically resolved psoriatic lesions contain psoriasis-specific IL-17-producing alphabeta T cell clones. J. Clin. Invest.127, 4031–4041 (2017). - PMC - PubMed
    1. Camus, M. et al. Oligoclonal expansions of mucosal T cells in Crohn’s disease predominate in NKG2D-expressing CD4 T cells. Mucosal Immunol.7, 325–334 (2014). - PubMed
    1. Morgan, D. M. et al. Clonally expanded, GPR15-expressing pathogenic effector TH2 cells are associated with eosinophilic esophagitis. Sci. Immunol.10.1126/sciimmunol.abi5586 (2021). - PMC - PubMed
    1. Skulina, C. et al. Multiple sclerosis: brain-infiltrating CD8+ T cells persist as clonal expansions in the cerebrospinal fluid and blood. Proc. Natl Acad. Sci. USA101, 2428–2433 (2004). - PMC - PubMed

MeSH terms

LinkOut - more resources