. 2025 Feb;638(8051):752-759.
doi: 10.1038/s41586-024-08424-7. Epub 2025 Jan 15.

Autoactive CNGC15 enhances root endosymbiosis in legume and wheat

Affiliations

Autoactive CNGC15 enhances root endosymbiosis in legume and wheat

Nicola M Cook et al. Nature. 2025 Feb.

Abstract

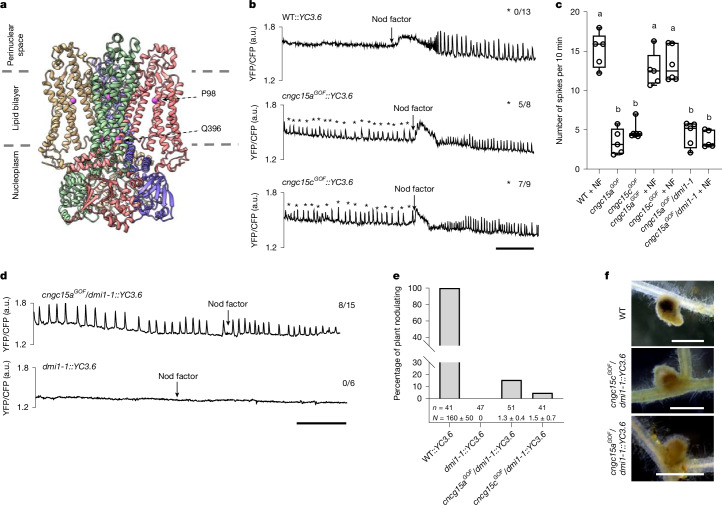
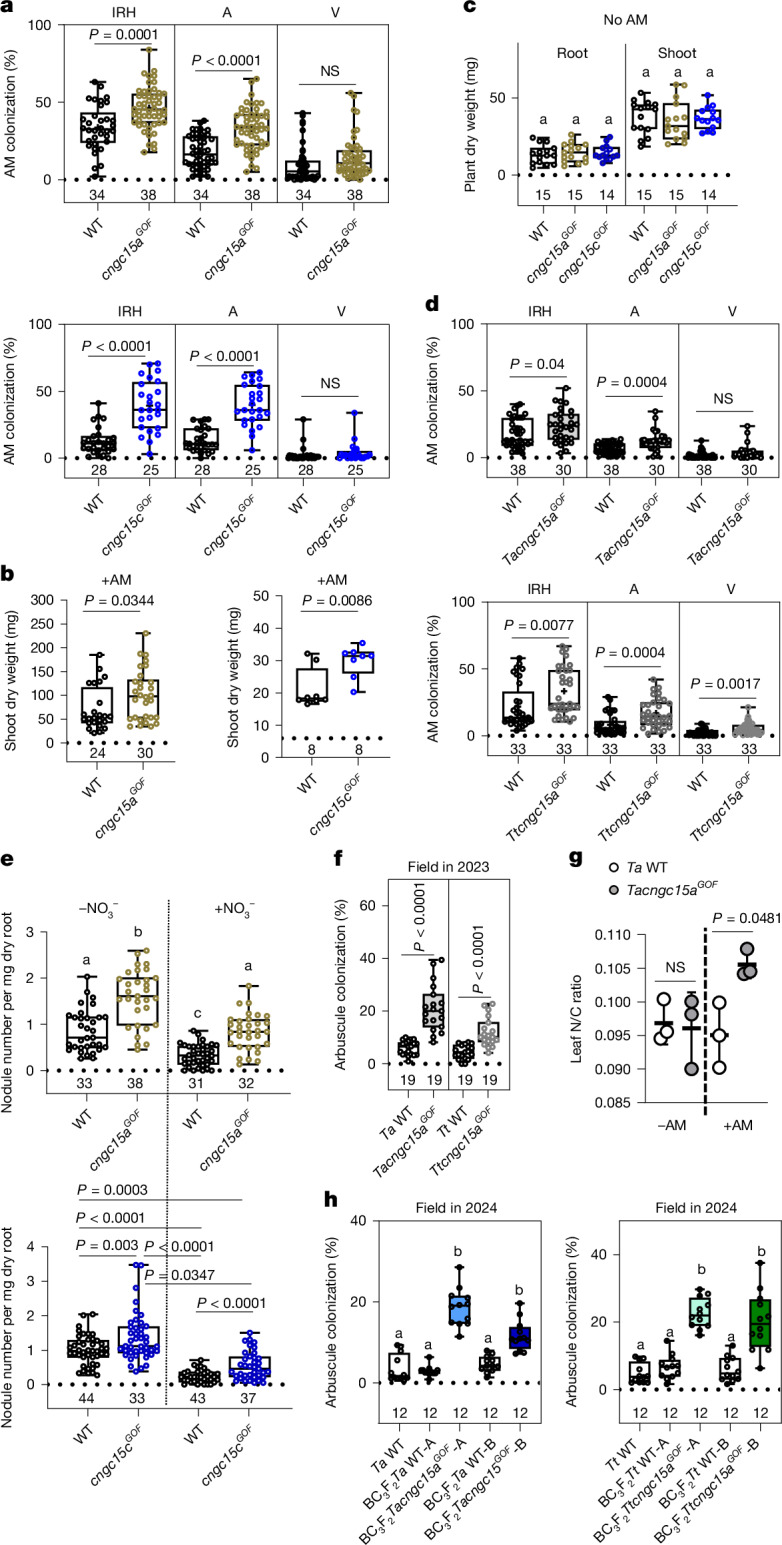
Nutrient acquisition is crucial for sustaining life. Plants develop beneficial intracellular partnerships with arbuscular mycorrhiza (AM) and nitrogen-fixing bacteria to surmount the scarcity of soil nutrients and tap into atmospheric dinitrogen, respectively1,2. Initiation of these root endosymbioses requires symbiont-induced oscillations in nuclear calcium (Ca2+) concentrations in root cells3. How the nuclear-localized ion channels, cyclic nucleotide-gated channel (CNGC) 15 and DOESN'T MAKE INFECTIONS1 (DMI1)4 are coordinated to specify symbiotic-induced nuclear Ca2+ oscillations remains unknown. Here we discovered an autoactive CNGC15 mutant that generates spontaneous low-frequency Ca2+ oscillations. While CNGC15 produces nuclear Ca2+ oscillations via a gating mechanism involving its helix 1, DMI1 acts as a pacemaker to specify the frequency of the oscillations. We demonstrate that the specificity of symbiotic-induced nuclear Ca2+ oscillations is encoded in its frequency. A high frequency activates endosymbiosis programmes, whereas a low frequency modulates phenylpropanoid pathways. Consequently, the autoactive cngc15 mutant, which is capable of generating both frequencies, has increased flavonoids that enhance AM, root nodule symbiosis and nutrient acquisition. We transferred this trait to wheat, resulting in field-grown wheat with increased AM colonization and nutrient acquisition. Our findings reveal a new strategy to boost endosymbiosis in the field and reduce inorganic fertilizer use while sustaining plant growth.


Conflict of interest statement

Competing interests: The authors declare no competing interests.

Figures

Fig. 1
Fig. 1. Enhanced root nodule symbiosis in cngc15aGOF and cngc15cGOF mutants.
a, Schematic representation of CNGC15a and CNGC15c, including the calmodulin-binding domain (IQ), the six transmembrane helices S1–S6 and the N-terminal domain. The arrowheads indicate the position of the amino acid substitution P98S in CNGC15aGOF and the corresponding P104S substitution in CNGC15cGOF. b, Amino acid sequence logo conservation of helix S1 from CNGC encoded within M.truncatula and Arabidopsis thaliana, and CNGC15 encoded within Glycine max, Solanum lycopersicum, T. aestivum, Oryza sativa, Zea mays and Arachis hypogaea. Sequences are indicated in Supplementary Information. c, Infection pockets (IPs) and infection threads (ITs) of WT, cngc15aGOF and cngc15cGOF 5 dpi with S.meliloti 2011::lacZ. Data represent three biological replicates (n = 15). Two-tailed unpaired t-test with a previous F-test for homoscedasticity. IP (WT versus cngc15aGOF) P = 0.0015, IP (WT versus cngc15cGOF) P < 0.0001, IT (WT versus cngc15aGOF) P = 0.0002 and IT (WT versus cngc15cGOF) P = 0.0002. d,e, Number of nodules formed after 14 (d) and 28 (e) dpi with Sm2011. The numbers under the boxes denote the sample size (n). The data represent three biological replicates. ce, Box and whisker plots show 25% and 75% percentiles, median, minimum and maximum. d, Two-tailed unpaired t-test with a previous F-test for homoscedasticity. P value is indicated. e, One-way analysis of variance (ANOVA) with Bonferroni’s multiple comparison test. Different letters indicate statistical significance. Total: (A17 versus cncg15aGOF) P = 0.0472, (A17 versus cncg15cGOF) P < 0.0001, (cncg15aGOF versus cncg15cGOF) nonsignificant (NS); white nodules: (A17 versus cncg15aGOF) NS, (A17 versus cncg15cGOF) P = 0.0078, (cncg15aGOF versus cncg15cGOF) P = 0.0035; pink nodules: (A17 versus cncg15aGOF) P < 0.0001, (A17 versus cncg15cGOF) P = 0.0174, (cncg15aGOF versus cncg15cGOF) P = 0.0030. f, Nitrogen (N)-to-carbon (C) ratio in leaves of WT, cngc15aGOF and cngc15cGOF; 28 dpi with Sm2011. Scatter plots show mean ± s.d. Data represent four biological replicates. Two-tailed unpaired t-test with a previous F-test for homoscedasticity. P value is indicated. Source Data
Fig. 2
Fig. 2. CNGC15GOF autoactivates low-frequency Ca2+ oscillations.
a, Representation of the AlphaFold2 model of CNGC15a, with subunits illustrated in different colours. The grey horizontal dashed lines delineate the expected extent of the lipid bilayer. The positions of residue P98 in S1 and residue Q396 at the channel gate are indicated by the magenta spheres. b,d, Representative Ca2+ oscillations recorded in YC3.6-expressing lines of WT, cngc15aGOF and cngc15cGOF (b) and cngc15aGOF/dmi1-1 (d) before and after addition of Nod factor (NF) (10−8 M). The traces show the ratio of yellow fluorescent protein (YFP)/cyan fluorescent protein (CFP) fluorescence in arbitrary units (a.u.). b, Stars indicate spontaneous Ca2+ oscillations, and the numbers of plants responding over the total number of plants recorded are indicated on the right. c, Analyses of the Ca2+ oscillation frequency before and after the NF recorded in b and d. Box and whisker plots show 25% and 75% percentiles, median, minimum and maximum. One-way ANOVA with Bonferroni’s multiple comparison test. Different letters indicate statistical significance; P < 0.0001. e, Percentage of plant nodulating after 70 dpi with Sm2011/lacZ. n and N indicate the number of plants analysed and the average number of nodules per nodulating plant ± s.d., respectively. (WT::YC3.6) n = 41, (dmi1-1::YC3.6) n = 47, (cncg15aGOF/dmi1-1::YC3.6) n = 51 and (cncg15cGOF/dmi1-1::YC3.6) n = 41. f, Representative pictures of infected nodules formed in WT and double mutants cngc15aGOF/dmi1-1::YC3.6 and cngc15cGOF/dmi1-1::YC3.6. Scale bars, 10 min (b,d), 1 mm (f). Source Data
Fig. 3
Fig. 3. M.truncatula and wheat cngc15GOF mutants benefit from enhanced AM symbiosis.
a, AM colonization, including percentage intraradical hyphae (IRH), arbuscules (A) and vesicles (V) of M.truncatula cngc15aGOF and cngc15cGOF, 5 weeks post-inoculation (wpi) with R.irregularis. b,c, Shoot and root dry weight measured 28 days post-growth without R.irregularis (c) and shoot dry weight 28 dpi with R.irregularis (b). d, Percentage AM colonization, including IRH, A and V of T.aestivum cv. Cadenza Tacngc15aGOF and T. turgidum cv. Kronos Ttcngc15aGOF under greenhouse-controlled conditions 8 wpi with R.irregularis. e, Number of nodules formed in M.truncatula WT, cngc15aGOF and cngc15cGOF in the presence and absence of 3 mM KNO3 28 dpi with Sm2011. f, Percentage arbuscule colonization in T.aestivum cv. Cadenza WT (TaWT), Tacngc15aGOF, T.turgidum cv. Kronos WT (TtWT) and Ttcngc15aGOF, 13 wpi with R.irregularis in the field. g, Nitrogen (N)-to-carbon (C) ratio in flag leaf of WT T.aestivum cv. Cadenza and Tacngc15aGOF from the field experiment (f), collected 13 wpi with AM inoculation (+AM) or without (−AM). Values represent three different plots. h, Percentage of arbuscule colonization of TtWT, TaWT and two independent BC3F2 homozygous lines for each Tacncg15aGOF and Ttcngc15aGOF (A and B) and their respective BC3F2 WT, 13 wpi with R.irregularis in the field. af,h, Box and whisker plots show 25% and 75% percentiles, median, minimum and maximum. The number of plants analysed is indicated below the grid line. a,c,d,f,g, Statistical significance is indicated; two-tailed unpaired t-test, previous F-test for homoscedasticity. c,e,h, One-way ANOVA with Bonferroni’s multiple comparison test. Different letters indicate statistical significance. e, Top panel P < 0.0001. h, P < 0.0001. ae, Three biological replicates were performed. Source Data
Fig. 4
Fig. 4. Low-frequency Ca2+ oscillations of cngc15GOF mutants modulate root phenylpropanoid pathways.
a, Venn diagram showing overlap of differentially expressed genes (DEGs) in cngc15aGOF (15aGOF) and cngc15cGOF (15cGOF) versus WT (308 genes), cngc15aGOF and cngc15cGOF treated with Nod factor (NF) for 3 h versus mock (1,499 genes) and WT treated with NF for 3 h versus mock (2,718 genes) (P value < 0.05). b, Heat map showing DEGs in 15aGOF and 15cGOF mock or in response to NF identified in a that overlaps with DEGs in WT (clusters AB, ABC and AC) or not (clusters B, BC and C) and in 15aGOF/dmi3-1 mock. c, Heat map showing the log2 fold change (FC) of endosymbiotic genes, which are not induced in 15aGOF and 15cGOF in the absence of NF. d, Quantitative expression analysis of NIN and ENOD11 relative to UBC9, with (+) and without (−) 3 h NF; values from three biological replicates. eh, Heat map showing the log2FC of genes over-represented in either cluster AB–ABC (e), cluster C (f) or DEGs in response to NF and 3 mM nitrate treatment (g), including CHS (h). e,f, Fisher’s exact test, two-tailed, false discovery rate (FDR) < 5 × 10−4. g,h, P value < 0.05. i, Schematic representation of core phenylpropanoid pathways; phenylalanine ammonia lyase (PAL), cinnamic acid 4-hydroxylase (C4H), 4-coumarate:CoA ligase (4CL), chalcone synthase (CHS), dirigent protein (DIR) and dihydroflavonol reductase (DFR). DEG of cngc15GOF upregulated, red; downregulated, blue. The dark arrow indicates one step; the grey dashed arrow indicates multiple enzymatic steps. j, Relative abundance of naringenin and liquiritigenin in three biological replicates of WT and cngc15cGOF roots after 21 days of growth in the presence or absence of Sm2011 (optical density at 600 nm (OD600) = 0.01), and in WT roots after 5 weeks of inoculation with R.irregularis (AM). d,j, Scatter plots show mean, s.d. One-way ANOVA, Dunnett’s multiple comparison test versus WT. d, Different letters indicate statistical difference (j). j, Two-tailed unpaired t-test with a previous F-test for homoscedasticity. RNA-seq reads in b, e and f reproduced from ref. , Springer Nature, under a Creative Commons licence CC BY 4.0, and ref. , American Association for the Advancement of Science. Source Data
Extended Data Fig. 1
Extended Data Fig. 1. Nodulation phenotyping of cngc15 TILLING mutants.
a, TILLING mutant in S1-S4 sequence of CNGC15a and CNGC15c. b, Schematic representation of CNGC15a and CNGC15c including the calmodulin binding domain (IQ) and the six transmembrane helices S1 to S6. The amino acid substitutions in the cngc15 mutants analysed in this study are indicated and located within the helices S1 and S2. c, Number of nodules observed in cngc15 mutants 21 dpi with S. meliloti 2011. Scatter dot plots show mean ± s.d. Numbers indicate sample size (n), two-tailed unpaired t-test with a prior F-test for homoscedasticity. d, Number of nodules per plant in F2 segregating population of cngc15aP98S backcrossed with WT. Numbers in brackets indicate number of plants genotyped WT, heterozygous (Het) and Homozygous (Hom). Box and whisker plots show 25% and 75% percentiles, median, minimum, and maximum (One way ANOVA with Tukey’s multiple comparison test, different letters indicate significant difference with (F2 WT vs F2 Het) p = 0.0472, (F2 WT vs F2 Hom) p = 0.0056, (F2 Het vs F2 Hom) p = 0.2395). e, Number of nodules formed after 14 dpi with Sm2011, including the number of white and pink nodules. Number under boxes denotes sample size (n). The data represent three biological replicates. Box and whisker plots show 25% and 75% percentiles, median, minimum and maximum. Two-tailed unpaired t-test with a prior F-test for homoscedasticity. (Total) p = 0.0005, (White) p = 0.0287, (Pink) p < 0.0001. Source Data
Extended Data Fig. 2
Extended Data Fig. 2. P98S or P98L substitutions are predicted to open CNGC15a gate.
a, Cartoon representation of the CNGC15a homotetramer predicted using AlphaFold2 with the subunits shown in different colours; the expected extent of the lipid bilayer is delineated by the grey horizontal dashed lines. b, Single subunit corresponding to the salmon-coloured chain in (a) shown in rainbow colouration from blue at the N-terminus through to red at the C-terminus. The positions of the residues Pro98 and Gln396 are indicated by magenta spheres; the six transmembrane helices are labelled S1-S6. Note the kink in S1 at Pro98. Also shown enlarged are orthogonal views of S1 and S4, illustrating the predicted effect of the P98S (or P98L) substitution that imposes ideal helical geometry on S1 (in grey) whilst keeping it anchored at the upper end, resulting in a clash with the lower end of S4. c, A thin slice through a molecular surface of the model, as viewed from below with respect to the view shown in (a) and at the level of the channel gating residues Q396 (indicated by the red triangles in (a)). The inset close-up clearly shows CNGC15a gating residues Q396. d, A superposition of the MtCNGC15a model (cyan carbons) with experimental structures of EAG1 (orange carbons) and hERG (magenta carbons), showing the same view as the (c) inset, but with a thicker slab setting; all models are shown as Cα traces with the side-chains of the gating glutamine residues as sticks. The inset close-up emphasises that the conformation of the wild type MtCNGC15a model more closely resembles the closed conformation of EAG1 than the open conformation of hERG. e, Schematic representation of the main transmembrane helices of the salmon-coloured subunit in (a), with connections shown as simple loops (lengths can be inferred from residue numbering at the ends of each helix in cyan). Helix S6 from the opposing subunit is shown is in pale yellow to highlight the location of the channel. f, View from below at the level of the gate, corresponding to that shown in (c). For simplicity, the full complement of helices is shown for the right-hand subunit only (salmon). The coloured arrows indicate possible structural changes caused by the P98S/P98L substitution (see key for details) that result in channel opening as illustrated in the lower panel.
Extended Data Fig. 3
Extended Data Fig. 3. Nuclear-localized CNCG15GOF generates spontaneous nuclear Ca2+ oscillation in F1 hybrid roots.
a, CNGC15GOF localizes at the nuclear envelope. Representative images of M. truncatula root hairs expressing C-terminal green fluorescent protein (GFP) tagged CNGC15cGOF under the control of nopaline synthase promoter (pNOS) or the empty vector (EV) with the red fluorescent protein (mCherry) used as fluorescent plant transformation marker. The pictures are representative of 4 biological replicates. Scale bars = 10 µm. b, Expression analysis of CNGC15a and CNGC15c by qRT-PCR in the roots of two days old M. truncatula wild type (WT), cngc15aGOF and cngc15cGOF. Expression was normalised to UBC9 (TC106312). Bars, error bars and circles represent mean, standard deviation, and individual values, respectively, (n = 4). (One-way ANOVA; posthoc Bonferroni). c, Scatter dot plot representing the basal CFP/YFP fluorescence ratio (R0) in plants recorded in Fig. 1b. The R0 was computed as the mean of the ratios CFP/YFP obtained during the 23 frames prior Nod factor addition for the wild type (WT), or between spontaneous spike for the mutant cngc15aGOF and cngc15cGOF. Ratio of YFP/CFP fluorescence is represented in arbitrary units (A.U.). Bar indicates mean and error bar indicates standard deviation (SD). One-way ANOVA; posthoc Tukey, n (WT) = 13, n (cngc15aGOF) = 5, n (cngc15cGOF) = 7. (WT vs. cncg15aGOF) p = 0.9132, (WT vs. cncg15cGOF) p = 0.9694, (cncg15aGOF vs. cncg15cGOF) p = 0.9832. d, Representative recording of spontaneous nuclear Ca2+ oscillation in root hair cells of F1 hybrid seedlings obtained from cross pollination between cngc15aGOF (♀) or cngc15cGOF (♀) and wild type A17::YC3.6 (♂). Ratio of YFP/CFP fluorescence is represented in arbitrary units (A.U.). Numbers on the right corner indicate the number of F1 plants (N) and nuclei (n) responding with spontaneous Ca2+ oscillation versus the number of plants and nuclei analysed for each genotype. Stars indicate spontaneous Ca2+ spike. Source Data
Extended Data Fig. 4
Extended Data Fig. 4. Spontaneous low-frequency nuclear Ca2+ oscillation in cngc15aGOF/dmi1-1 is sustained by the action of CaM2 and is sufficient to restore rare nodule-like structure.
a, Representative low-frequency Ca2+ oscillation in M. truncatula cngc15aGOF/dmi1-1 double mutant root hair cells co-expressing the nuclear-localized yellow cameleon 3.6 (NLS:YC3.6) alone (EV) or with RNAiCaM2. The represented traces show the ratio of YFP/CFP fluorescence in arbitrary units (A.U.). The number of plants and nuclei presenting spontaneous Ca2+ oscillations is shown in relation to the total number of plants and nuclei recorded. b, Number of plants and nodule-like structures observed on the root system of the wild type M. truncatula cv. A17, dmi1-1, cngc15aGOF, cngc15cGOF and the double mutant cngc15aGOF/dmi1-1 after 98 days of growth. c, Representative picture of the nodule-like structure observed. Scale bar indicates 1 cm. Source Data
Extended Data Fig. 5
Extended Data Fig. 5. The calcium binding pockets of DMI1 provide the positive feedback to regulate its pacemaker activity and DMI1TVGYG restores nuclear Ca2+ oscillation and root nodule symbiosis.
a, Representative Nod factor-induced Ca2+ oscillation in M. truncatula dmi1-1 mutant root hair cells co-expressing the nuclear-localized yellow cameleon 3.6 (NLS:YC3.6) alone (EV) or with UBI:DMI1, UBI:DMI1D470A, UBI:DMI1D470A-E571Q, and in M. truncatula cngc15aGOF/dmi1-1 mutant root hair cells co-expressing NLS:YC3.6 with UBI:DMI1D470A-E571Q. The represented traces show the ratio of YFP/CFP fluorescence in arbitrary units (A.U.). The number of plants and nuclei presenting Ca2+ oscillations in response to Nod factor are shown in relation to the total number of plants and nuclei recorded. The blue arrow indicates Nod factor application. b, Functional complementation assay of the yeast MAB2d mutant strain expressing either the wild type DMI1 or the DMI1TVGYG variant, possessing the BK channel filter. The scatter graphs with bar represent the growth of MAB2d strain lacking the potassium transporter Trk1 and Trk2 and transformed with either the empty vector (EV), pGAL1:DMI1 or pGAL1:DMI1TVGYG. The growth of the yeast transformants is assessed by the measure of the optical density at 600 nm (OD600) after 1 and 7 days of culture in liquid synthetic dropout media lacking tryptophan and supplied with 1% galactose, 1% raffinose and supplemented with the indicated concentration of KCl. Scatter dot plots with bar and error bar indicating mean and standard deviation, respectively. The assays include three biological replicates. Treatments with 0.5 mM KCl were performed with (EV) n = 4, (DMI1) n = 4, (DMI1TVGYG) n = 4, and with 5 mM KCl day 1: (EV) n = 4, (DMI1) n = 4, (DMI1TVGYG) n = 4, day 7: (EV) n = 3, (DMI1) n = 4, (DMI1TVGYG) n = 4, (Two-way ANOVA with Sidak’s multiple comparison). 0.5 mM KCl, 7 days; (EV vs. DMI1) non-significant, (EV vs. DMI1TVGYG) p = 0.0001, (DMI1 vs. DMI1TVGYG) p = 0.0002. 5 mM KCl, 7 days; (EV vs. DMI1) non-significant, (EV vs. DMI1TVGYG) p = 0.0002, (DMI1 vs. DMI1TVGYG) p < 0.0001. c, Representative Nod factor (10−8 M)-induced Ca2+ oscillation in M. truncatula dmi1-1 mutant root hair cells co-expressing the nuclear localized yellow cameleon 3.6 (NLS:YC3.6) with UBI:DMI1 or UBI:DMI1TVGYG. The represented traces show the ratio of YFP/CFP fluorescence in arbitrary units (A.U.). The number of nuclei presenting Ca2+ oscillations in response to Nod factor (arrowhead) is shown in relation to the total nuclei recorded within three independent transformed plants. d, Number of nodules formed on dmi1-1 mutant roots co-expressing M. truncatula DMI1 or DMI1TVGYG driven by the Lotus japonicus ubiquitin (UBI1) promoter, or the empty vector (EV) and the nuclear localized yellow cameleon 3.6 (NLS:YC3.6), 28 dpi with Sm2011. Box and whisker plots show 25% and 75% percentiles, median, minimum and maximum, of 3 biological replicates. Different letters indicate significant differences (One-way ANOVA; posthoc Bonferroni), n(EV) = 19, n(DMI1) = 17, n(DMI1TVGYG) = 21. (EV vs DMI1) p < 0.0001, (EV vs DMI1TVGYG) p = 0.0033, (DMI1 vs DMI1TVGYG) non-significant. e, Representative pictures of nodules formed on dmi1-1 root transcomplemented in (a). Scale bar = 1 mm. Source Data
Extended Data Fig. 6
Extended Data Fig. 6. Phylogenetic analyses of the CNGC15 family and amino acid alignment of Medicago truncatula and Triticum sp. CNGC15a and CNGC15aGOF.
a, Maximum likelihood tree using amino acid sequences under the JTT + G4 substitution model. The sequences used are available in SI Table 3. Ultrafast bootstrap support values over 90 are labelled on the branches as blue dots. The tree is rooted with gymnosperm CNGC clade III sequences. Species abbreviation - At: Arabidopsis thaliana; Am: Amborella trichopoda; Bd: Brachypodium distachyon; Gm: Glycine max; Mt: Medicago truncatula; Os: Oryza sativa; Pt: Populus trichocarpa; Ta: Triticum aestivum; Sl: Solanum lycopersicum; Vv: Vitis vinifera; Zm: Zea mays. b, The mutated sites of MtCNGC15aGOF 104 P > S; MtCNGC15cGOF 98 P > S; TaCNGC15aGOF_D1 cv. Cadenza 111 P > S; TtCNGC15aGOF_A1 cv. Kronos P111 > L are highlighted.
Extended Data Fig. 7
Extended Data Fig. 7. cngc15aGOF does not activate ENOD11 expression in the absence of Nod factor.
β-glucuronidase (GUS) activity in root induction zones of M. truncatula wild type (WT) expressing pENOD11:GUS and cngc15aGOF expressing pENOD11:GUS, 6 h after incubation with NF (+NF), without NF (-NF) and 6 dpi with S. meliloti 2011. Scale bar = 100 µm. Representative pictures of plants from one of three biological replicates, with each replicate consisting of n = 5 plants per treatment.
Extended Data Fig. 8
Extended Data Fig. 8. cngc15GOF primes phenylpropanoid pathways.
a, b Expression analysis of DIR23 and DIR44 by qRT-PCR in root of wild type (WT),cngc15aGOF and cngc15aGOF/dmi3-1 treated or not with 10−8 M Nod factor (+NF). Expression was normalised to UBC9 (TC106312). Bars, error bars and circles represent mean, standard deviation and individual values, respectively, with DIR23, n = 4; DIR44, n = 3 in (a), and DIR23, DIR44, n = 6 in (b). (a) Different letters indicate significant differences (One-way ANOVA; posthoc Bonferroni). DIR23; MtrunA17Chr4g0030671 (WT vs. WT + NF) p = 0.0273, (WT vs. cncg15aGOF) p = 0.002, (WT vs. cncg15aGOF + NF) p = 0.0002. DIR44; MtrunA17Chr8g0392441 (WT vs. WT + NF) p = 0.0031, (WT vs. cncg15aGOF) p = 0.0075, (WT vs. cncg15aGOF + NF) p = 0.0301. (b) Two-tailed unpaired t-test with a prior F-test for homoscedasticity. n.s. indicates non-significant. c, Heatmap showing the Log2FC of the DEGs in roots of cngc15aGOF and cngc15cGOF that belong to cluster C (See Fig. 4a,b) and their expression after 24 h Nod factor (NF) treatment and 27 dpi with R. irregularis. (R.irr.). Wald test, two-sided, p-value < 0.05. d, Expression analysis of NIN and CHS-1B by qRT-PCR in root of wild type (WT) and cngc15aGOF 21 dpi with Sm2011. Expression was normalised to UBC9 (TC106312). Bars, error bars and circles represent mean, standard deviation, and individual values, respectively, (n = 3). Different letters indicate significant differences (One-way ANOVA; posthoc Bonferroni). NIN: (WT vs. WT21 dpi) p < 0.0001, (WT vs. cncg15aGOF) non-significant (n.s), (WT vs. cncg15aGOF 21 dpi) p < 0.0001, (WT 21 dpi vs. cncg15aGOF) p < 0.0001, (WT 21 dpi vs. cncg15aGOF 21 dpi) n.s., (cncg15aGOF vs cncg15aGOF 21 dpi) p < 0.0001. CHS-1B: (WT vs. WT21 dpi) p = 0.0106, (WT vs. cncg15aGOF) n.s, (WT vs. cncg15aGOF 21 dpi) p < 0.0001, (WT 21 dpi vs. cncg15aGOF) p = 0.0168, (WT 21 dpi vs. cncg15aGOF 21 dpi) p = 0.0012, (cncg15aGOF vs cncg15aGOF 21 dpi) p < 0.0001. e, Venn diagram showing the overlapping differentially expressed genes (DEGs) identified by RNAseq analysis between WT treated with Nod factor (NF) and WT or cngc15aGOF treated with NF in the presence of 3 mM KNO3., Wald test, two-sided, p-value < 0.05. f, Heatmap showing the Log2FC of the DEGs that belong to endosymbioses and phenylpropanoid pathways induced by 3 h NF treatment in WT, and in WT and cngc15aGOF incubated with 3 mM KNO3-. Wald test, two-sided, p-value < 0.05. RNA-seq read in c reproduced from ref. , under a Creative Commons licence CC BY 4.0, and ref. , American Association for the Advancement of Science. Source Data
Extended Data Fig. 9
Extended Data Fig. 9. Flavonoids promote endosymbiosis in M. truncatula and wheat.
a, Number of nodules per composite plant expressing the empty vector (EV) or the chalcone synthase hairpin construct (RNAiCHS) in wild type root systems 21 days post inoculation with S. meliloti 2011. b, Expression analysis of the chalcone synthase (CHS) MtrunA17Chr1g0201391 and MtrunA17Chr3g0121531 by qRT-PCR in root analysed in (a). Expression was normalised to UBC9 (TC106312). c, Percentage of root length colonization by Rhizophagus irregularis, including intraradical hyphae (IRH), arbuscules (A) and vesicles (V) after 5 weeks of inoculation with 1:5 R. irregularis inoculum:soil, in roots expressing the empty vector (EV) or the chalcone synthase hairpin construct (RNAiCHS). a-c, Scatter dot plot shows the mean ± standard deviation. Two-tailed unpaired t-test with a prior F-test for homoscedasticity. The number of biologically independent samples (n) examined over two biological replicates is as follows: (a), EV(n = 6), RNAiCHS (n = 8); (b), MtrunA17Chr1g0201391, EV(n = 5), RNAiCHS(n = 6) and MtrunA17Chr3g0121531, EV(n = 4), RNAiCHS(n = 5); (c), EV(n = 10), RNAiCHS(n = 6). d, Targeted analysis of the abundance of liquiritigenin and retusin in root of wild type T. aestivum cv. Cadenza (WT) and Tacngc15aGOF after 7 weeks of growth in greenhouse conditions. Scatter plots show mean, ± standard deviation. Two-tailed unpaired t-test with a prior F-test for homoscedasticity. The data represent for liquiritigenin three biological replicates and retusin four biological replicates. e, External application of 0.1 µM retusin enhances percentage of arbuscule colonization in wild type T. aestivum cv. Cadenza (TaWT) after 8 weeks of inoculation with R. irregularis. The box and whiskers plots show individual data (n = 18) from three biological replicates, maximum, minimum, median and mean (+). Two-tailed unpaired t-test with a prior F-test for homoscedasticity. f-h, Number of nodules per mg of root dry weight of wild type M. truncatula 14 days post inoculation with S. meliloti 2011 and supplied with water or water containing 0.1 µM naringenin, liquiritigenin or retusin. f, g, Box and whiskers plots show individual data, boxes bound the interquartile range (25th to the 75th percentile) divided by the median, and whiskers show the maximum, minimum, and mean (+) of the total number of nodules, small white (h) or mature pink nodules (h). Results represent the average of three biological replicates for naringenin and liquiritigenin (f) with n (Water) = 35, n (Naringenin)= 35, n (Liquiritigenin) = 32, and two biological replicates for retusin (g) with n (Water) = 20, n (Retusin) = 20. f, Different letters indicate significant differences between treatments within the categories of total, small, or mature nodules (One-way ANOVA, Tukey’s multiple comparison). Total (Water vs. Naringenin) p < 0.0001, Total (Water vs. Liquiritigenin) p < 0.0001, (Naringenin vs. Liquiritigenin) p = 0.1201; White (Water vs. Naringenin) p < 0.0001, (Water vs. Liquiritigenin) p = 0.0019, (Naringenin vs. Liquiritigenin) p = 0.1487; Pink (Water vs. Naringenin) p = 0.0004, (Water vs. Liquiritigenin) p = 0.0037, (Naringenin vs. Liquiritigenin) p = 0.8310. g, Two-tailed unpaired t-test with a prior F-test for homoscedasticity. Water vs. Retusin: Total p < 0.0001, White p = 0.1625, Pink p < 0.0001. h, Representative pictures of small white and mature pink nodules developed. White and pink arrowheads indicate small and mature nodules, respectively. Scale bar indicates 1 mm. i, j, Percentage of root length colonization by Rhizophagus irregularis, including intraradical hyphae (IRH), arbuscules (A) and vesicles (V) after 5 weeks of inoculation with 1:5 R. irregularis inoculum:soil (i) or 1:7 R. irregularis inoculum:soil (j). Box and whiskers plots show individual data, boxes bound the interquartile range (25th to the 75th percentile) divided by the median, and whiskers show the maximum, minimum, and mean (+). Results represent the average of two biological replicates for liquiritigenin (i) with n (Water) = 14, n (Liquiritigenin) = 23, three biological replicates for naringenin (i) with n (Water) = 26, n (Naringenin) = 24, and three biological replicates for retusin (j) with n (Water) = 29, n (Retusin) = 30. Two-tailed unpaired t-test with a prior F-test for homoscedasticity, p values indicated. Source Data
Extended Data Fig. 10
Extended Data Fig. 10. CNGC15GOF enhances flavonoids abundance in M. truncatula roots.
a, Heatmap of the significantly differentially abundant metabolites in roots of wild type (WT) mycorrhized (AM) versus non-mycorrhized (mock), cngc15cGOF versus WT 21 days post inoculation with Sm2011 (+Sm2011) or/and cngc15cGOF versus WT non-inoculated. Limma test, two sided, with a prior Shapiro-Wilk test for homoscedasticity. Post hoc Benjamini and Hochberg. p-value < 0.05. b, Relative abundance of flavonoids identified across root of wild type (WT) and cngc15cGOF after 21 days of growth in presence or absence of Sm2011 (OD = 0.01). Scatter plots show mean and standard deviation. Results represent three biological replicates. Different letters indicate statistical significance, One-way ANOVA, Dunnett’s multiple comparison test vs. WT. Isoliquiritigenin: (WT vs. cncg15cGOF) p = 0.0451, (WT vs. WT + Sm2011) p = 0.4703, (WT vs. cncg15cGOF + Sm2011) p = 0.0219. Glycitein: (WT vs. cncg15cGOF) p = 0.3611, (WT vs. WT + Sm2011) p = 0.6383, (WT vs. cncg15cGOF + Sm2011) p = 0.3118. Retusin-flavonol: (WT vs. cncg15cGOF) p = 0.8585, (WT vs. WT + Sm2011) p = 0.0539, (WT vs. cncg15cGOF + Sm2011) p = 0.2934. Daidzein: (WT vs. cncg15cGOF) p = 0.5571, (WT vs. WT + Sm2011) p = 0.8202, (WT vs. cncg15cGOF + Sm2011) p = 0.2177. Genistein: (WT vs. cncg15cGOF) p = 0.2768, (WT vs. WT + Sm2011) p = 0.1218, (WT vs. cncg15cGOF + Sm2011) p = 0.9177. (-)-Medicocarpin: (WT vs. cncg15cGOF) p = 0.5413, (WT vs. WT + Sm2011) p = 0.0085, (WT vs. cncg15cGOF + Sm2011) p = 0.5687. 5-O-Methylgenistein: (WT vs. cncg15cGOF) p = 0.0747, (WT vs. WT + Sm2011) p = 0.7335, (WT vs. cncg15cGOF + Sm2011) p = 0.1180. Quercetin7-O-glucoside: (WT vs. cncg15cGOF) p = 0.0445, (WT vs. WT + Sm2011) p = 0.7858, (WT vs. cncg15cGOF + Sm2011) p = 0.1657. Quercetin 3,7-diglucoside: (WT vs. cncg15cGOF) p = 0.1176, (WT vs. WT + Sm2011) p = 0.0064, (WT vs. cncg15cGOF + Sm2011) p = 0.0004. Kaempferol: (WT vs. cncg15cGOF) p = 0.2197, (WT vs. WT + Sm2011) p = 0.7981, (WT vs. cncg15cGOF + Sm2011) p = 0.0402. Relative abundance of flavonoids identified across root of WT after 5 weeks of growth in presence or absence of R. irregularis (AM), two-tailed unpaired t-test with a prior F-test for homoscedasticity. Isoliquiritigenin (WT vs WT + AM) p = 0.0239, Glycitein (WT vs WT + AM) p = 0.0037, Retusin-flavonol (WT vs WT + AM) p = 0.0186, Quercetin 3,7-diglucoside (WT vs WT + AM) p = 0.0243, Kaempferol (WT vs WT + AM) p = 0.0168, non-significant (n.s.). Source Data

Comment in

  • Calcium beats for better crops.
    Tena G. Tena G. Nat Plants. 2025 Feb;11(2):148. doi: 10.1038/s41477-025-01935-9. Nat Plants. 2025. PMID: 39948262 No abstract available.

References

    1. Parniske, M. Arbuscular mycorrhiza: the mother of plant root endosymbioses. Nat. Rev. Microbiol.6, 763–775 (2008). - PubMed
    1. Roy, S. et al. Celebrating 20 years of genetic discoveries in legume nodulation and symbiotic nitrogen fixation. Plant Cell32, 15–41 (2020). - PMC - PubMed
    1. Charpentier, M. & Oldroyd, G. E. Nuclear calcium signaling in plants. Plant Physiol.163, 496–503 (2013). - PMC - PubMed
    1. Charpentier, M. et al. Nuclear-localized cyclic nucleotide-gated channels mediate symbiotic calcium oscillations. Science352, 1102–1105 (2016). - PubMed
    1. Dietrich, P., Moeder, W. & Yoshioka, K. Plant cyclic nucleotide-gated channels: new insights on their functions and regulation. Plant Physiol.184, 27–38 (2020). - PMC - PubMed

MeSH terms

LinkOut - more resources